Interact with Dashboard
A static dashboard does not seem to be useful for business users - what if they want to dig deeper into the numbers instead of viewing passively? That's where Holistics's Exploration function comes in.
Data Exploration
At this moment, Holistics supports two primary exploration actions with Dashboard: Date Drill and Explore.
However, please note that you at least need to have Explorer role to interact with the Dashboard shared with you, Viewers and Public users (view Dashboard via Shareable Link and Embed Link) can only view the Dashboard and cannot explore it.
Date Drill
When a visualization has a date/date-time axis, you can drill at different time levels (year, month, date, hour, minute...).
For example, a user views sales amount broken down by year could drill down to see the same metric broken down by quarter/month/day...
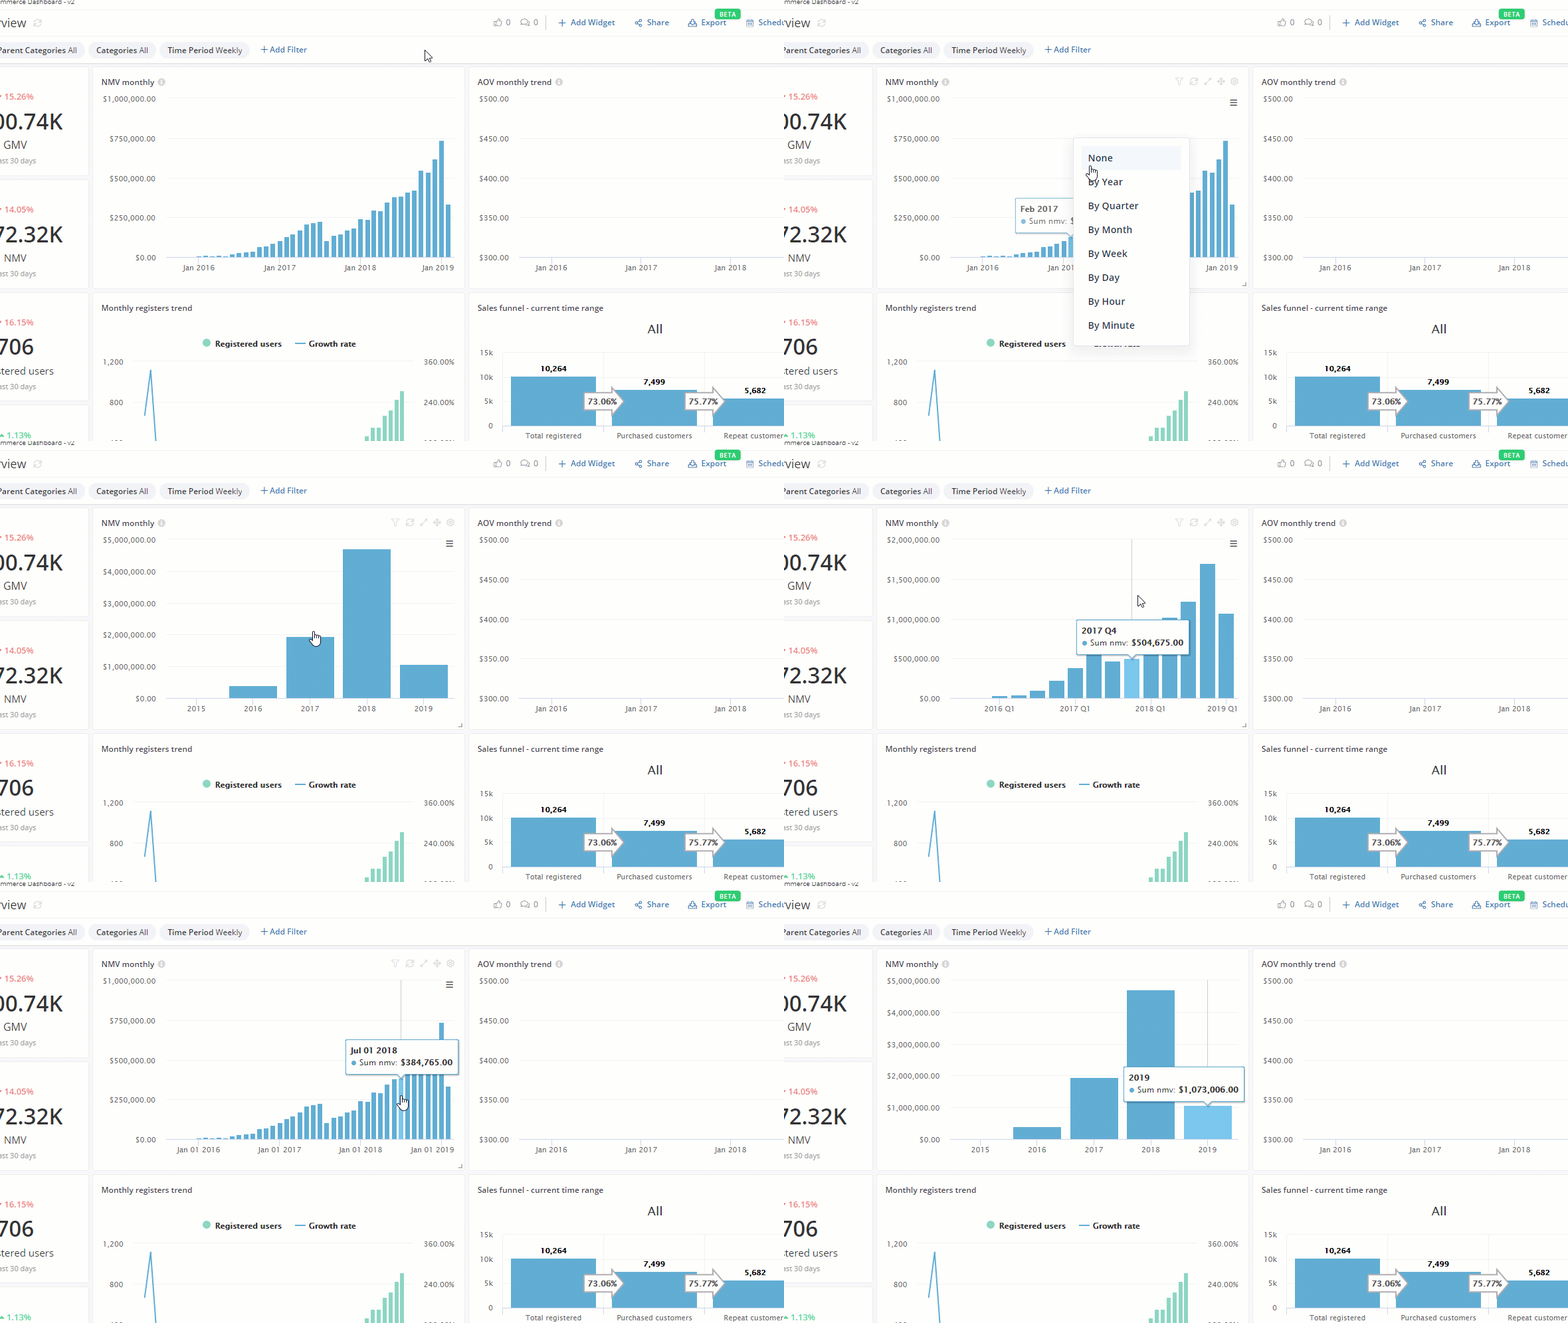
Simply right-click on the chart → select a period → the chart will show the values aggregated up to that time period.
Explore Data
Explore Data give users the flexibility to dig deeper into the data, ask questions and make adjustments to reports without Analysts' support.
Here I just simply right-click on any chart/table and click Explore. Then, a pop-up with drag and drop interface will be shown so that I can change the visualization preferably:
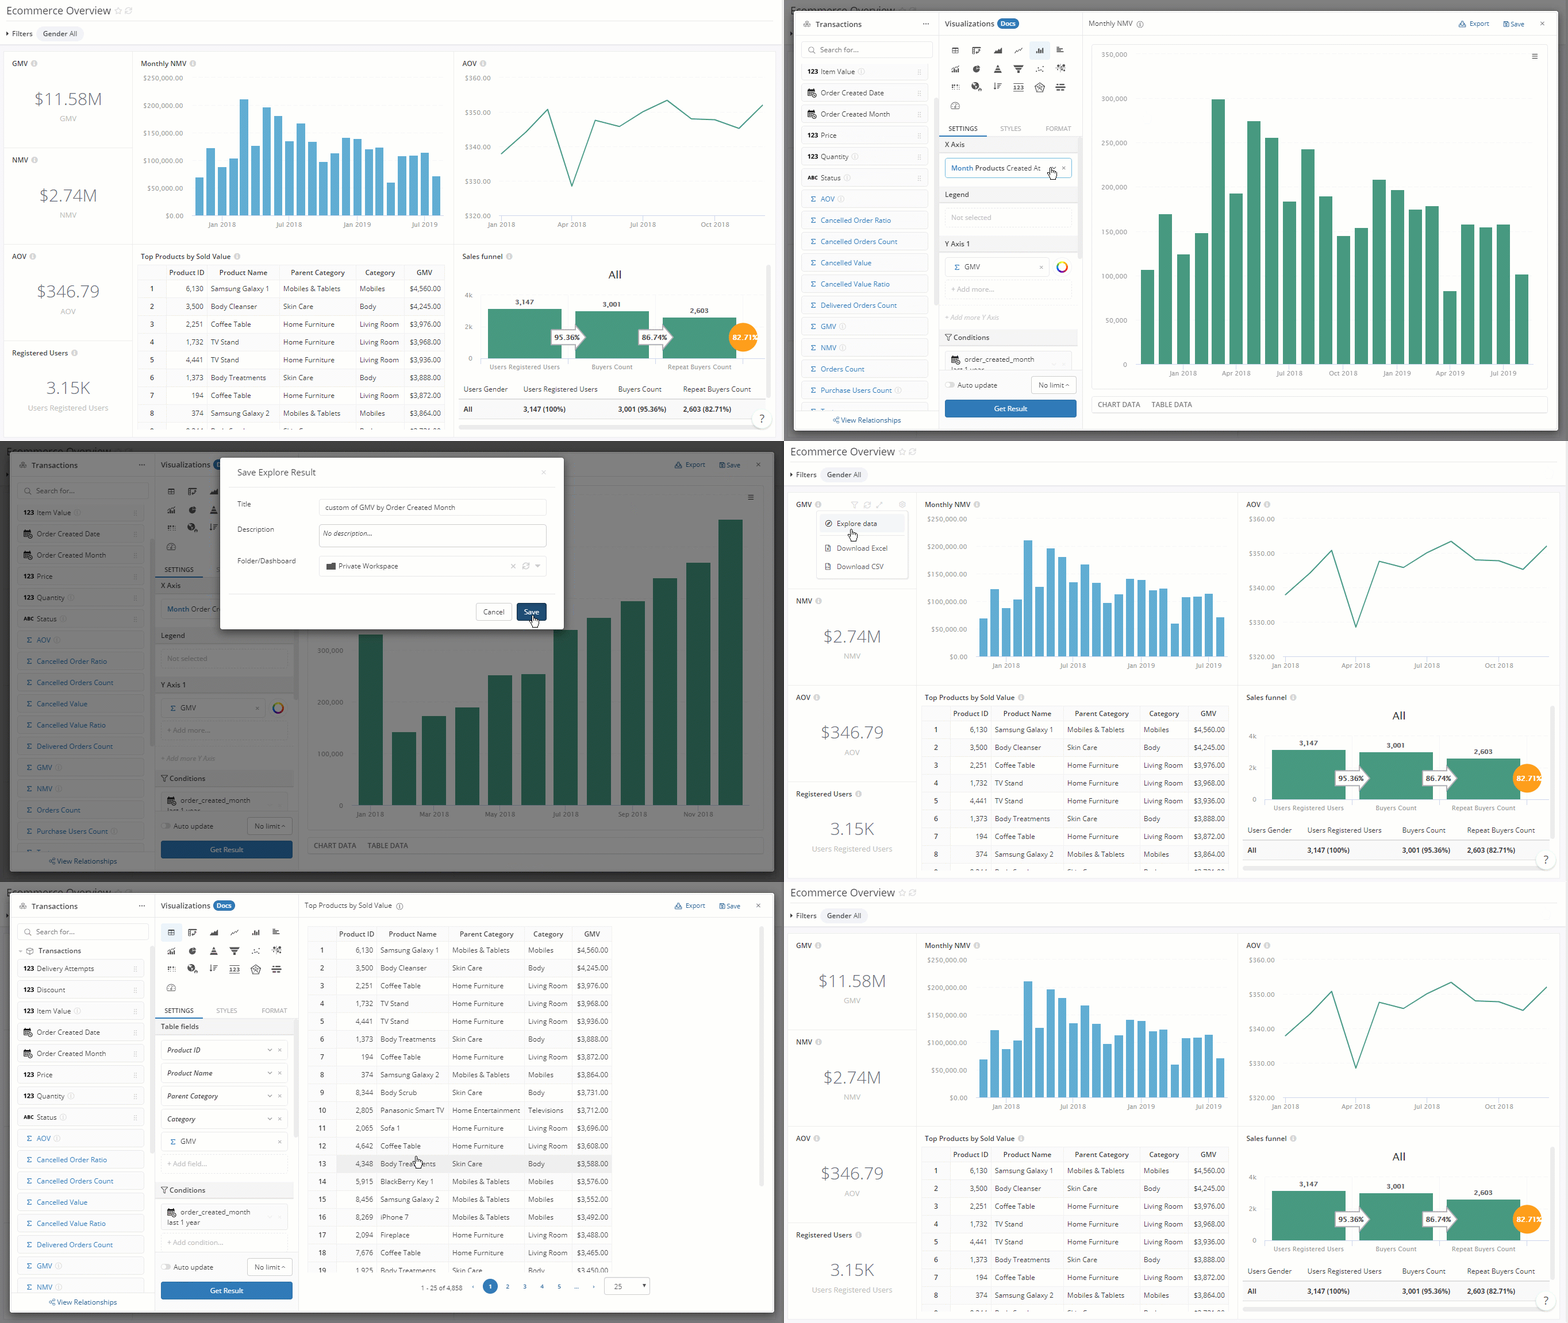
Please note that changing the visualization in this view does not affect the report you are exploring unless you choose to override it. After you satisfy with your exploration result, you can click Save.
For more detailed information, please refer to our docs: Explore data
Communication with team
You can comment directly on reports/dashboards to ask questions, provide information or discuss the results. Anyone with access to a Report/Dashboard can see its comments.
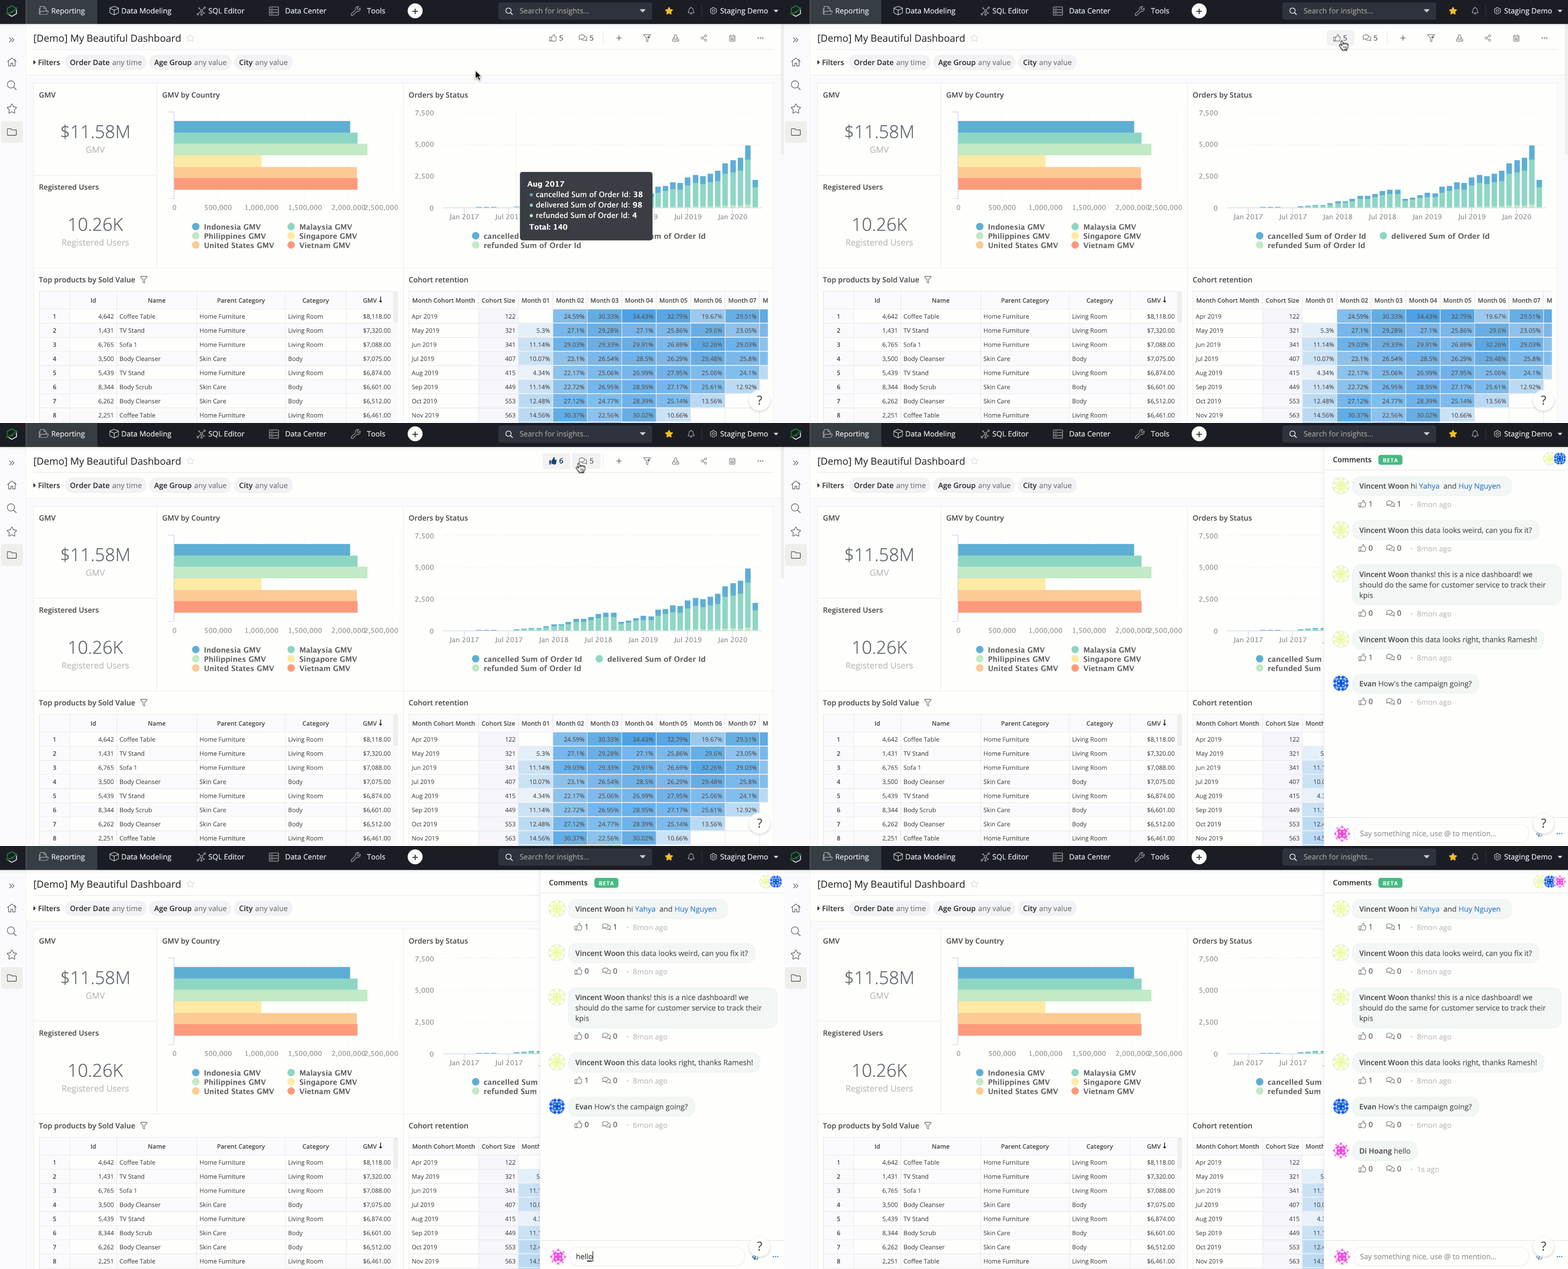
To comment on a Dashboard, click on the Comments button to open the comments panel, add a comment by typing into the text box at the bottom of the panel.
To reply to a comment, click Reply.
Get the most updated data
To maximize the performance of the dashboard and reports when presenting data, the result-set of your reports will be stored in our cache for some time (24 hours by default).
If you find the presented data in your Dashboard too obsolete, you can manually refresh the cache to get the most updated data from your database.
Please note that to avoid high load to your database, we only allow admins and dashboard's owners to refresh the dashboard or its' widgets inside. For now, Explorers, Viewers, and Public users cannot use this operation.
Refresh Dashboard
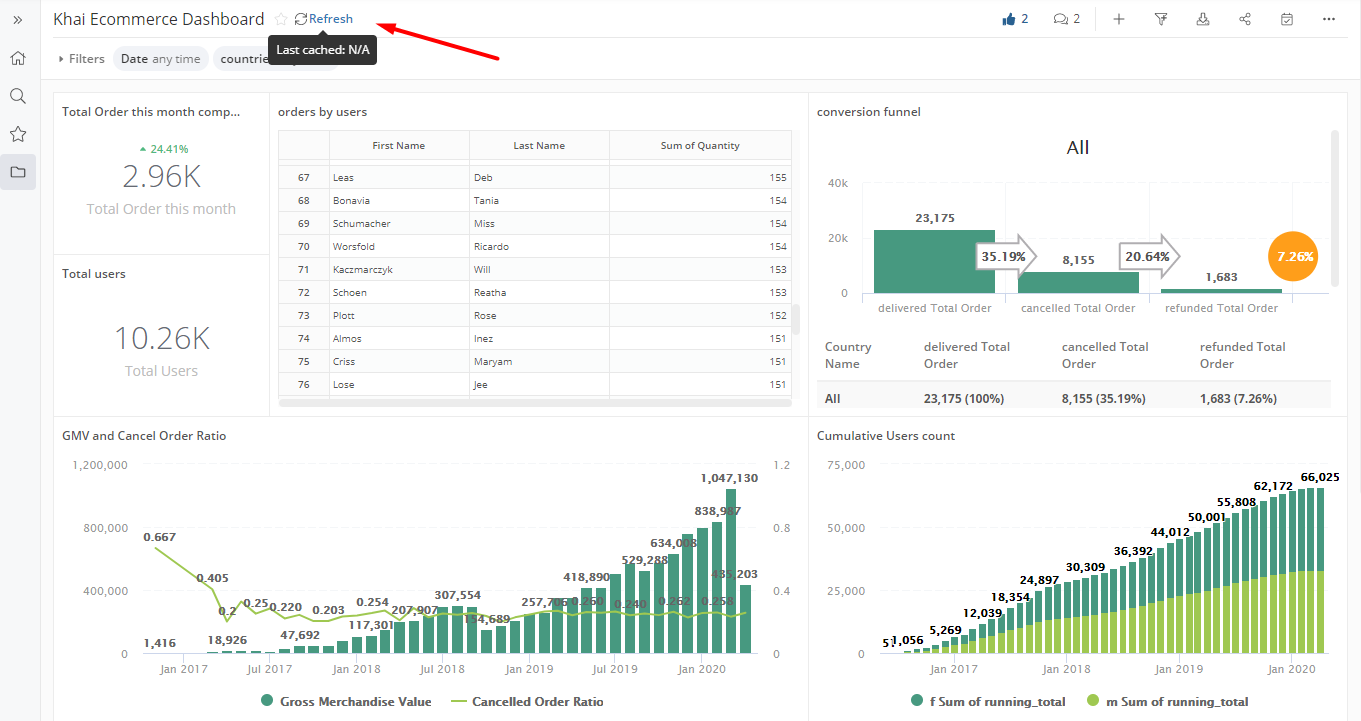
Simply click on the Refresh button next to the Dashboard's title to refresh the whole Dashboard.
Refresh Widgets
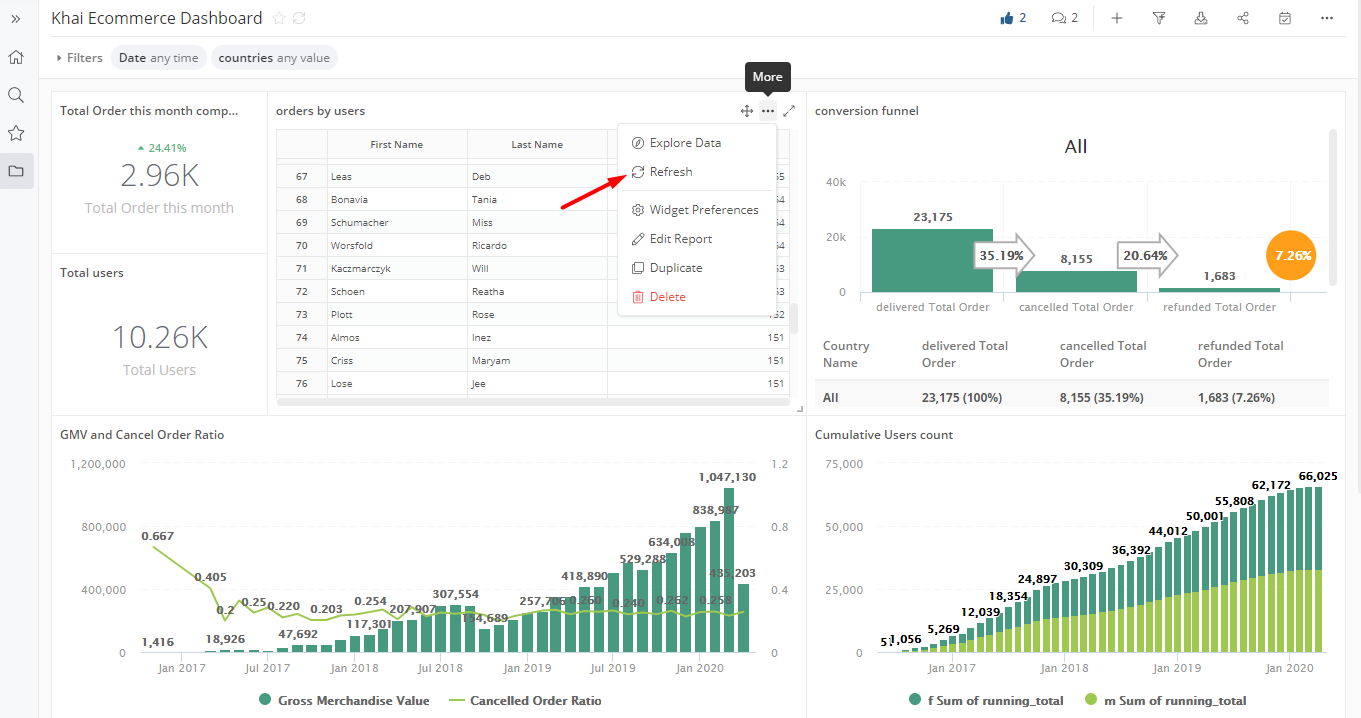
If you only need to refresh certain widgets, click on more option in the widget and refresh.
Other actions
Zoom in/out
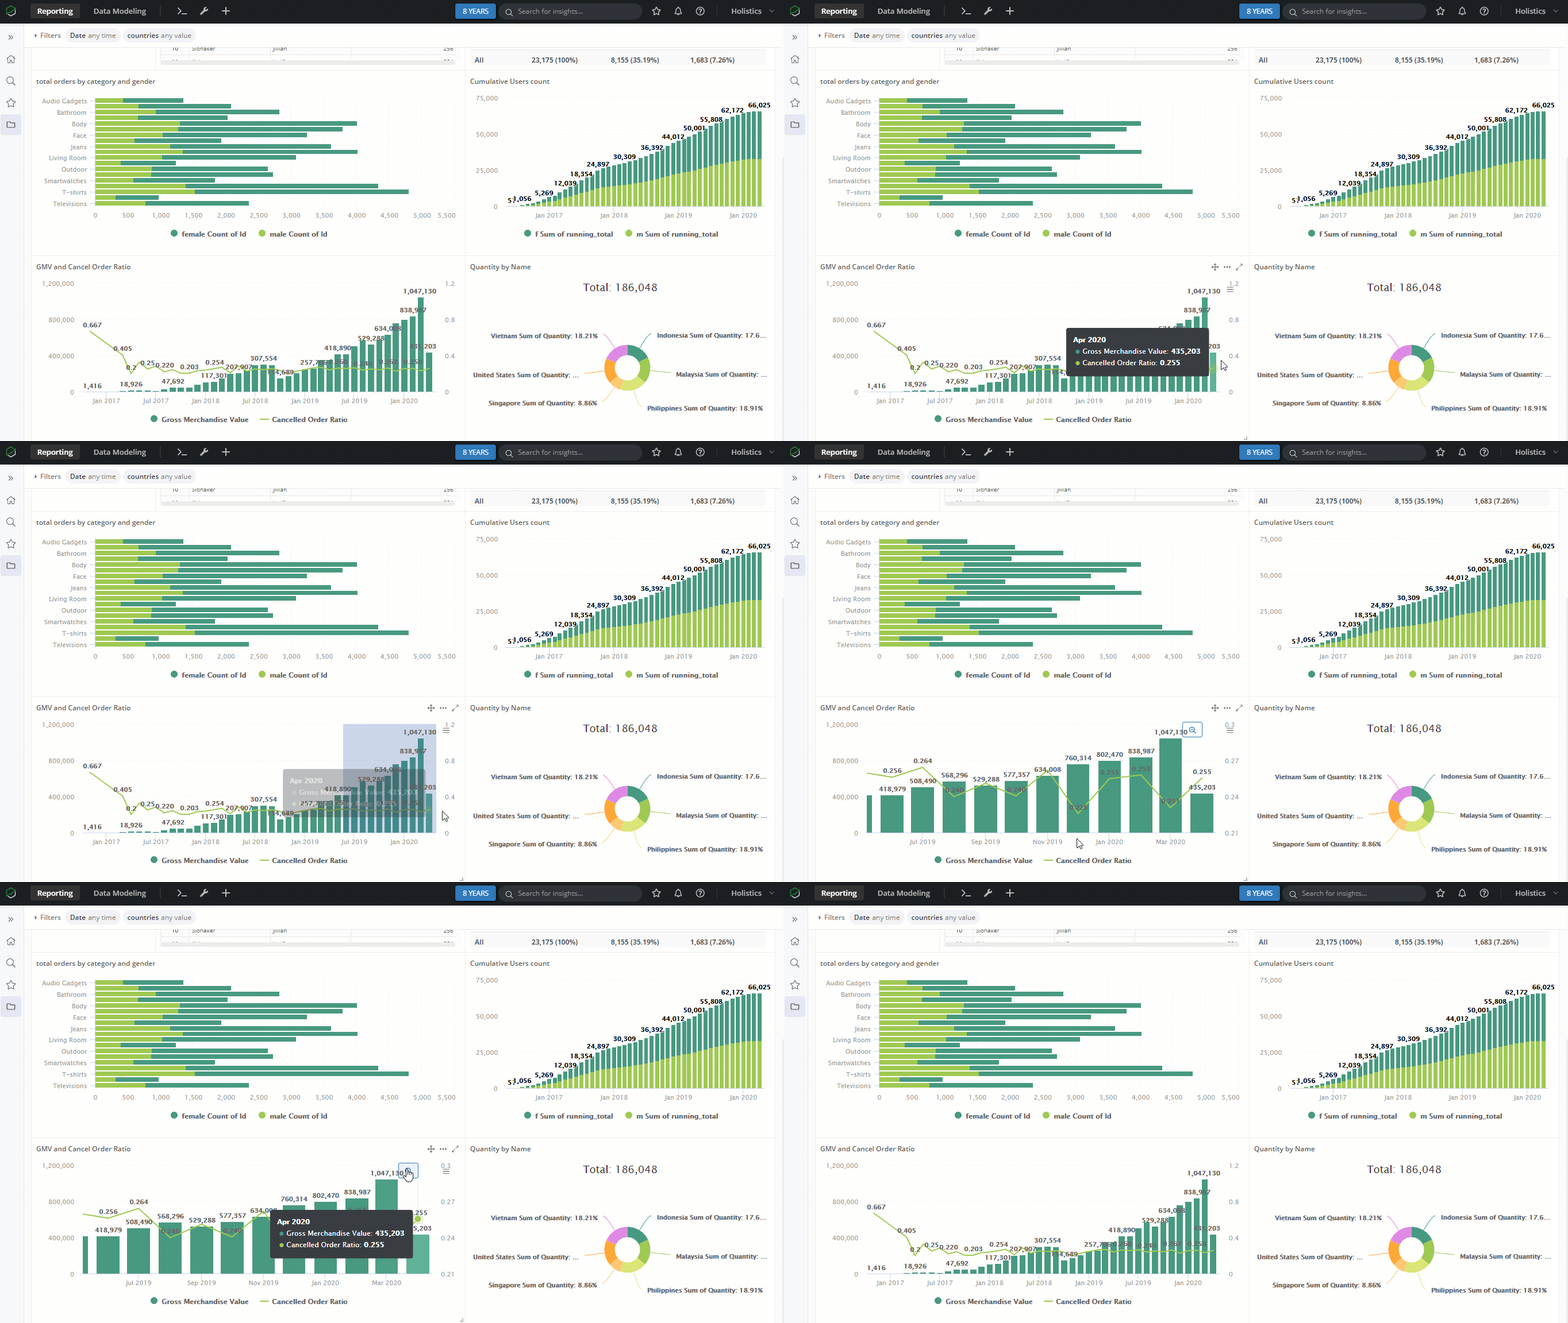
You can zoom in/out the chart to see more details of the data
Expand Widget
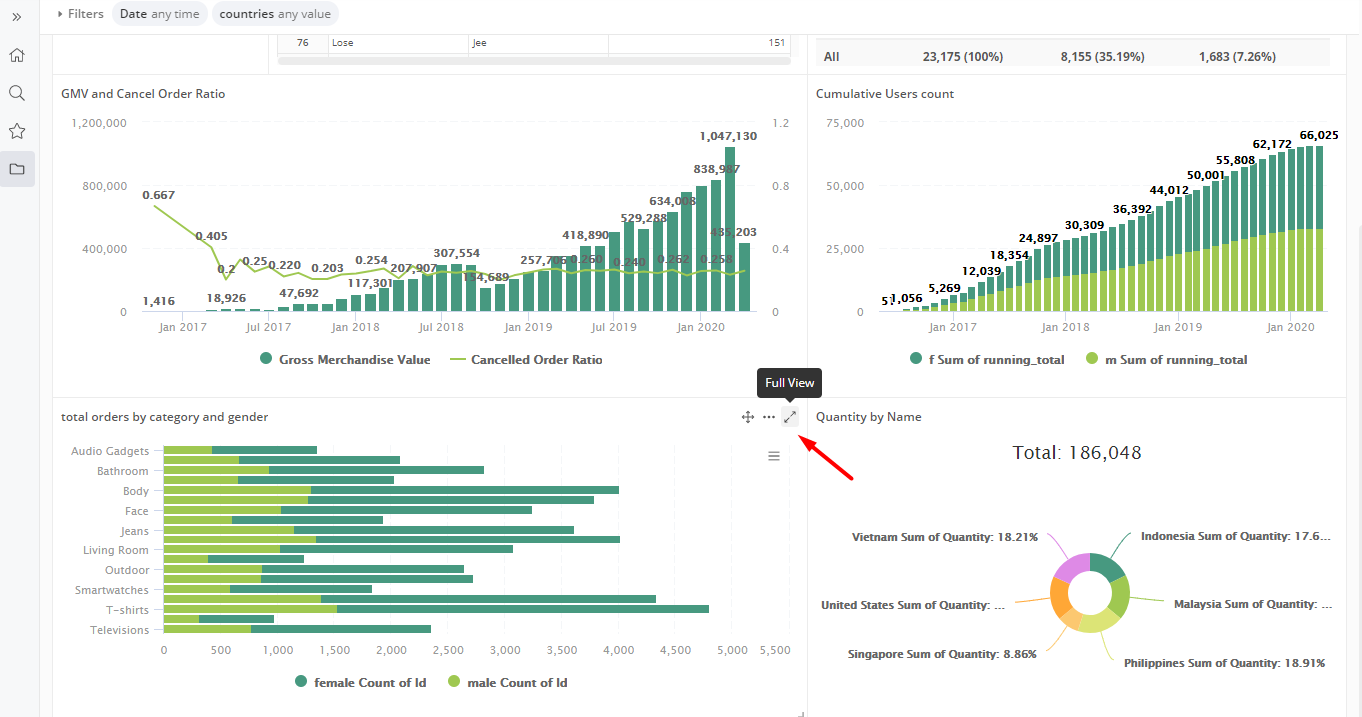
If you find the visual of a Widget too small, you can also expand it to have a larger view.
Move Widget
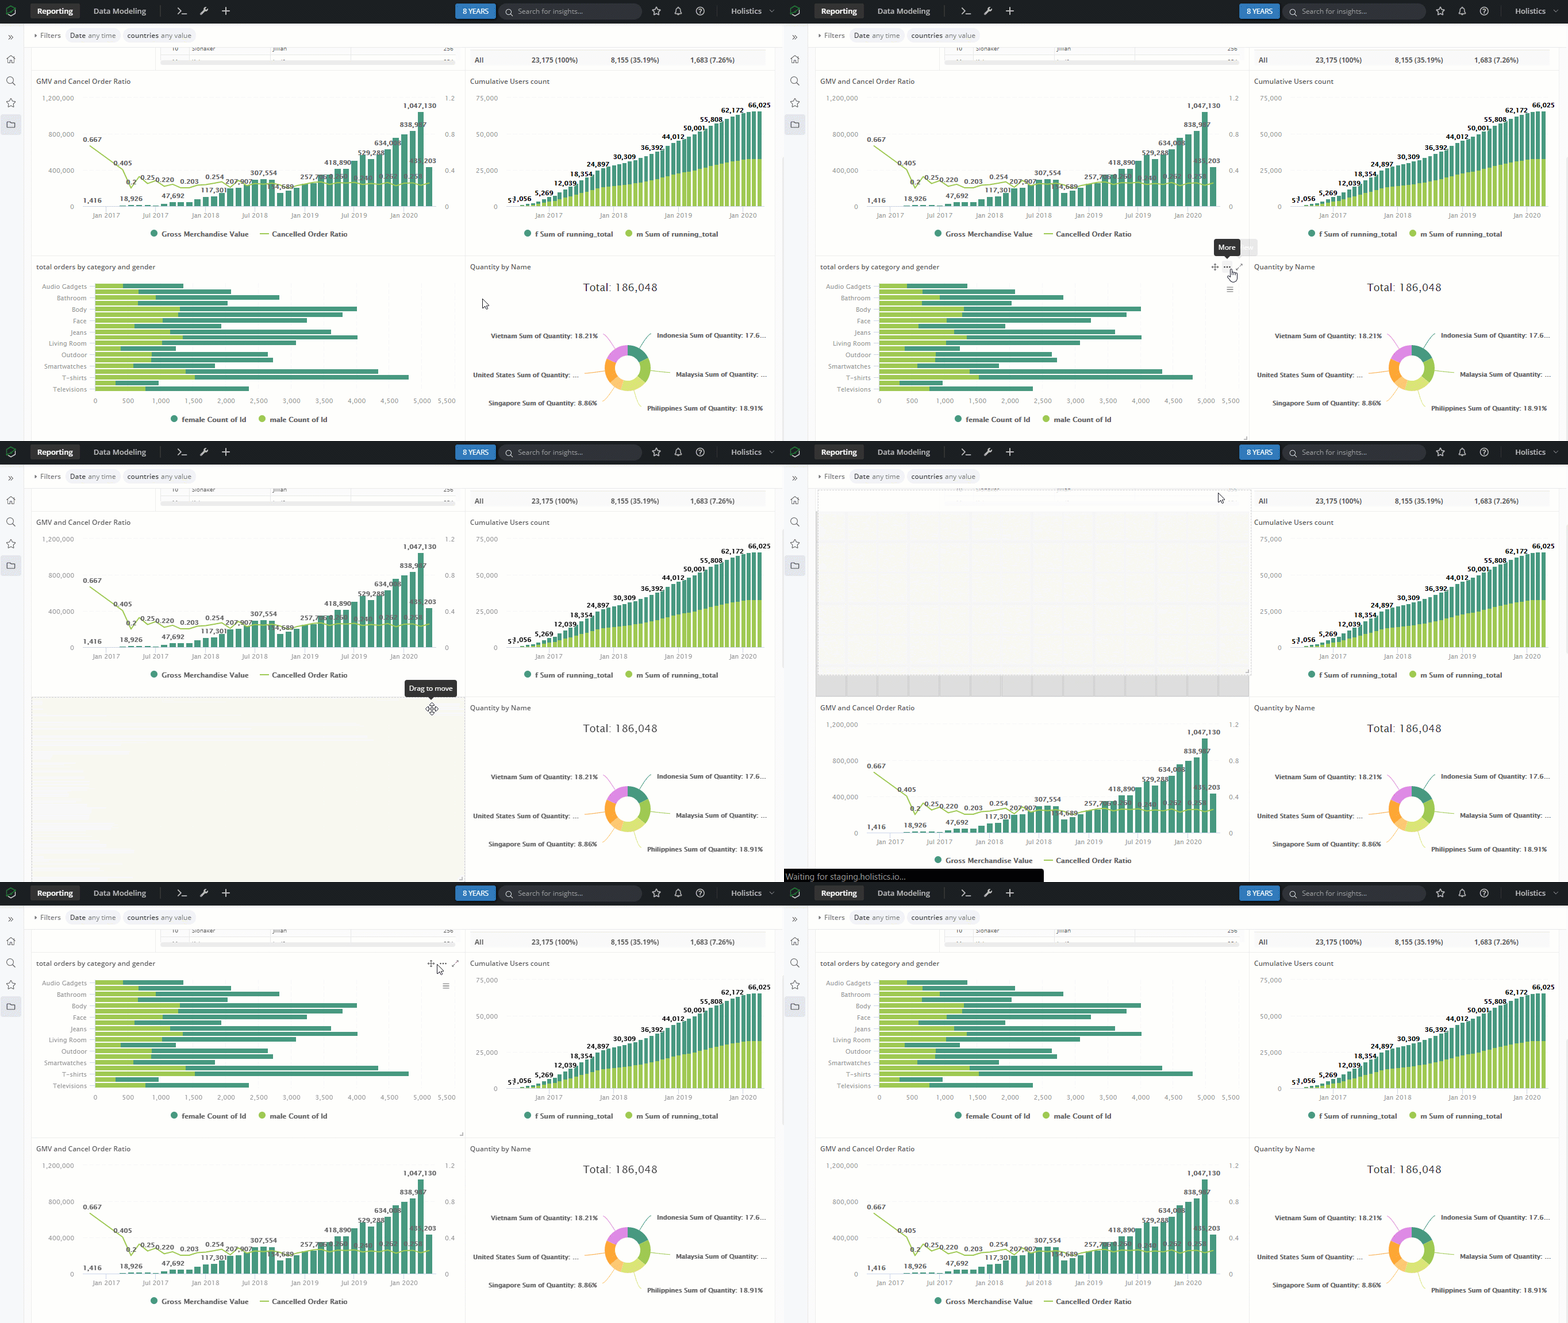
You can also re-arrange the widget's position as your preference.
Duplicate Widget on the same dashboard
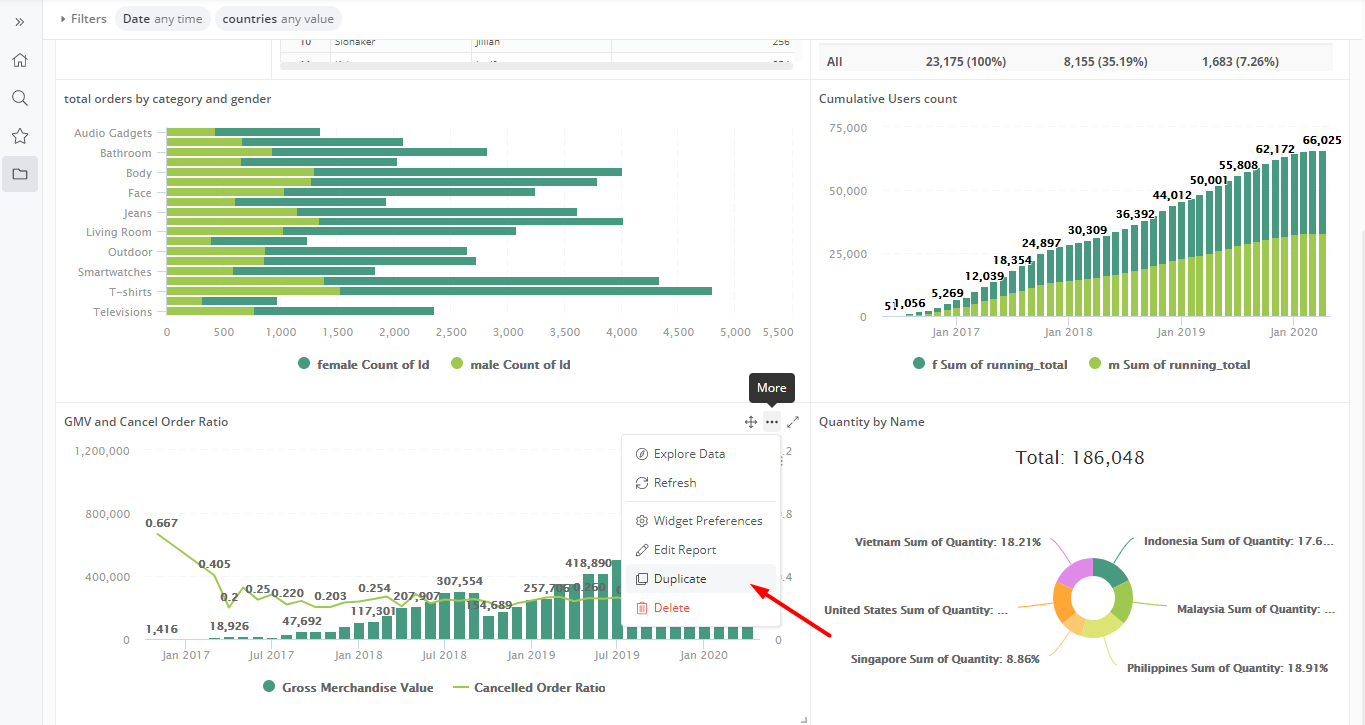
If you want to create a new widget on the current dashboard that is only slightly different from the existing one (for example, different conditions, different aggregation levels... but same metrics), you can click on More menu, select Duplicate and make changes to the new widget.
Clone widget to another dashboard
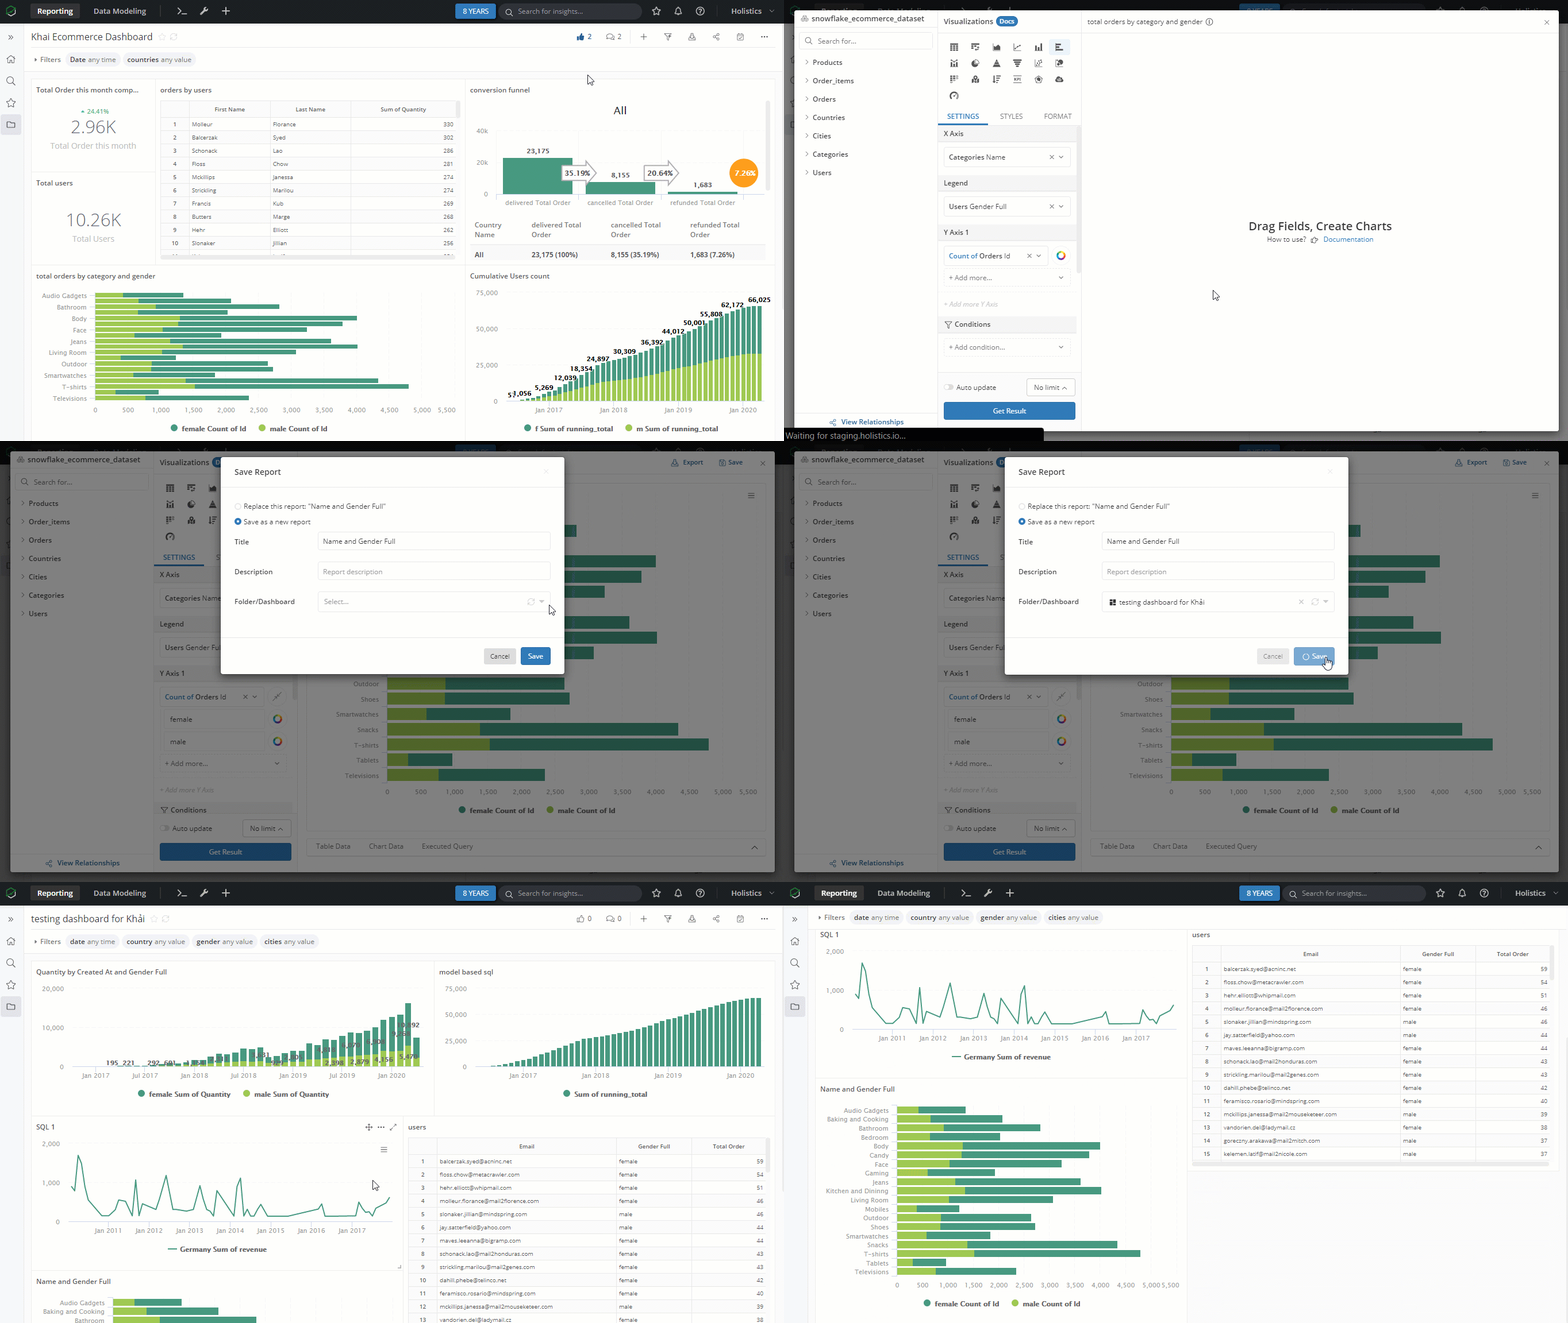
At the moment, you can clone a widget from a dashboard to another one by following these steps:
- Explore the Widget
- Click Save
- Select the dashboard that you want to save the widget, and click Save to finish
A new widget will appear in that dashboard with the same visualization with your original widget.
