Aggregate Awareness: Optimize query performance with pre-aggregates
Automatically pick the most optimal aggregated tables per each query for maximal query performance.

Contents
As data volumes grow, large raw tables with millions to billions of rows can slow down query times.
To optimize performance, data analysts often build pre-aggregated tables. These tables store condensed versions of the data and are used frequently to reduce query time.
However, manually maintaining these tables requires significant effort. Depending on the query's granularity (what fields are required), users need to manually pick the correct table for accuracy and maximum performance.
I'm very excited to share that we're launching the Aggregate Awareness feature to address this exact problem.
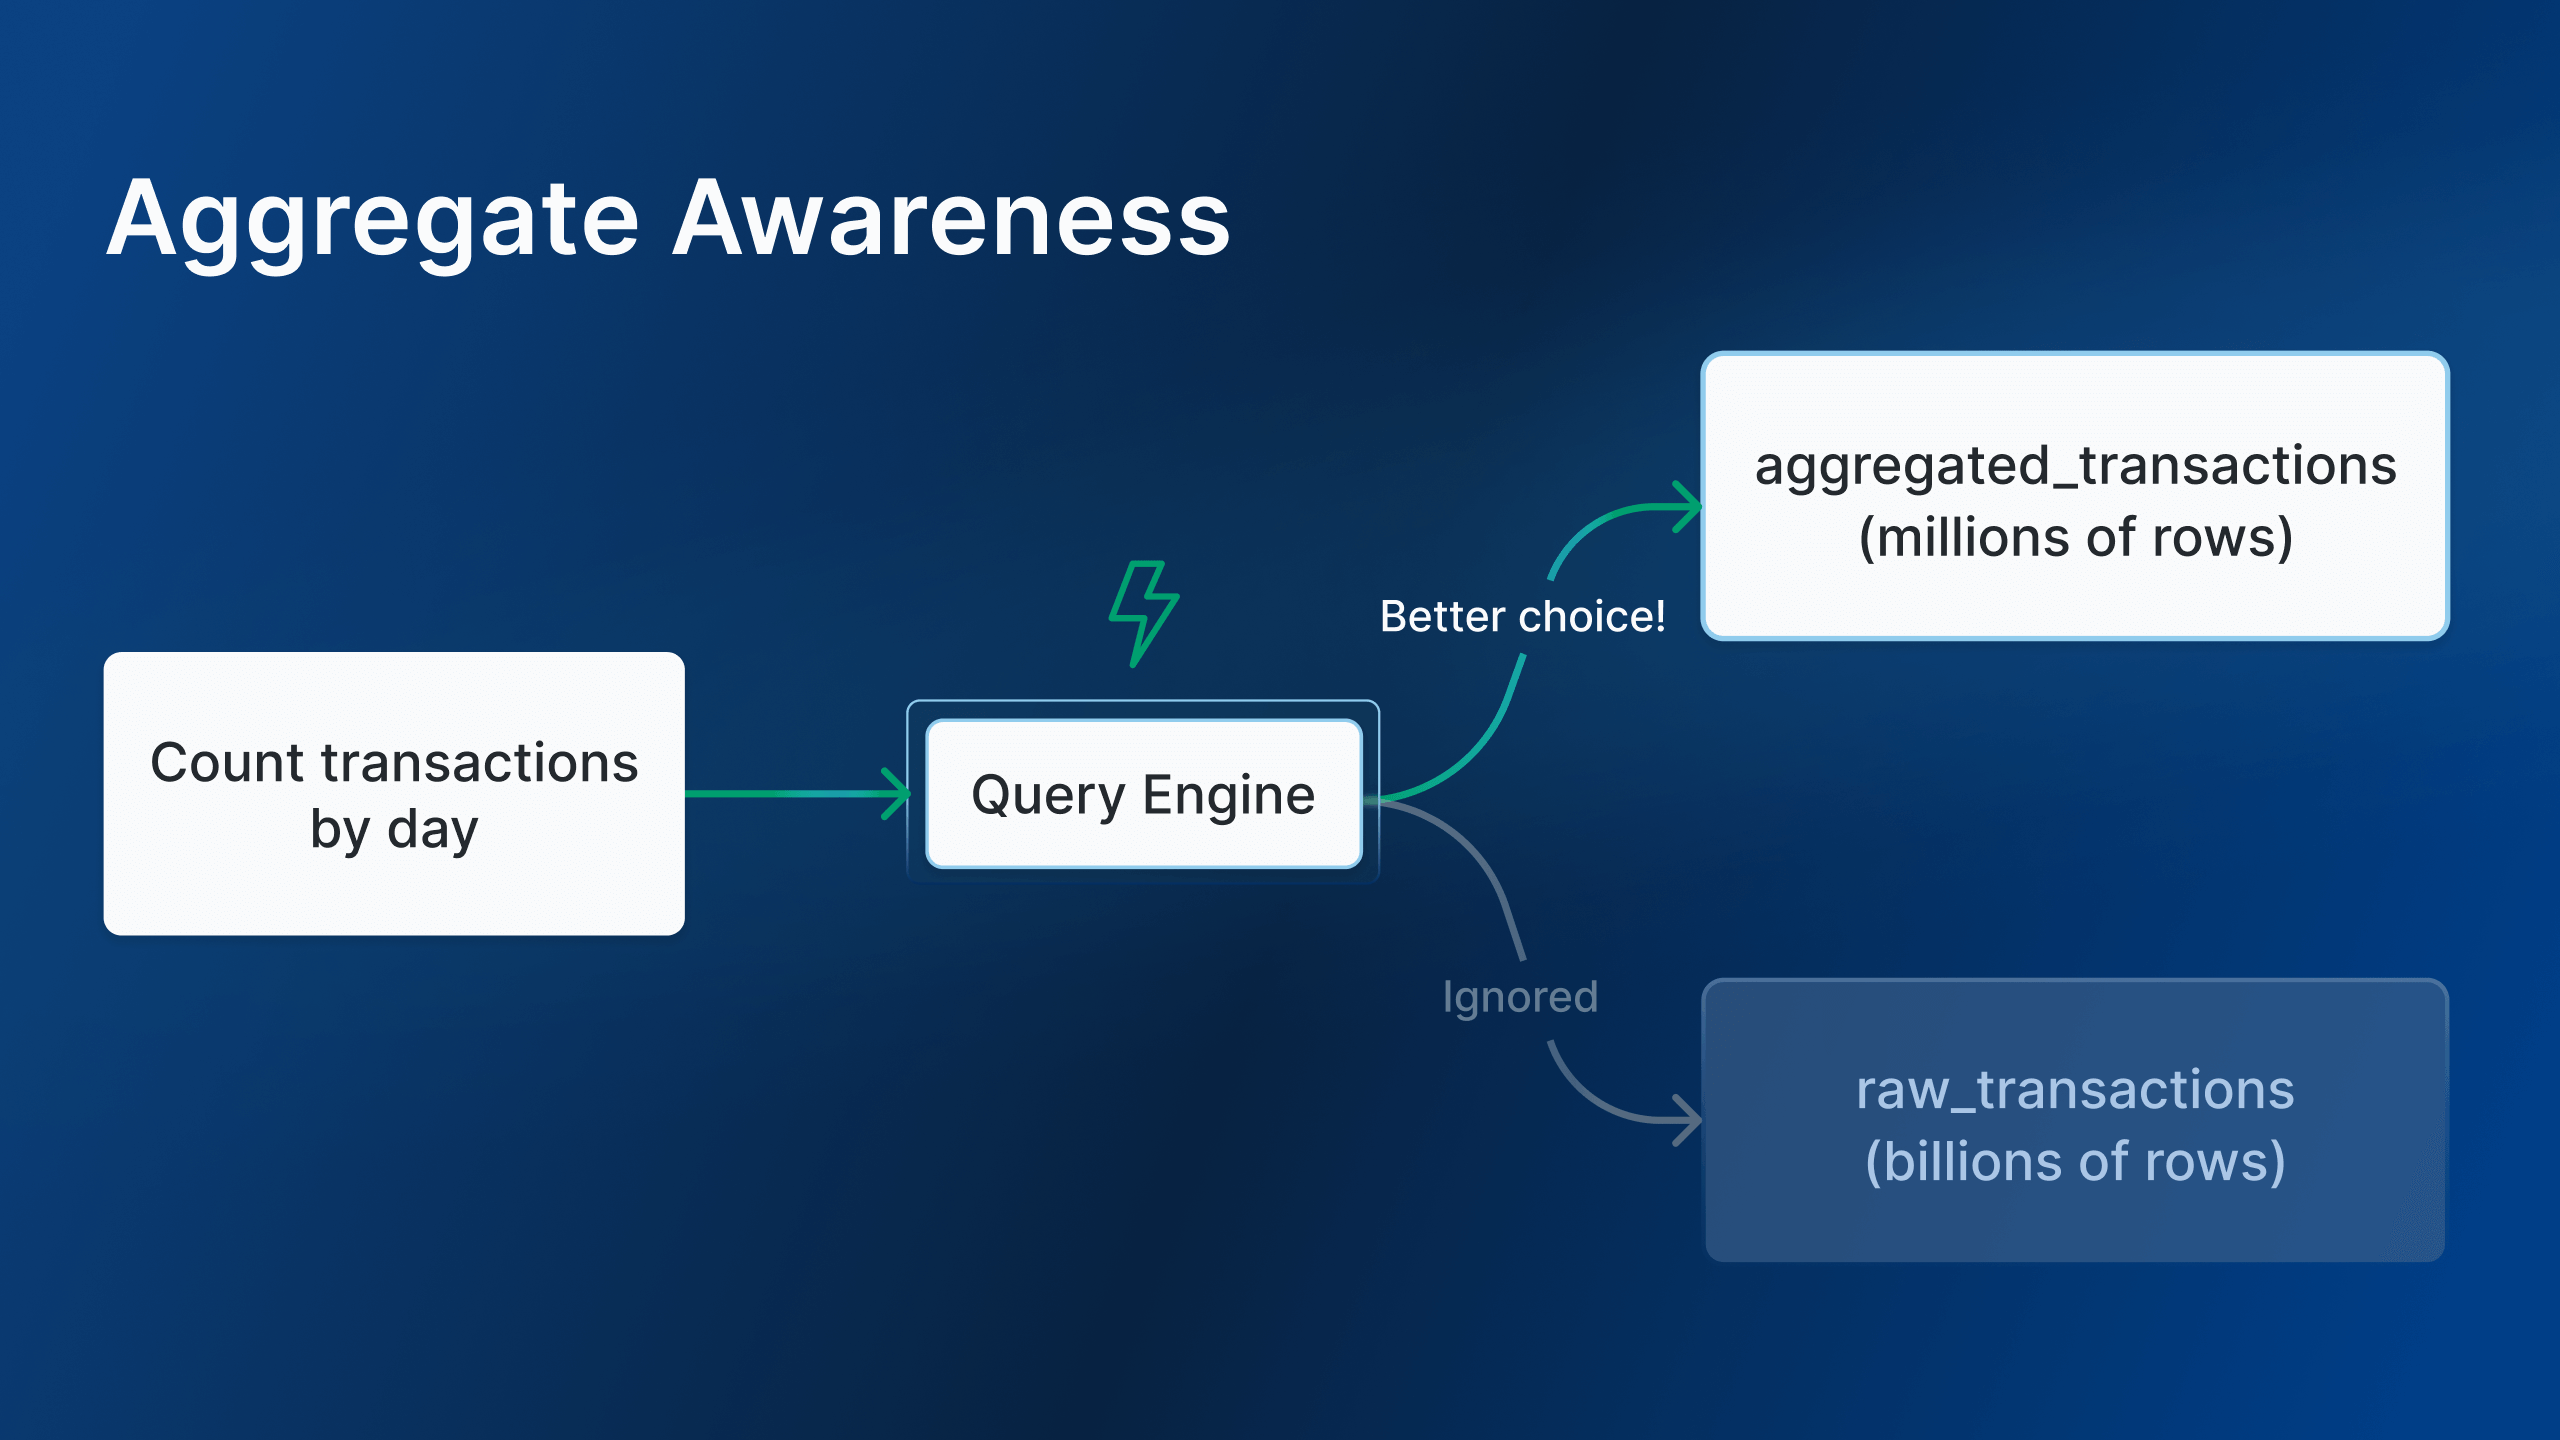
With Holistics Aggregate Awareness, the query engine automatically selects the appropriate table based on the query dimensions. It uses smaller pre-aggregated tables to deliver accurate results, allowing analysts to maintain pre-aggregates with less effort.

The agg_transactions is the aggregated version of the raw_transactions table. So, depending on the fields queried, the engine will automatically prefer the aggregated table for better performance when possible.
How Aggregate Awareness Works in Holistics
Aggregate Awareness can be set up in just two simple steps:
- Define the Pre-Aggregate in the dataset to map between the raw tables/models and the pre-aggregated tables.
- Create the pre-aggregated table by using either the external tools (like dbt, Airflow, etc.) or the built-in persistence option in Holistics
When you run a query, Holistics will automatically pick the right pre-aggregated tables with just enough information to answer the data question. Therefore, instead of processing millions or billions of raw records, the query only needs to process fewer aggregated rows, leading to faster results.
Let’s see how Aggregate Awareness can help you optimize the query in a quick example below.
What Makes Holistics Aggregate Awareness Different?
Holistics Aggregate Awareness includes industry-standard features, but we go further, making it easier and more effective for analysts to use.
Reusable Configurations When Defining Multiple Pre-aggregates
When setting up Aggregate Awareness in most BI tools, analysts often need to build multiple pre-aggregated tables with similar configurations. This repetition can be a maintenance hassle, especially when the tables have the same metrics but different time or dimension granularity.
With Holistics, pre-aggregated tables can be built and extended using our home-grown AML language, simplifying this process and effectively solving the hassle.
In the example below, monthly and weekly aggregates are built by extending the existing daily aggregate and modifying only the time granularity.
PreAggregate aggr_movie_ratings_daily {
  dimension timestamp {
    for: ref('public_ratings', 'timestamp')
    time_granularity: 'day'
  }
  dimension timestamp { ... }
  measure highest_rating { ... }
  measure lowest_rating { ... }
  measure count_rating { ... }
  persistence: { ... }
}

pre_aggregates: {
  aggr_movie_ratings_monthly: aggr_movie_ratings_daily.extend({
    dimension timestamp {
      for: ref('public_ratings', 'timestamp')
      time_granularity: 'month'
    }
  })
  aggr_movie_ratings_weekly: aggr_movie_ratings_daily.extend({
    dimension timestamp {
      for: ref('public_ratings', 'timestamp')
      time_granularity: 'week'
    }
  })
  aggr_movie_ratings_daily: aggr_movie_ratings_daily
}
Check out the full example here.
Join Awareness (aka. Smart Join Substitution)
In many other BI platforms, Aggregate Awareness is limited to working with dimensions within the pre-aggregated tables only.
Holistics, however, can utilize the foreign relationships to extend the smart aggregations to other dimensions, not in the aggregated tables.
Let’s say we have these two tables: ratings and movies. Because our users often want to see rating counts per movie, we build a movie count pre-aggregate with two fields (movie_id, count_rating).
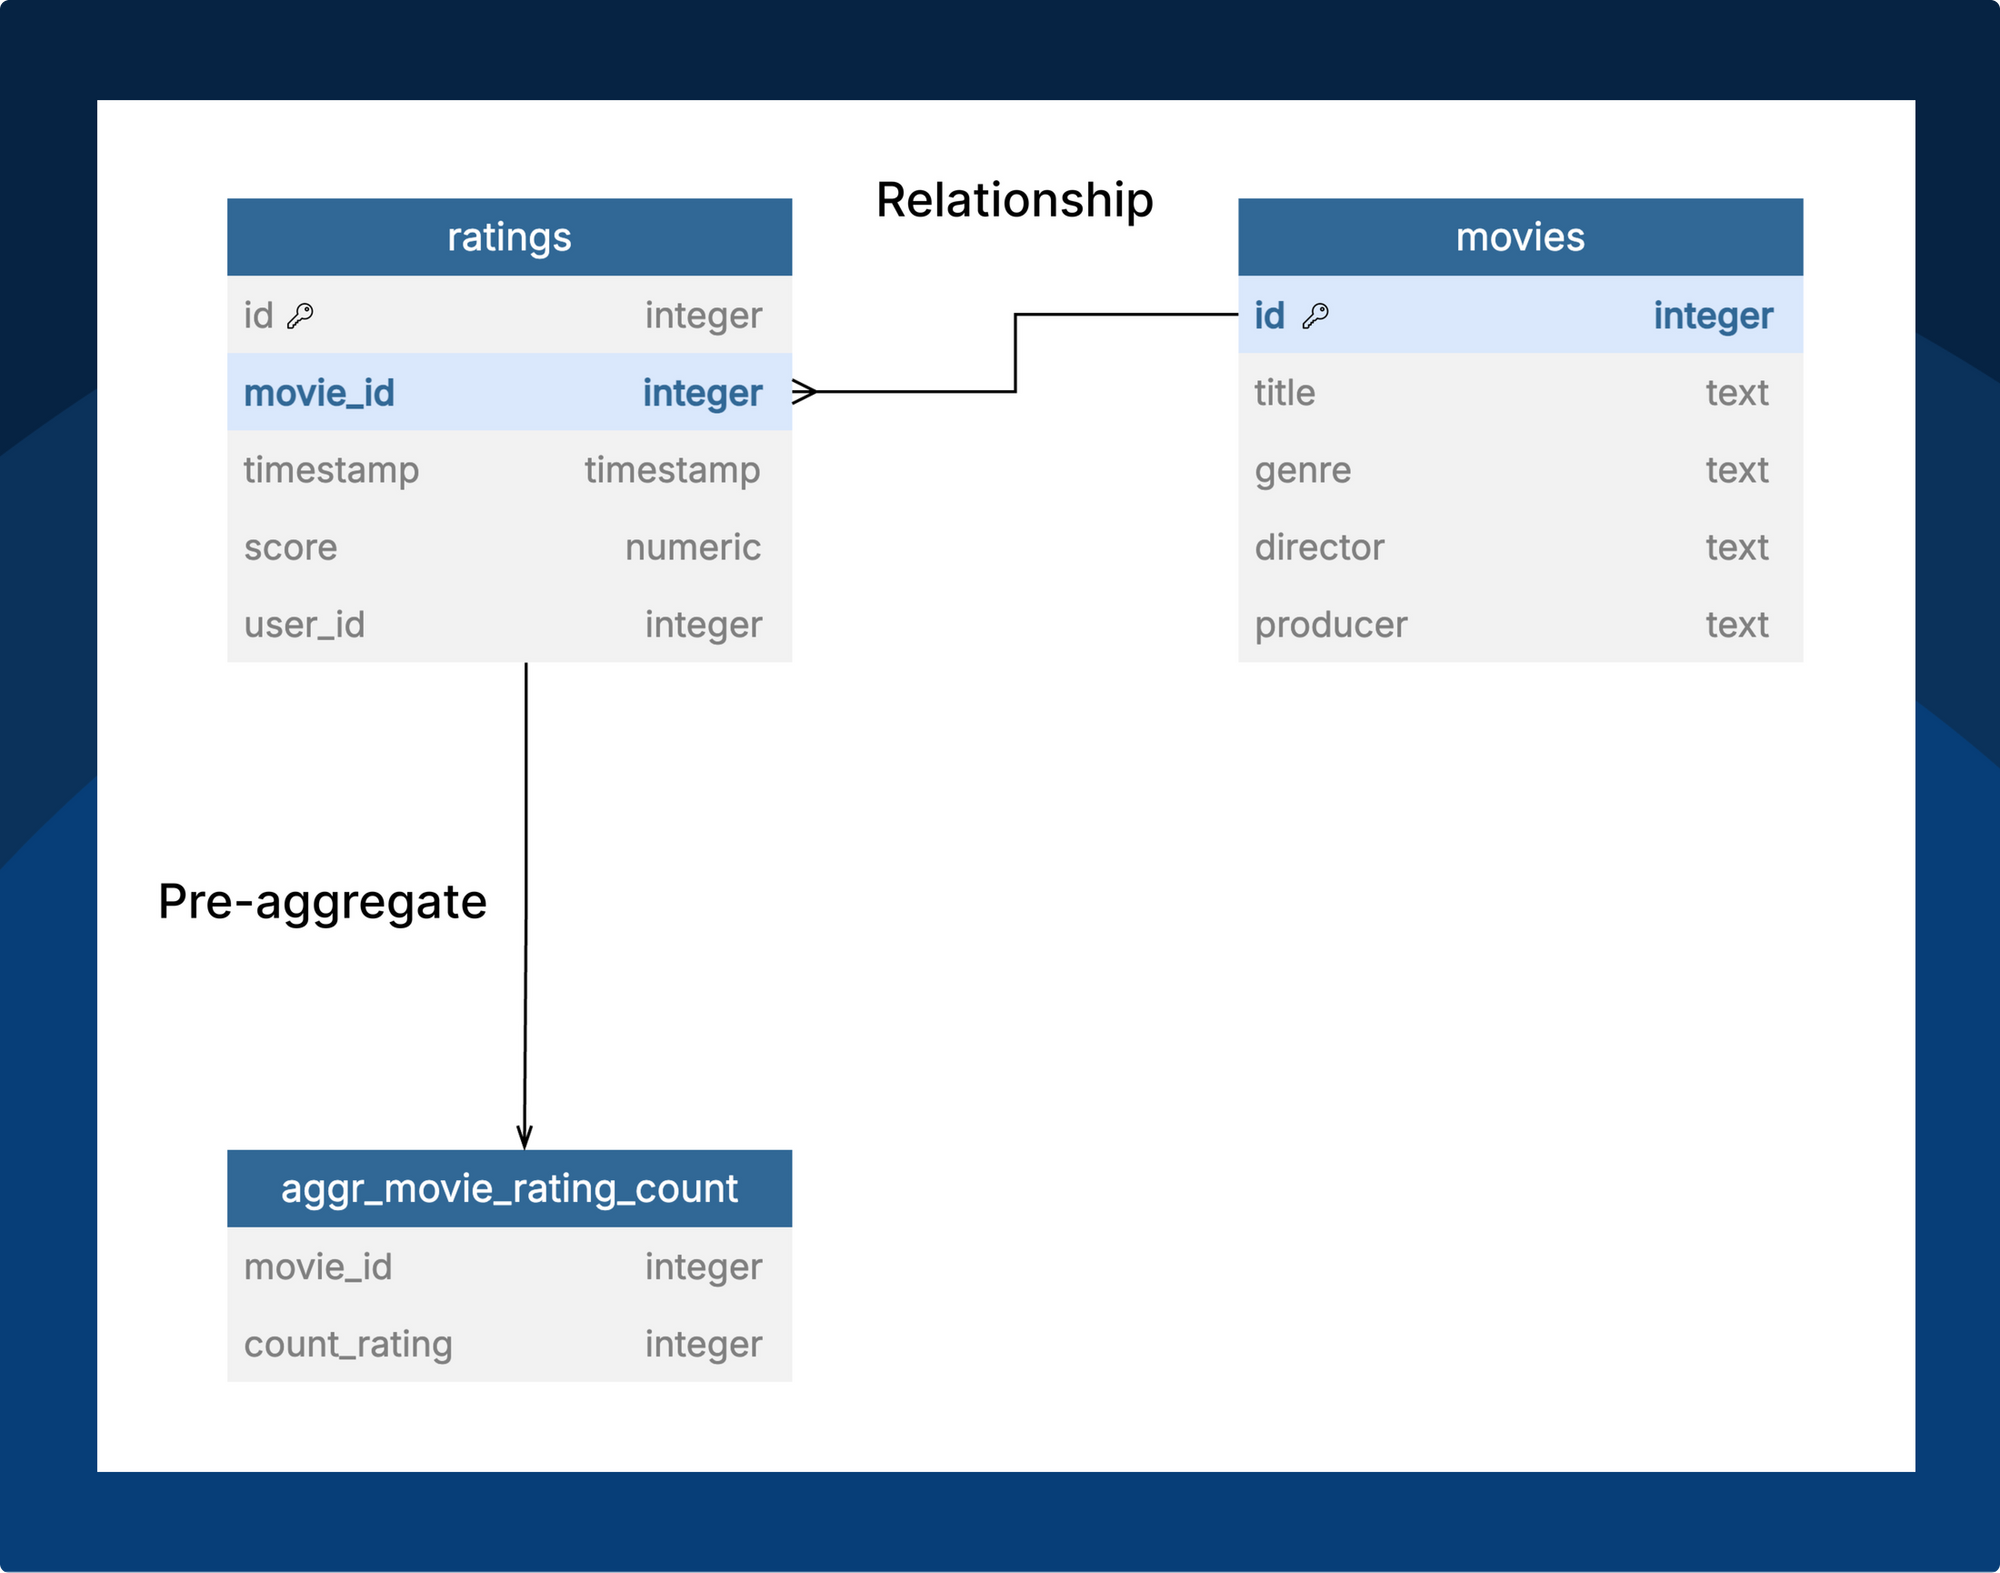
The above aggregation setup can handle “Count of ratings by Movie ID”, but what if we want “Count of Ratings by Movie Title”?
In many other BI platforms, we would need to either:
- Add Movie Title to the existing pre-aggregate: (Movie ID, Movie Title, Count Rating)
- Create another pre-aggregate with two fields: (Movie Title, Count Rating)
Both methods require additional maintenance and data storage costs. It also repeats when users want another dimension, like Movie Genre.
In Holistics, Aggregate Awareness is aware of the relationships in your dataset and, hence, can perform smart join substitution:
“Count of ratings by Movie Title”:
Querying “Count of ratings by Movie Genre” also utilizes the same pre-aggregate:
Holistics Aggregate Awareness can answer a wider range of questions using just a single pre-aggregate. This reduces the need to build many redundant aggregates.
More examples and explanations can be found here.
Metric Awareness
Rather than being limited to basic aggregations, Holistics is also aware of more complex metrics.
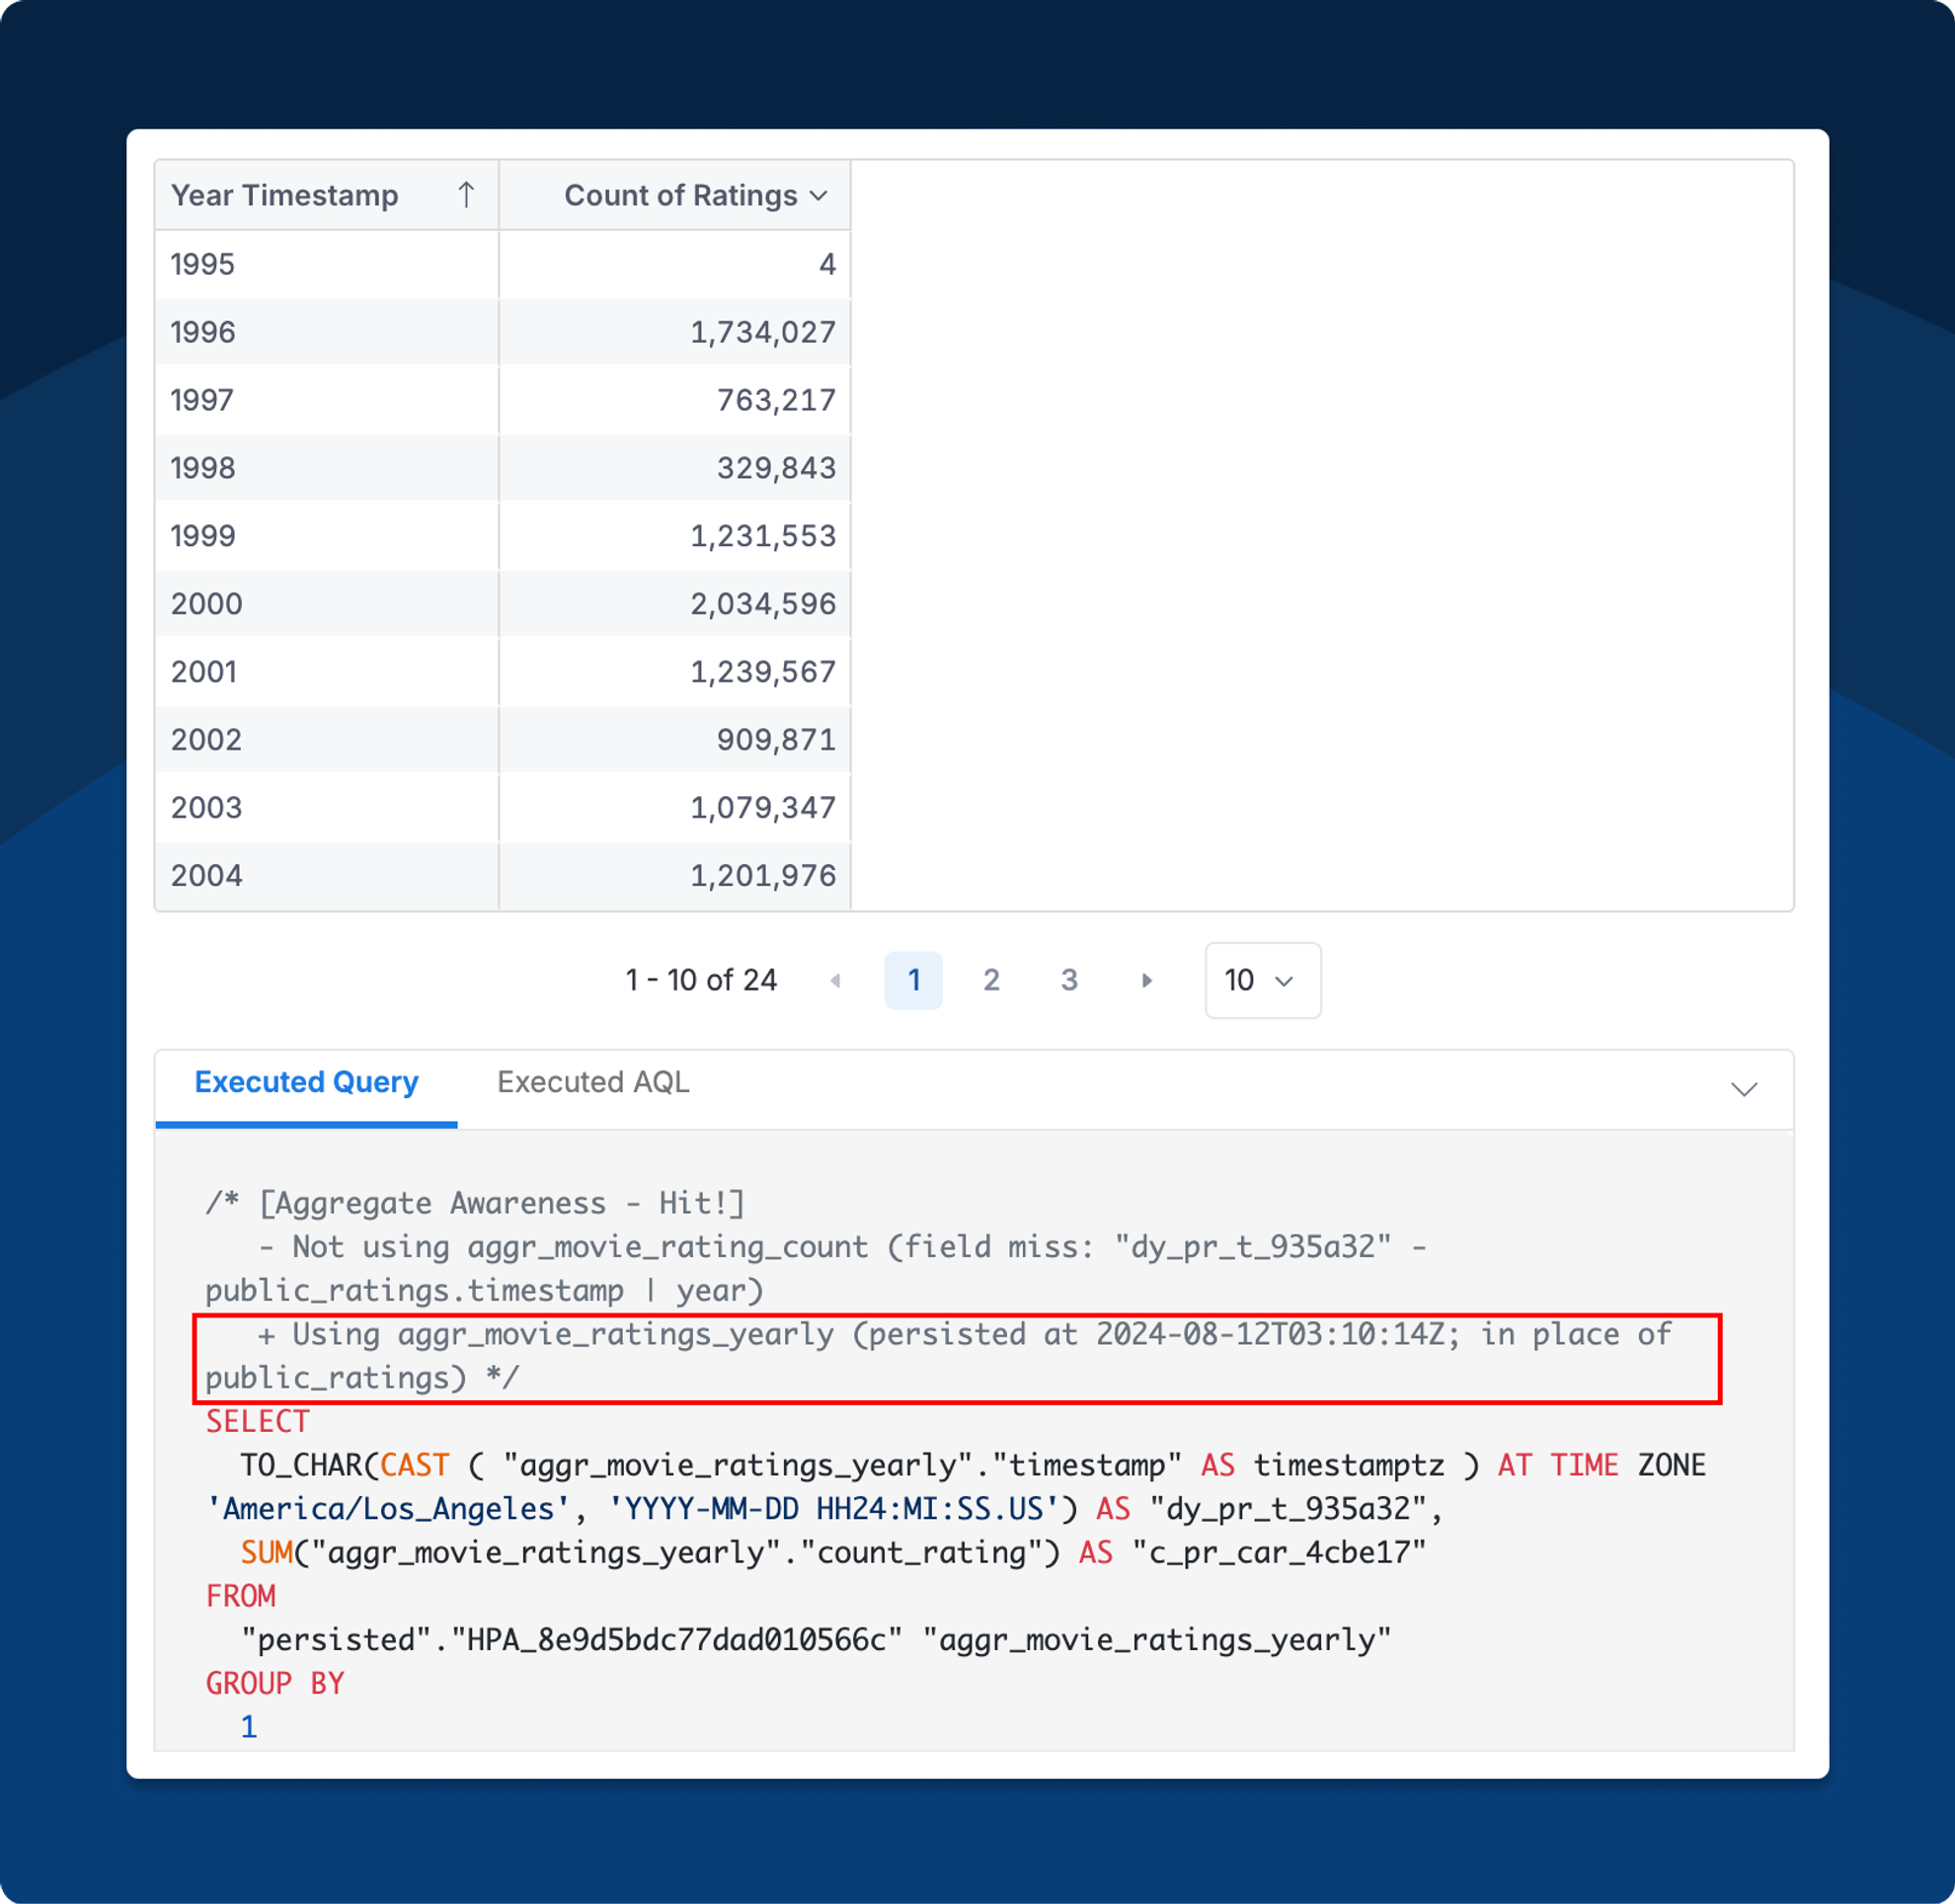
Let’s say we have this report of Count of Ratings by Year:
Now, what if we want the Running Count (instead of just Count) of Ratings?
In many BI platforms, it requires you to write a complicated SQL and set up a new pre-aggregate for this Running Count metric.
In Holistics, it is as simple as adding a single AQL formula:
public_ratings.count_all_ratings | running_total(public_ratings.timestamp)
Aggregate Awareness will automatically use the Count pre-aggregate that we already have, effectively lifting out the heaviest computation (aggregation) in our report query:
Built-in Persistence (aka Table Materialization)
In some BI platforms, analysts have to manually persist their pre-aggregated tables, often relying on external tools like dbt to write the data back to the database. With Holistics, we've simplified this process by offering built-in persistence directly within the platform.
Persistence can be triggered in a few different ways:
- Manual Trigger: Analysts can manually persist tables by clicking a button in the UI, making it easy to refresh data on demand.
- Scheduled Refresh: Use Holistics' built-in scheduling system to automate persistence, ensuring your tables are always up-to-date without any manual intervention.
- API Trigger: For more advanced workflows, integrate persistence with your existing orchestration tools via our upcoming API trigger feature.
In terms of persistence modes, Holistics supports both full refresh and incremental refresh (upsert), giving analysts the flexibility to optimize depending on the nature of the table’s data.
Additionally, the platform automatically cleans up stale tables, so you don’t have to worry about managing outdated data.
With Holistics, analysts have the option to full-cycle manage the pre-aggregates within the tool itself, rather than relying on external data transformation tools.
Try Out Aggregate Awareness Now!
Aggregate Awareness is in Closed Beta! Request Beta Access and give it a try.
You can also:
- Read our Public Doc or Tutorial
- Share your thoughts in our community announcement
What's happening in the BI world?
Join 30k+ people to get insights from BI practitioners around the globe. In your inbox. Every week. Learn more
No spam, ever. We respect your email privacy. Unsubscribe anytime.
