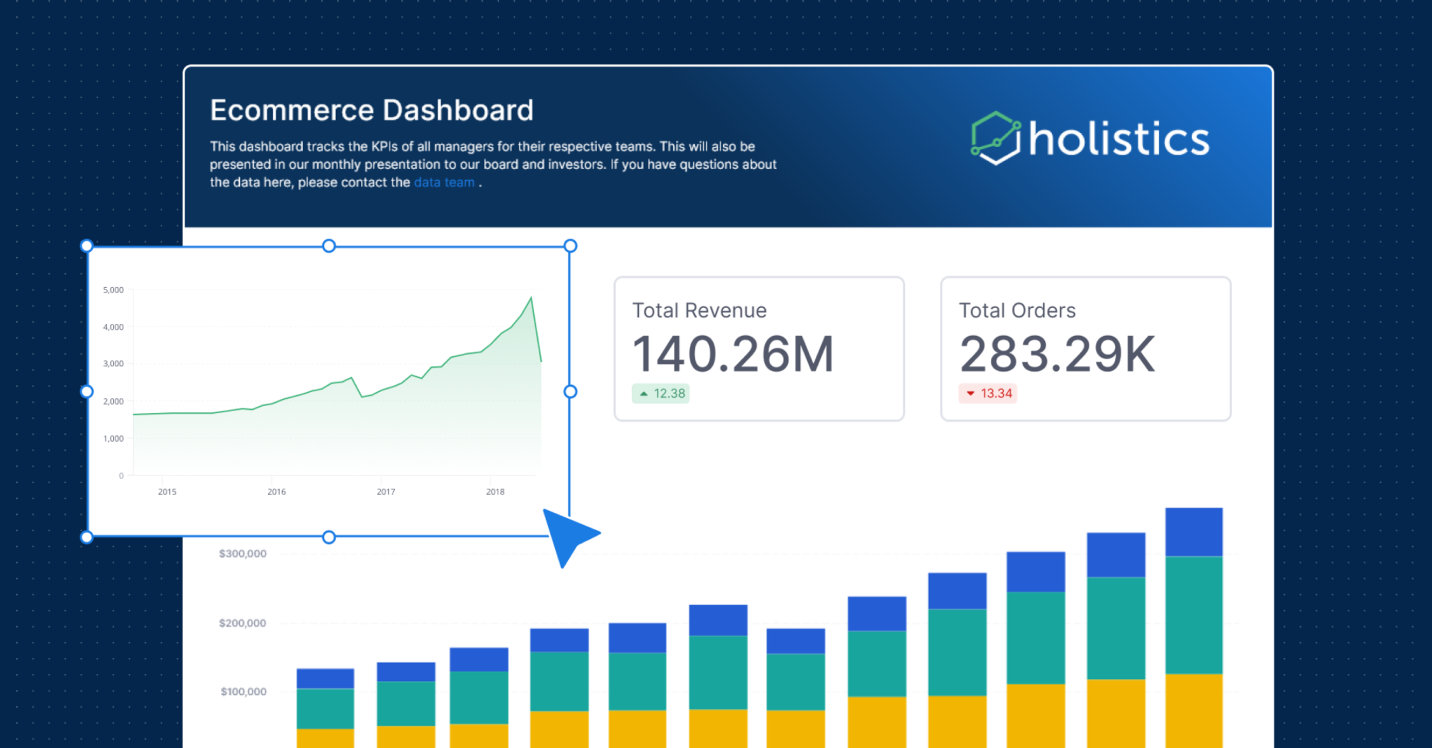
7 Best eCommerce Analytics Tools for Growing Brands
eCommerce analytics can seem straightforward at first. Platforms like Shopify, WooCommerce, or WordPress offer built-in tools to track sales, traffic, and product …

eCommerce analytics can seem straightforward at first. Platforms like Shopify, WooCommerce, or WordPress offer built-in tools to track sales, traffic, and product …

If you've been in data space long enough, you know Tableau's all about killer visualizations, and Domo' …

Turn rigid dashboards into living documents, rich with interactivity, business context, and storytelling.

Choosing the right open source data modeling tool is difficult, mainly because Google Search gives you a bunch of regurgitated pabulum. And …

Holistics.io the self-service BI platform, announced that it has achieved Select Tier partner status as part of the Snowflake Partner Network

If you want a BI tool that is architecturally similar to Looker, but more affordable and well-integrated with dbt, go for Lightdash. …

As data analysts, we often do lots of work — writing SQL, modeling data, drawing charts, and building data presentations. We spent hours …

Having data alone does not make it valuable, but utilizing it does. You're a mid-sized startup, you're growing. …

When you hear DataOps, the first thing that comes to mind is most likely DevOps for data analytics. And while that is …