Quick Guide: Calculate Cohort Retention Analysis with SQL
Contents
Cohort Retention Analysis is a powerful thing that most business owners need to look at. In this post, I'm going to give you a step-by-step walk-through on how to build such an analysis using simple SQL!
Define Retention: If first-time user A goes to the store on Week 1, and returns to the store the next week, he is a returned user. If user B also goes to the store on Week 1 and does not return the next week, he's a bounced user, that basically means you lose him as a user (despite all the marketing money you spent to lure him to your store).
Cohort Analysis is a technique to see how variables change in different groups given different starting conditions (a cohort).
Our Cohort Requirements
In this post, we'll show you how to build the below Cohort Retention Analysis:

The above chart tells you a few things:
- We cohort users by their signup month. This is the
userstable below - For each cohort, we show the population (how many people) in that cohort in the second column
- An activity is an action user did to the site (this could be simply view the page, or as specific as making a purchase). We denote this as table
activitiesbelow.
We need the following tables and fields:
users:
- id
- timestamp

activities:
- user_id
- timestamp
Bucketing Users Into Cohort
First we bucket them into different cohort by their sign up month, and store into cohort_items
-- (user_id, cohort_month), each
with cohort_items as (
  select
    date_trunc('month', U.timestamp)::date as cohort_month,
    id as user_id
  from users U
  order by 1, 2
)
After that, we build user_activities which
-- (user_id, month_number): user X has activity in month number X
WITH user_activities as (
  select
    A.user_id,
    MONTH_DIFF(
      date_trunc('month', A.timestamp)::date,
      C.cohort_month
    ) as month_number
  from public.activities A
  left join cohort_items C ON A.user_id = C.user_id
  group by 1, 2
)
The above would return all the pairs of (user_id, month_number) that indicates if a user is active in that month after their original signup date.
| user | month_number |
| Alex | 0            |
| Alex | 1            |
| Bob  | 0            |
| Bob  | 2            |
The MONTH_DIFF is a user-defined function that takes in 2 dates, and return the number of months between them.
Cohort Size: is simply how many users are in each group
-- (cohort_month, size)
with cohort_size as (
  select cohort_month, count(1) as num_users
  from cohort_items
  group by 1
  order by 1
),
And finally, putting them together with the below:
-- (cohort_month, month_number, cnt)
with retention_table as (
  select
    C.cohort_month,
    A.month_number,
    count(1) as num_users
  from user_activities A
  left join cohort_items C ON A.user_id = C.user_id
  group by 1, 2
)
-- our final value: (cohort_month, size, month_number, percentage)
select
  B.cohort_month,
  S.num_users as total_users,
  B.month_number,
  B.num_users::float * 100 / S.num_users as percentage
from retention_table B
left join cohort_size S ON B.cohort_month = S.cohort_month
where B.cohort_month IS NOT NULL
order by 1, 3
And you would get:

With Holistics, we can automatically turn them into beautiful cohort table like so:

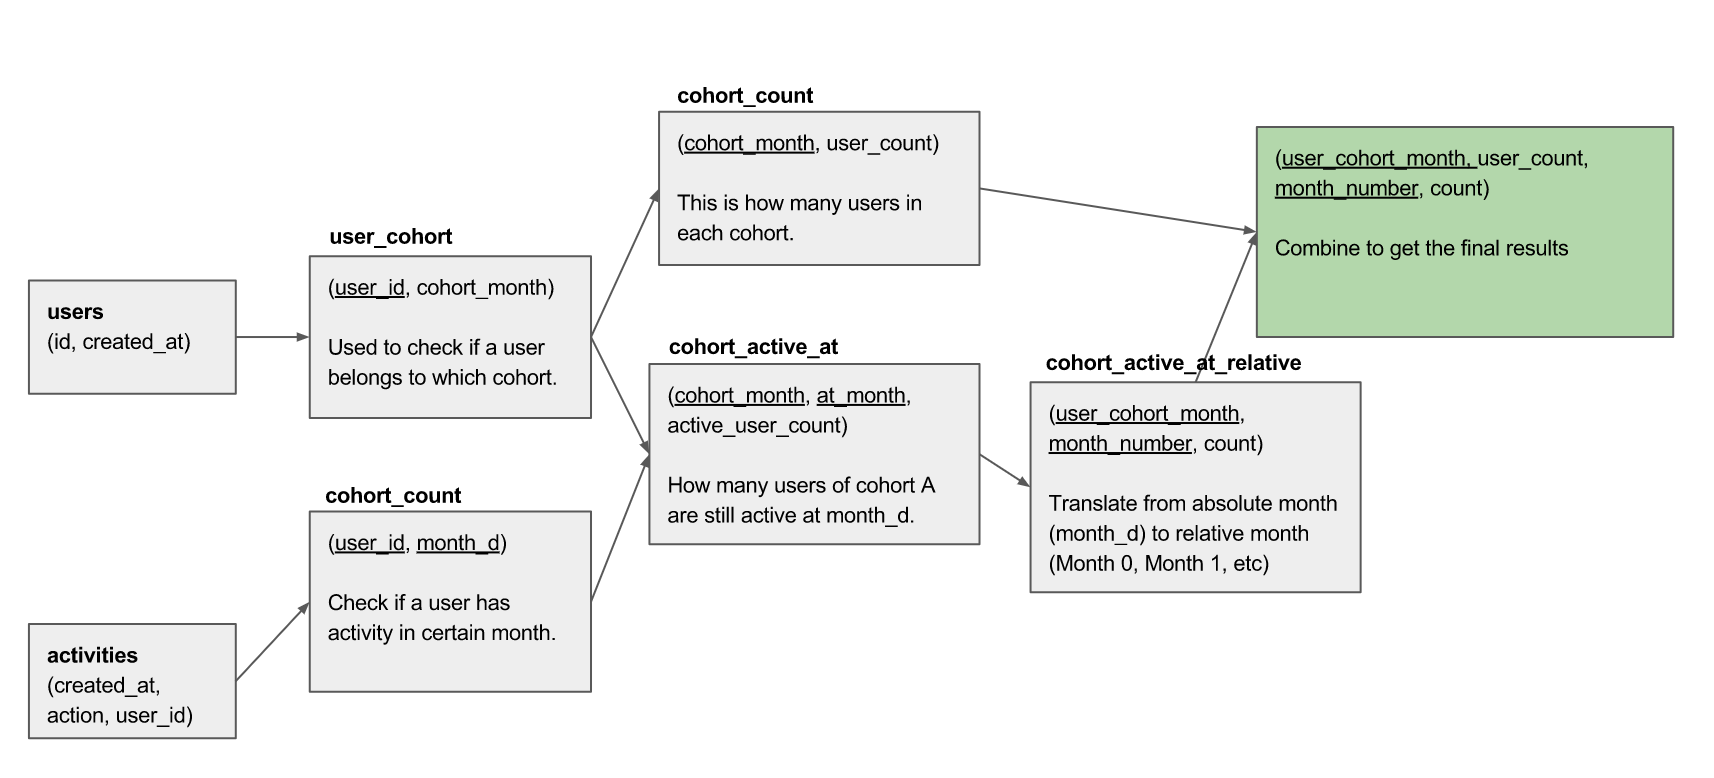
Visualizing SQL Diagram
If we take the full SQL below and visualize the tables and relationship out, this is what you get.
The Full SQL
Here's the full SQL for your reference. Note: you just need to change the table names and column names inside the first 2 WITH clauses, and the rest should work as per normal. View the full SQL
Is this what you need?
We're SQL lovers, so share your feedback in the comments below, and let us know if this is what you're looking for!
— — — — — — — — — — — —
If you need an awesome SQL editor that can quickly run and visualize your queries and share with colleagues, try Holistics BI.
What's happening in the BI world?
Join 30k+ people to get insights from BI practitioners around the globe. In your inbox. Every week. Learn more
No spam, ever. We respect your email privacy. Unsubscribe anytime.


