Quick Guide: Converting Rows to Columns — Pivoting with SQL & BI Tools
A common requirement in data reporting is converting data present in row-form to a dataset that is organized in a columnar format. This happens when the operational database captures events, transactions, or other data points across many rows. For instance, a log of website traffic would capture a user’s unique ID (eg. login credentials) and track that against different pages visited during the session. However, a customer-level analysis would require the summary of all the visits categorized along different dimensions — such as Product Page Type, Purchases, Wishlists, Deal Pages etc. Thus, for reporting purposes, the rows need to be classified and “summarized” to an individual identifier level.
Case Description
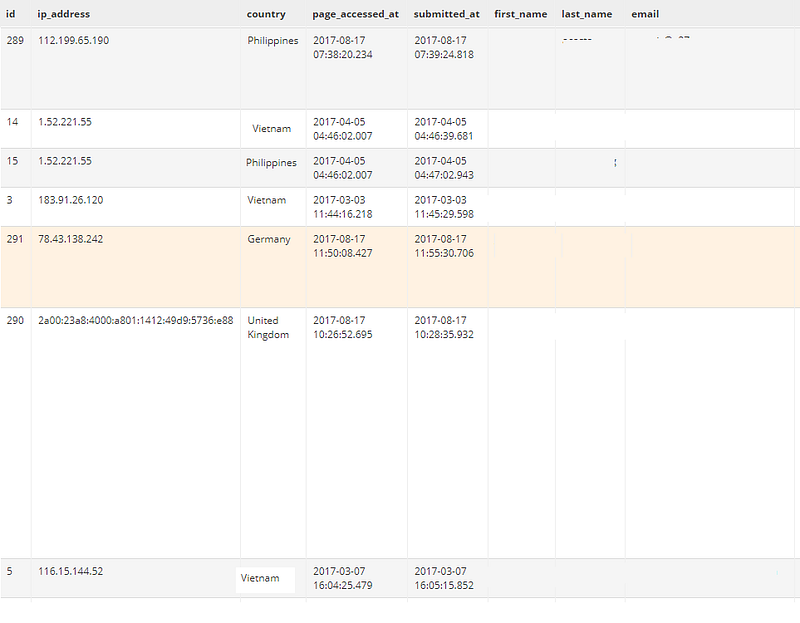
Let’s handle a case in which I track the number of visits to a blog site, and the analysis will be along two dimensions:
- Country from which the reader accessed
- Month of Visit
The dataset collected by the operational system is as per the screenshot below:
Solution Approaches
There are two solutions we will explore: a SQL snippet that will extract the data in the desired format, and a Holistics’ Visualization to render the data in a PivotTable format.
How to pivot your dataset with SQL
The general form of a SQL solution is of-the following format:
Aggregate_Function(CASE WHEN COLUMN_TO_PIVOT = {VALUES} THEN COLUMN_TO_MEASURE ELSE 0/NULL END)
Specifically, in our context:
MAX(CASE WHEN MONTH(submitted_at) = '1' THEN VISIT_COUNT ELSE 0 END) AS Visits_January,
...
MAX(CASE WHEN MONTH(submitted_at) = '5' THEN VISIT_COUNT ELSE 0 END) AS Visits_May,
How does this work? The CASE statement essentially assigns either the “value” (a column value for amounts, 1 for counts etc.) or a 0 to every row, and the aggregate function (COUNT, SUM) ensure that the information is summarized uniquely for the identifier.
This solution is applicable in any table or data set, and is even commonly used in ETL jobs to populate data warehouse tables.
However, it is difficult to understand or process if you are not too comfortable with SQL. That takes us to our second solution:
PivotTable Visualization in a BI Tool
Many BI and Visualization tools, such as Holistics, provides an option to render visualization from the results of a query, and lets a user drag-and-drop the columns that go into rows and columns. This feature makes it extremely simple to convert row-based data into a two-dimensional analytical table. The dataset represented above, when rendered using Holistics, looks like this:
The SQL used to generate the above was a simple SELECT SQL (2 lines) without any custom processing..
When to use which approach?
There are certain contexts in which the more technically complex SQL solution may be more applicable:
- The number of categories in the column that needs to be the second dimension are a lot, making the report potentially “wide”. In such a case, the SQL snippet lets you group multiple values under a broader bucket.
- Combining** multiple measures** when converting from rows to columns. For instance, if there is order level data, and one wants to summarize both the amount and count the number of orders across the second dimension, the SQL approach will help aggregate multiple measures. PivotTables provided by BI Tools may not support this.
- Subsequent processing: If one is doing an analysis, such as comparison over a 3 or 6 month period, then using the SQL to convert data to columns will make comparisons easier and scalable. In the example above, irrespective of the month
during which the query is run, the columns accurately represent the value for each month. Thus, the pivot from the SQL can be used in a temporary table or a CTE in another query.
For all other reporting use cases or analysis, the Holistics Pivot Table simplifies the experience to just a few clicks.
— — — — — — — — — — — —
Having problems finding a simple and affordable data reporting system for your startups? Check us out at holistics.io.
What's happening in the BI world?
Join 30k+ people to get insights from BI practitioners around the globe. In your inbox. Every week. Learn more
No spam, ever. We respect your email privacy. Unsubscribe anytime.


