Effortless Materialized Views for Tableau with Holistics
Tableau may be the best data visualizer on the planet today, but Holistics makes Tableau more awesome, by making data prep trivially easy.

Contents
Tableau is an industry-leading provider of business intelligence software. It allows data analysts to present business users with amazing visualizations.
Unfortunately, most of your production data is stored in a normalized form ... which isn't ideal for Tableau. To use Tableau properly, you will need to convert your normalized data into aggregated or summarized tables, suitable for analysis. This means that you have two choices:
- Connect Tableau to a materialized view in your analytical database through a live connection. This requires some back-and-forth with a database administrator who can help set up the desired materialized views for your report data sources outside Tableau. And you need to go through this process again when your existing materialized views do not support your requirements in the future!
- Second, you can create an automated Tableau extract. A Tableau extract stores aggregated data in-memory in a proprietary file format for better performance when analyzing large volumes of data. Tableau extracts have limited flexibility compared to SQL (which Tableau generally discourages the use of) unless you hire skilled Tableau data engineers. In addition, Tableau extracts are not easily accessible to other data tools relative to database materialized views.
The end result is that you'll have to hire new technical team members and train them in order to run your Tableau visualizations.
This lengthens the time needed to answer new questions. We've seen this pattern again and again: over time, the technical members of a data team gets inundated with requests for new campaign data, new dashboards, and new tabular representations for new initiatives across your organization. If it takes you a full week to extract and transform the data you need to answer a business question, you're not likely to ask that question in the first place.
Impact: You're Probably Not Using The Full Power of Tableau
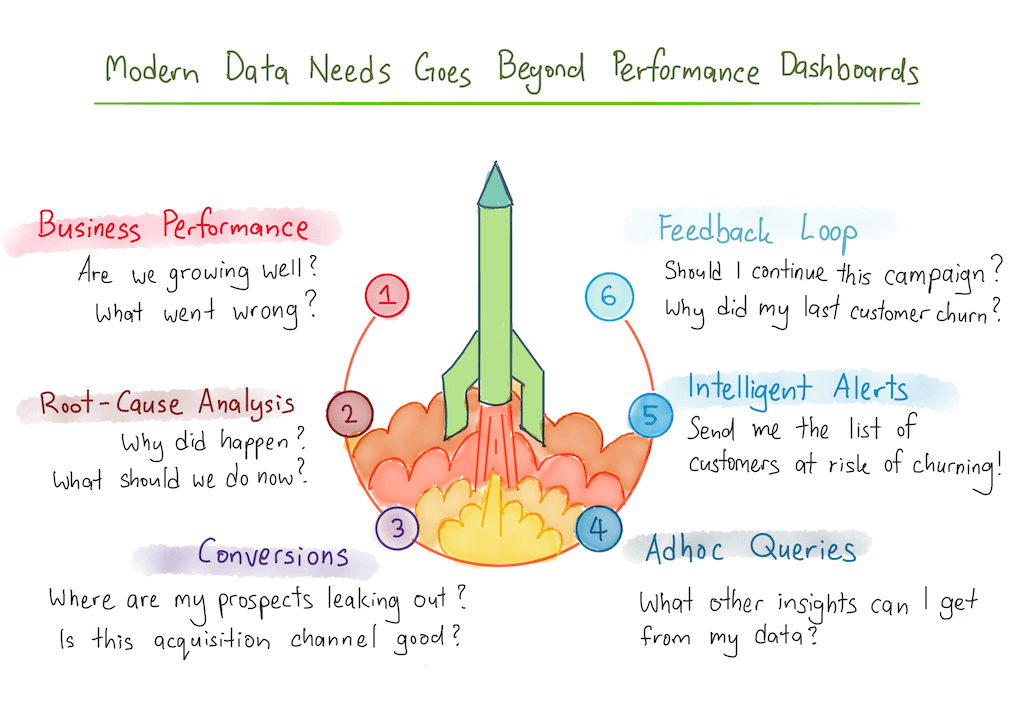
In practice, companies without adequate data team resources end up using Tableau to track high-level key performance indicators (KPIs).
Most companies do this by creating reporting dashboards to track spikes and dips in their results. But such KPI reporting is static — it tracks activities that are unlikely to change within your organization. It is the bare minimum of what you can do with your data.

Think about the new product lines, new marketing campaigns, new product experiments and new features that your business teams are building within your company. They need data-driven insights too — but if they lack training in databases or Tableau data prep administration, it's unlikely that they'll get the insights they need.
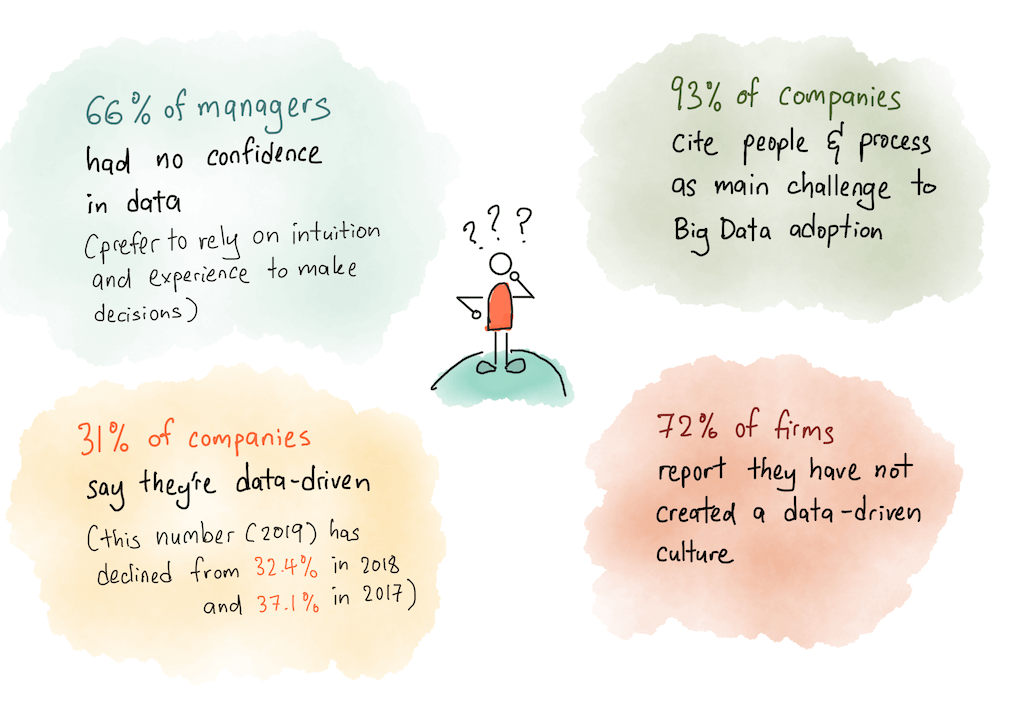
This gap between data capability and operational demand causes employees to lose confidence in working with data. You won't reach for data if it takes too long to get the data you need ... and you don't trust what you can only use rarely.
Is it any surprise, then, that a NewVantage survey conducted this year found that more companies in 2019 felt they were less data-driven compared to the same survey conducted in 2017?
Tableau may be the best data visualization tool on the market — but if you can't get your company's data into Tableau at speed, you won't be able to benefit from data-driven insights.

Holistics makes it effortless to create datasets for Tableau
Holistics is designed to be a drop-in solution for all your Tableau data-prep needs.
Instead of relying on database-specific administration knowledge, or familiarity with Tableau's proprietary data prep platform, Holistics only requires SQL knowledge to use. This empowers your existing data analysts, freeing you from hiring ever more numbers of database administrators or data engineers. It also means that SQL-savvy business users and software engineers alike are able to perform their own transformations for use with Tableau.
Holistics works by connecting to your data warehouse. It then transfers all the data you desire from your various transactional data sources. Holistics comes with built-in connectors for Google Analytics, Facebook Ads, Google Adwords, MongoDB and more.
Once Holistics transports your data to your data warehouse, all further transformations to your data are performed within Holistics itself.
This all-in-one property enables a number of neat, productivity-increasing behaviours:
- Data analysts are able to put together materialized views in minutes within Holistics, for consumption by Tableau.
- Those 'materialized views' can be reused by non-technical users, Tableau Data Explorers, and even your other data tools to answer ad-hoc questions about the data. Holistics comes with a true self-serve, drag-and-drop interface for business users. Anybody who can use pivot tables can use Holistics with ease.
- Meanwhile, data analysts and Tableau Creators can tag their data with metadata, and track the lineage of the dataset they're working with. If the numbers don't look right, they won't have to trace the transformations of that data across three different tools — they can simply check within Holistics itself.
- Finally, because Holistics uses SQL at every level of the stack, your data team can hit the ground running. No proprietary languages, no complicated stacks.
Tableau may be the best data visualizer on the planet right now, but Holistics makes it easier for you to build materialized views for Tableau live connections. Learn more about us, or talk to us for a demo today!

What's happening in the BI world?
Join 30k+ people to get insights from BI practitioners around the globe. In your inbox. Every week. Learn more
No spam, ever. We respect your email privacy. Unsubscribe anytime.

