Enterprise Business Intelligence: A Pocket Guide
We talked to Chief Data Officers (CDOs) at enterprise organizations, many of whom are Holistics customers. Here’s what we learned about Enterprise BI.


You might been here before.
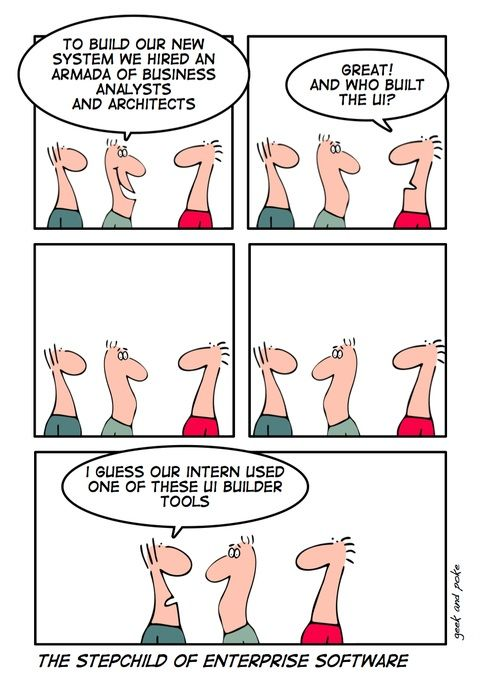
You sit in the third emergency meeting this month. As the data team lead, you watch your analysts scramble to explain conflicting numbers from different dashboards. The VP of Sales wants to know why her forecast differs from what Marketing sees. Finance has a third set of numbers. No one trusts the data anymore.
This is a symptom of the failed state of BI.
What is Enterprise Business Intelligence?
Enterprise Business Intelligence (BI) is meant to prevent exactly the above scenario.
At its core, enterprise BI is a system of technologies (tools), processes, and organizational structures (people) that enables large organizations to transform raw data into actionable insights for strategic decision-making at scale.
But the reality often looks different from the promise.
The biggest challenge for enterprise organizations implementing BI is avoiding what I call the "failed state" of business intelligence. The failed state reveals itself through specific symptoms: business teams complaining about delays in getting answers, data analysts feeling burned out from reactive work, and executives questioning the return on their analytics investments. The organization finds itself in a vicious cycle where more data generates more questions, requiring more analysts, who create more reports, which spawn more questions.
It's a failed state because it's extraordinarily painful and costly to maintain an army of English-to-SQL translators. Each request becomes a bottleneck. Each dashboard becomes another maintenance burden. Each analyst becomes a potential single point of failure.
This is why I often (jokingly) said, that Enterprise BI is not simply "Bigger BI".
What separates true enterprise business intelligence from merely "bigger BI" is its ability to balance competing priorities: centralized governance versus business unit autonomy, standardization versus flexibility, and self-service access versus data quality control.
But that's not all.
What also separates true enterprise business intelligence from merely "bigger BI" is better leverage: fewer data professionals serving exponentially more data consumers. This leverage only comes through a thoughtfully designed system where business users can meaningfully answer their own questions without being blocked by technical constraints or data quality issues. Enterprise organizations that escape the failed state don't necessarily have better tools or more talented teams.
What they have is a different mental model. They view self-service not as a feature to be purchased but as an outcome to be achieved through the right combination of tools, processes, and organizational structures. (but more on that later).
How to Evaluate Enterprise Business Intelligence Solutions
Most BI vendors do the same thing and tick all the same boxes. Each demo looked impressive. Each sales team promised the world, but beneath the slick interfaces lie fundamentally different architectures and design philosophies that will either enable or cripple his data strategy for years.
Evaluating any enterprise business intelligence solution requires looking past features to identify what truly matters, whether it's end-user interactivity, ease of self-service programmability, maintainability, or reusability.
1. Scalable Cost Structure
Your data team, whether you want it or not, might be perceived as a cost center, no matter how large the budget is allocated to you.
You want to enable broad self-service adoption without breaking the bank. A flexible or transparent pricing model allows you to scale as more users or data volumes come on board. This reduces friction for large teams and lowers the barrier to entry for business users.
2. Single Source of Truth
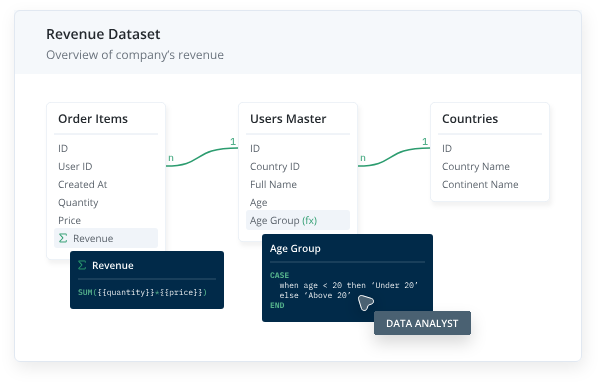
Without a strong semantic layer, teams end up with repetitive queries, inconsistent definitions, and an endless queue of “simple changes.” A robust semantic model ensures one source of truth, so your enterprise BI environment doesn’t collapse under the weight of ad-hoc dashboards.
Look for:
- Semantic Modeling Layer: Central, reusable definitions for metrics/dimensions.
- Version Control: Git-based or similar workflows so changes are tracked, tested, and rolled back if needed.
3. Depth of End-User Interactivity
The promise of an enterprise BI platform is to let business users answer questions without constantly pinging the data team. Evaluate tools based on:
- Interactive visualizations with cross-filtering capabilities
- Automated drill-through explorations that anticipate common questions
- AI-assisted search or natural language querying
- Clear metadata enrichment within the exploration interface
4. Self-Service Data Exploration
Business users need autonomy without sacrificing governance. When considering enterprise BI software, look for:
- Report Builder: Intuitive report creation interfaces with minimal technical requirements.
- Native support for common calculations: How easy it is to calculate time comparisons, running totals, and trend analysis without writing code.
- Ad-hoc calculation capabilities without developer support
- Customization: Customization options for visualizations, branding, and layout.
5. Data Delivery
Having an enterprise BI platform isn't really valuable if insights don't reach decision-makers. Look for:
- Delivery Options: Email, Slack/Teams, Google Sheets, Webhooks, CRM/ERP integrations
- Export Formats: Export to PDF, PNG, Excel, CSV, PPT.
- Alerts & Scheduling: Automated email/Slack/Teams notifications of new or updated dashboards. Threshold-based data alerts (e.g., “trigger alert if sales drop below X”).
- Shareable Links: Password-protected URLs, external sharing without requiring a login.
- Embedded analytics: Ability to embed dashboards in portals or external apps.
6. Programmability and Analyst Productivity
Over time, ad-hoc dashboard creation and self-service without governance can lead to what I often call “BI entropy" Having code-based workflows, reusability, and analytics-as-code keeps your BI environment organized, version-controlled, and scalable, reducing developer burnout.
This criterion separates sustainable enterprise solutions from temporary fixes:
- Analytics as Code: Define data models, metrics, and dashboards as code. Perform branching, automated review, and CI/CD.
- Reusable BI Definitions: Shared datasets, metrics, and widget templates to avoid reinventing the wheel across multiple dashboards.
- Metric Composability: Ability to define or reuse higher-level metrics (e.g., aggregated by region or product line) without duplicating logic.
provides
7. Performance at Scale
Slow queries or dashboards can quickly kill adoption. For large datasets or high concurrency, efficient caching and query performance are essential to maintain a good user experience. Look into:
- Caching mechanisms: How the tool handles caching. Common caching mechanisms are:
- In-memory caching: Storing data in RAM for fast access. Offers speed at the cost of memory usage and data freshness management.
- Materialized Views: Precomputing and storing query results as tables in the database, which shift computation to a pre-processing phase, giving fast reads at the cost of storage and refresh complexity, and are best for relatively static, heavy queries.
- Query caching: Saving previous query outputs to avoid redundant computation. This boosts performance for repeated workloads but requires query repeatability and cache invalidation strategies.
- Pre-aggregations: Pre-aggregating data across dimensions for rapid multi-dimensional analysis. This provides an interactive fast analytic experience for defined data models, trading off flexibility and requiring significant upfront investment in design and processing.
- Performance Analytics: Tools to measure query response times at the dashboard or widget level.
- Query control options for managing resource-intensive operations.
- Data warehouse cost management features.
8. Governance and Access Control
A self-service analytics environment can quickly become chaotic without fine-grained controls. Proper governance ensures data security, compliance, and consistent trust in metrics. Look for:
- Access Control: Row-level security, role-based access, object-level controls, etc.
- Usage Monitoring & Analytics: Track who viewed/modified data or dashboards; helps identify unusual activity and measure adoption.
- Single Sign-On & Authentication
- Compliance & Certifications: Any relevant requirements (GDPR, HIPAA, etc.) for industries with strict data-handling rules.
The Best Enterprise BI Solutions and Platforms
Enterprise BI solutions exist on a spectrum, each with distinct strengths. Here's my assessment of today's enterprise BI tools that meet most, if not all of the above criteria.
Tableau
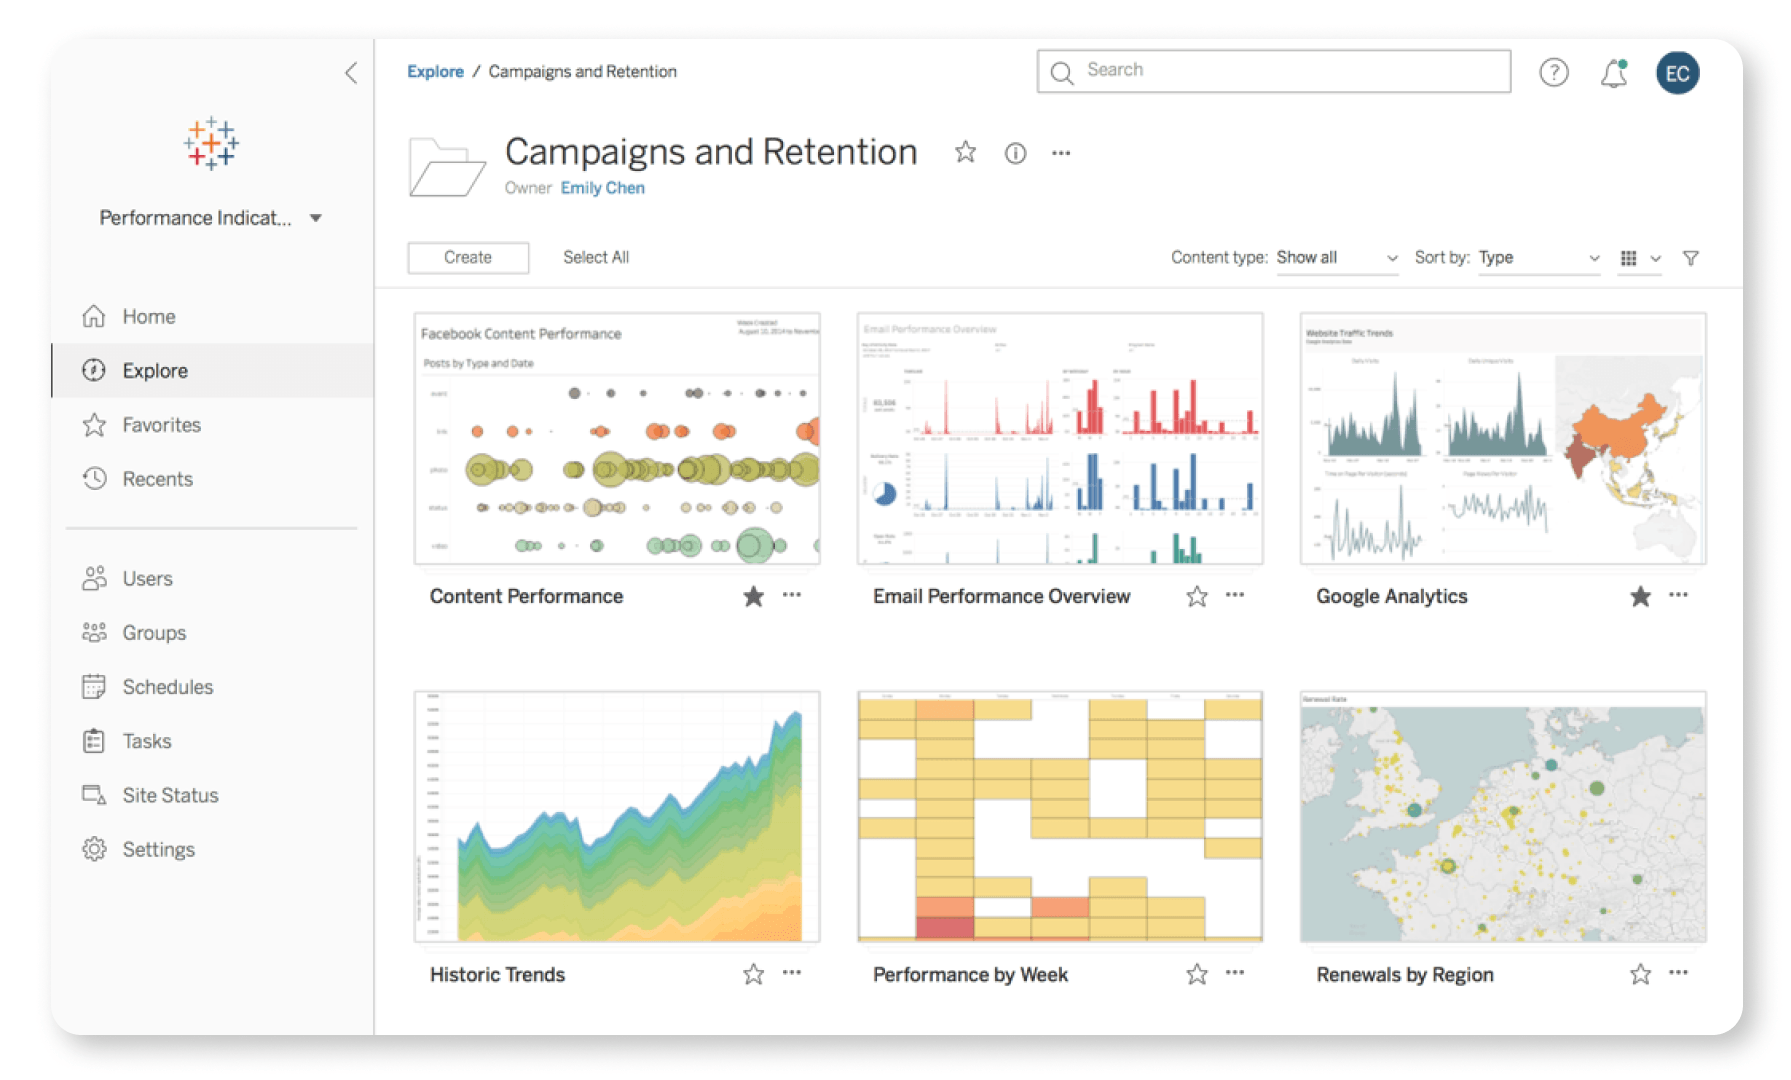
Strengths: Still the gold standard for interactive visualizations and data exploration. Tableau pioneered visual analytics that business users could actually understand. Its strong community and extensive training resources accelerate adoption.
Limitations: The semantic layer isn't as robust as some competitors. Without code-based governance, large enterprise deployments might struggle with governance and consistency across departments. The depth of self-service interactivity and analytical functions might be limited compared to other players.
Best for: Organizations where visual data exploration and storytelling are paramount, especially when technical users will manage the data preparation.
Holistics
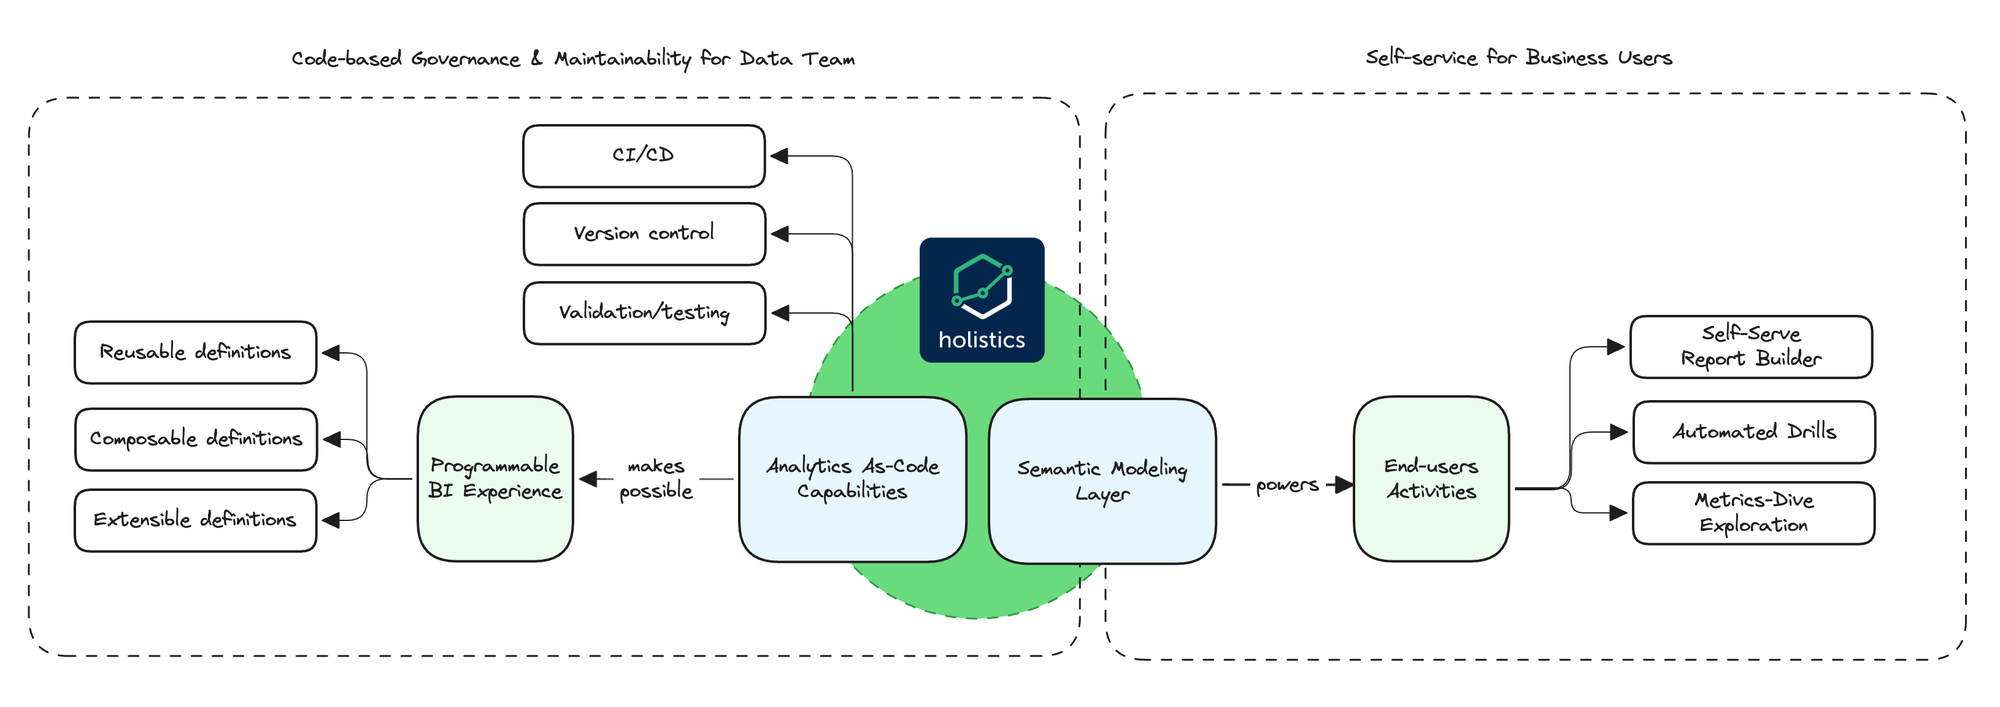
Strengths: This emerging contender brings a developer-first approach to enterprise BI through its code-based semantic modeling layer and flexible self-service BI capabilities. This code-first philosophy treats BI as a data engineering problem – complete with governance, testing, and templating capabilities that prevent metrics inconsistency and scalability over time.
Holistics enables these teams to define data models, metrics, and chart components programmatically while governing changes through Git version control. Its canvas-based dashboard system provides refreshing flexibility, allowing analysts to heavily customize the front-end layer, making both narrative reports and Tableau-like interactive visualizations possible.
With ten years in the market as a bootstrapped, sustainable company, Holistics offers a stable alternative to venture-backed competitors that might prioritize growth over product consistency.
Limitations: While technically sophisticated, Holistics' user experience lacks the polish of larger competitors. Organizations prioritizing immediate business user adoption may find the learning curve steeper than with visualization-first tools. As a smaller player, Holistics has a more limited partner ecosystem and fewer third-party integrations than enterprise incumbents.
Best for: Data-mature organizations seeking to enable governed self-service BI through programmable analytics architecture. Particularly well-suited for scale-ups where a small data team needs to efficiently support growing business demands without constant dashboard maintenance.
Looker (Google)
Strengths: Google's enterprise analytics platform delivers highly governed analytics through a code-first semantic modeling layer based on LookML. Its growing market momentum is backed by excellent composability and strong integration with Google's data and AI ecosystem. The developer-focused approach enables headless BI integration with other platforms.
Limitations: Despite recent progress with Looker Studio integration, Google remains less aligned with emerging augmented analytics capabilities. The code-first approach makes it less suitable for business users without technical support. Automated insights remain weak compared to competitors.
Best for: Organizations with strong technical teams that prioritize governance, version control, and composability over business-user simplicity.
Domo
Strengths: Domo delivers impressive end-to-end capabilities from data collection to analytics and application creation. Its library of over 1,000 native connectors accelerates time to value. Domo excels at multi persona support, with strong data preparation for business users and an app framework for citizen developers. Its new credits-based consumption model removes user limitations.
Limitations: Domo faces competitive disadvantages against vendors embedded in major cloud and application ecosystems. Its geographic presence remains limited outside core markets. Despite recent AI investments, Domo still lags in some augmented analytics capabilities.
Best for: Organizations seeking rapid time-to-value, especially those without robust data warehouse foundations or with strong marketing analytics needs.
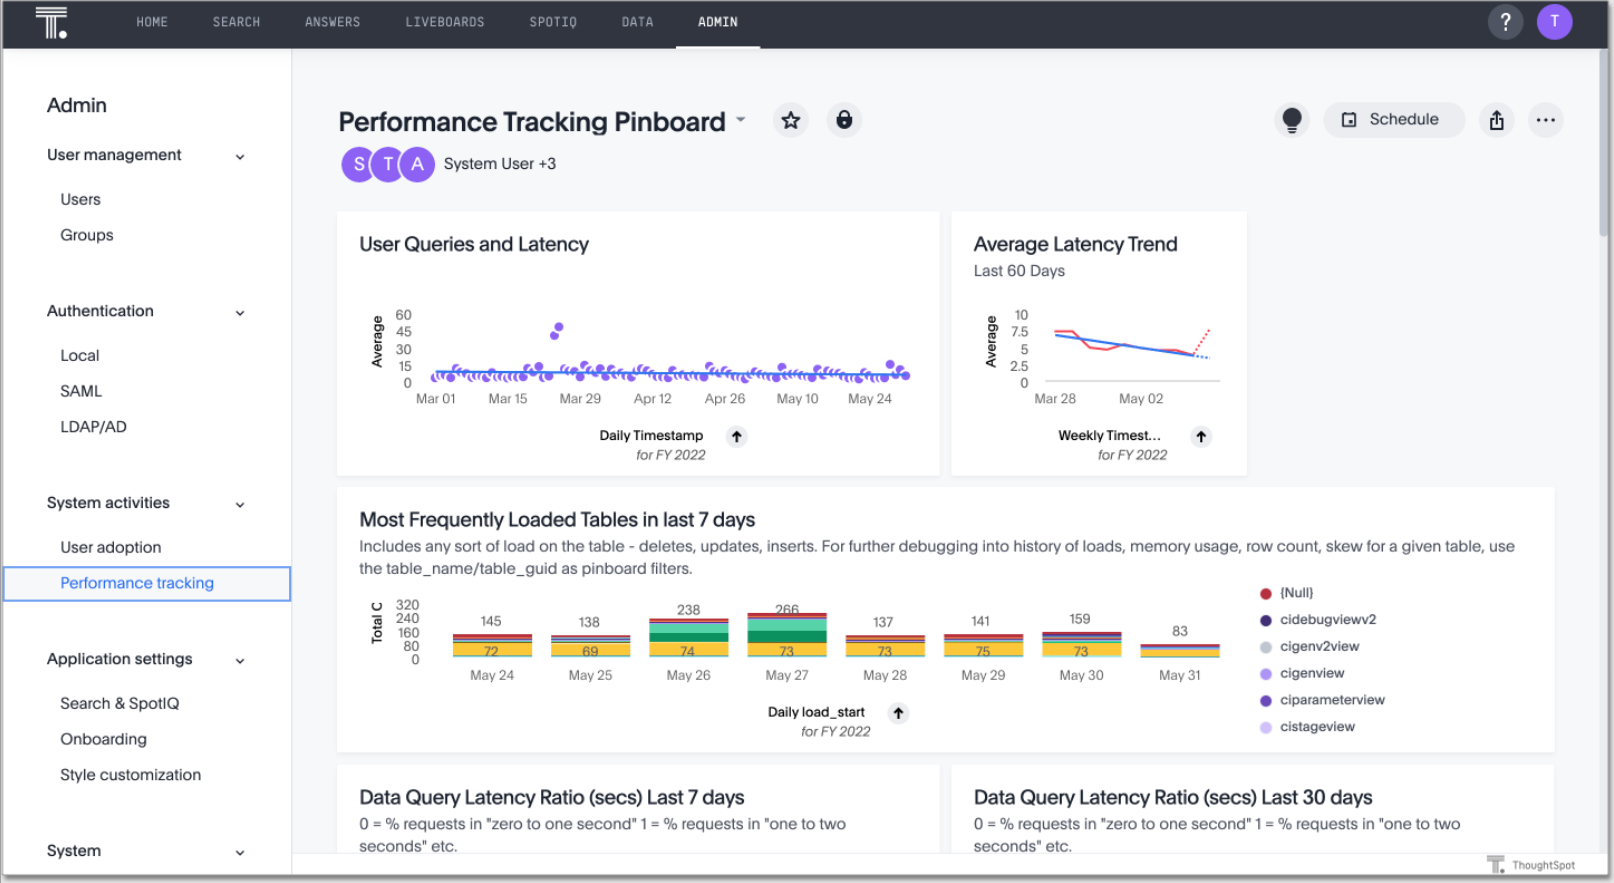
ThoughtSpot
Strengths: ThoughtSpot leads with a consumer-grade search experience for data exploration. Its visionary GenAI product strategy has revitalized its natural language capabilities through Sage, which leverages GPT-4 and Google Gemini. The platform excels at modularity for the modern data stack, with strong embedded analytics options, APIs, and cloud-agnostic deployment.
Limitations: ThoughtSpot lacks the ecosystem advantages of cloud or application-backed competitors. Despite its acquisition of Mode Analytics, integration challenges remain for data science workflows and advanced visualizations. Maintaining product differentiation will be challenging as competitors rapidly add similar AI capabilities.
Best for: Organizations focused on democratizing analytics through intuitive/natural-language interfaces, especially when analyzing large datasets and handling complex analysis requirements.
Enterprise Data Leadership : Insights from CDOs Across Organizations
Data leaders at large enterprises no longer see data as just numbers in a warehouse. They see it as an active, living force, a thermostat that signals when things are going right or veering off course.
We interviewed data leaders at Wayfair, Trade Republic, and Vimeo, and asked them about their different approaches to building teams, defining strategy, and embedding data into the DNA of their companies. Common themes emerge: how to structure and scale data teams, build a strong data culture, and navigate the evolving role of data in business.
1. Managing and Scaling Data Teams
At Wayfair, Nachiket Mehta believes in decentralization. Rather than a single, centralized data team, Wayfair’s data organization is federated, with data teams embedded within business units. His goal is to push ownership of data upstream to the teams that generate it. "Data-producing teams must own their data, not treat it as someone else’s problem," he explains. This shift reduces bottlenecks and ensures better data quality at the source.
At Trade Republic, Hannes Felsberg takes a more product-driven approach. Instead of seeing data teams as support functions, he structures them as product teams responsible for building internal tools that empower other teams. His core teams focus on data infrastructure, tooling, and governance, while analysts and engineers in product teams work directly with stakeholders. "We don’t want to build dashboards for people—we want them to build their own," he says. This approach keeps the data team small but impactful.

Meanwhile, at Vimeo, Christine Jiang has restructured the analytics organization to focus on functionality rather than business units. "When your analytics organization is sliced by verticals like marketing or sales, who builds the single source of truth?" she asks. The solution was to create a Core Analytics team that standardizes data assets and ensures consistency across the company. This shift helped avoid redundancy and conflicting metrics.
2. Building a Strong Data Culture
A company’s data strategy is only as good as its culture. Leaders at these organizations recognize that data is not just for analysts—it must be ingrained in every function of the business.
At Trade Republic, Felsberg emphasizes self-service. Engineers, PMs, and marketers are encouraged to query data and make decisions independently. "It’s much more efficient when product managers can write their own SQL queries rather than waiting for an analyst," he explains.
Wayfair also embeds data within business teams, reinforcing the idea that data is a product, not just a byproduct. To ensure governance, Mehta’s team builds internal tools such as data contracts and observability systems, treating data like a marketplace where teams can "shop" for high-quality, validated datasets.
At Vimeo, Jiang believes aligning analysts to metrics rather than business units is the key to driving accountability. "When analysts are aligned to a specific KPI, they go deeper into understanding it rather than just reporting on it," she explains.
3. The Evolution of Data and AI’s Role
The role of data teams is evolving rapidly, thanks to AI and automation. All three leaders acknowledge that the industry is shifting, making traditional data roles blur together.
Mehta foresees a future where AI accelerates data workflows but also increases complexity. "Data responsibilities will become more distributed across organizations," he predicts.
Jiang echoes this sentiment, pointing out that AI will eliminate many low-level data tasks. "A lot of people are scared that AI will take data analyst jobs away," she says, "but what it will really do is take away mind-numbing querying and allow analysts to focus on higher-value work".
Felsberg, meanwhile, sees AI as an enabler rather than a disruptor. His goal is to make analytics as automated and self-serve as possible, reducing reliance on a centralized team.
What's happening in the BI world?
Join 30k+ people to get insights from BI practitioners around the globe. In your inbox. Every week. Learn more
No spam, ever. We respect your email privacy. Unsubscribe anytime.
