Google Data Studio: Pricing, In-depth Reviews & Tutorials
Google Data Studio (GDS) is among the popular BI tools in the market developed by Google. In this post, we're going to do a high-level review and analysis of Google Data Studio, what it does, what it excels at and who or what use cases it would suit best.
Contents
A high-level review and analysis into Google Data Studio, their use cases and future.
Google Data Studio (GDS) is among the popular BI tools in the market developed by Google. In this post, we're going to do a high-level review and analysis of Google Data Studio, what it does, what it excels at and who or what use cases it would suit best.
This post serve as an additional reference for teams and companies who are looking into evaluating Google Data Studio among others as their BI tools.
TL;DR
Google Data Studio is the data visualization layer added on top of Google's data stack. It tries to aim for simplicity, and therefore it is quite limited in capabilities. Data Studio looks nice on the surface but in fact its functions are fragmented and not polished.
GDS works best if the organization already used Google's BigQuery (among other Google tools) for data warehousing and had an existing workflow for data cleaning & transformation.
There's also an assessment summary table at the end of the post that sums up well our assessment of Data Studio.
Target Users - Who is Data Studio designed for?
Based on our assessment of GDS, the tool seems to targets a set of semi-technical users, who works with numbers and know Excel very well. They might even know a bit of scripting language (Python, JS), but not technical enough to work on data infrastructure or building full reports from scratch, or building complex analysis that requires some SQL acrobatics.
These are basically what people call "business analysts". They understand business problems well, can speak the business language and a bit of the data language, and need some tool to collate and present pretty reports to clients or internal stakeholders.
Concepts: Data set, Connector & Data Source
GDS has 4 important concepts: Dataset, Connector, Data Source, Report.

Google Data Studio concepts and how they linked together
Data set is the "physical" layer underlying everything (and store the data), while Data Source is the "logical" layer with added properties and functionalities. A Connector is the "pipe" that connects these two layers.
A Data set can be much more than just a table or an Excel file. Some examples:
- Google Analytics reporting views
- Google Sheets worksheets, CSV files uploaded to Drive
- MySQL, PostgreSQL databases
- etc...
Data Source is created on top of the Data set with added functionalities:
- Shareable: while only you have access to your underlying Data set, Data Source can be shared in the same manner as any other Google resources (with Owner, Edit & View permissions...)
- Configurable: you can change the field names, aggregation type, create calculated fields, disable fields...
Connector: GDS does not import your data - it uses a connector to get access to your actual underlying data. Beside official Google connectors, there are Partner Connectors and open-source Connectors to provide access to data from other platforms like Facebook, GitHub, Twitter.
While it has a lot of connectors which makes it really easy to connect data, the community-contributed connectors are sometime not stable since they might not be maintained well.
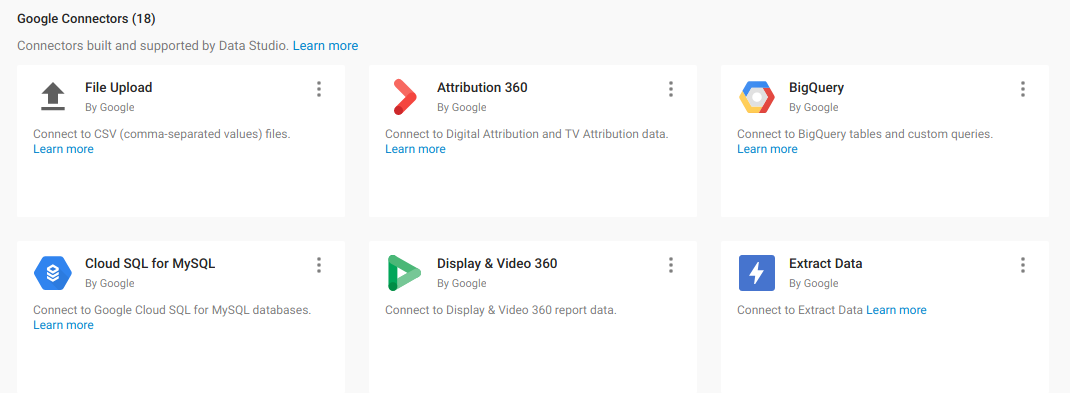
Google Data Studio supports a variety of connectors, some powered by Google, others by partners and community
Finally, a report is the final, visual presentation of data from different data sources. We'll talk more about a report at the section below.
Let us explain in a simple example where you want to analyze a sales transaction data in an Excel file that you store in GDrive.
- You starts Google Data Studio, and uses their Google Drive connector to connect to Google Drive (dataset).
- You then create 1 data source based on that particular Excel file in Google Drive. You then add custom formula (calculate gross margin based on sell price and cost), or remove unnecessary fields/data in the data source.
- After that, you create a report with multiple visualizations to present different looks of your data in the data source. You can share this report with different stakeholders. Done!
Reporting: Data Studio has a great report presentation layer
Google Data Studio centers around the concept of "report". A report in Google Data Studio has a striking resemblance to Google Drawing or Google Slides. GDS doesn't have a concept of a dashboard.
Compare this to other BI tools, where reports usually means a chart or table, and dashboard consists of multiple charts, with very fixed grid-based layout concept, we think this is among the nicest aspects of GDS.
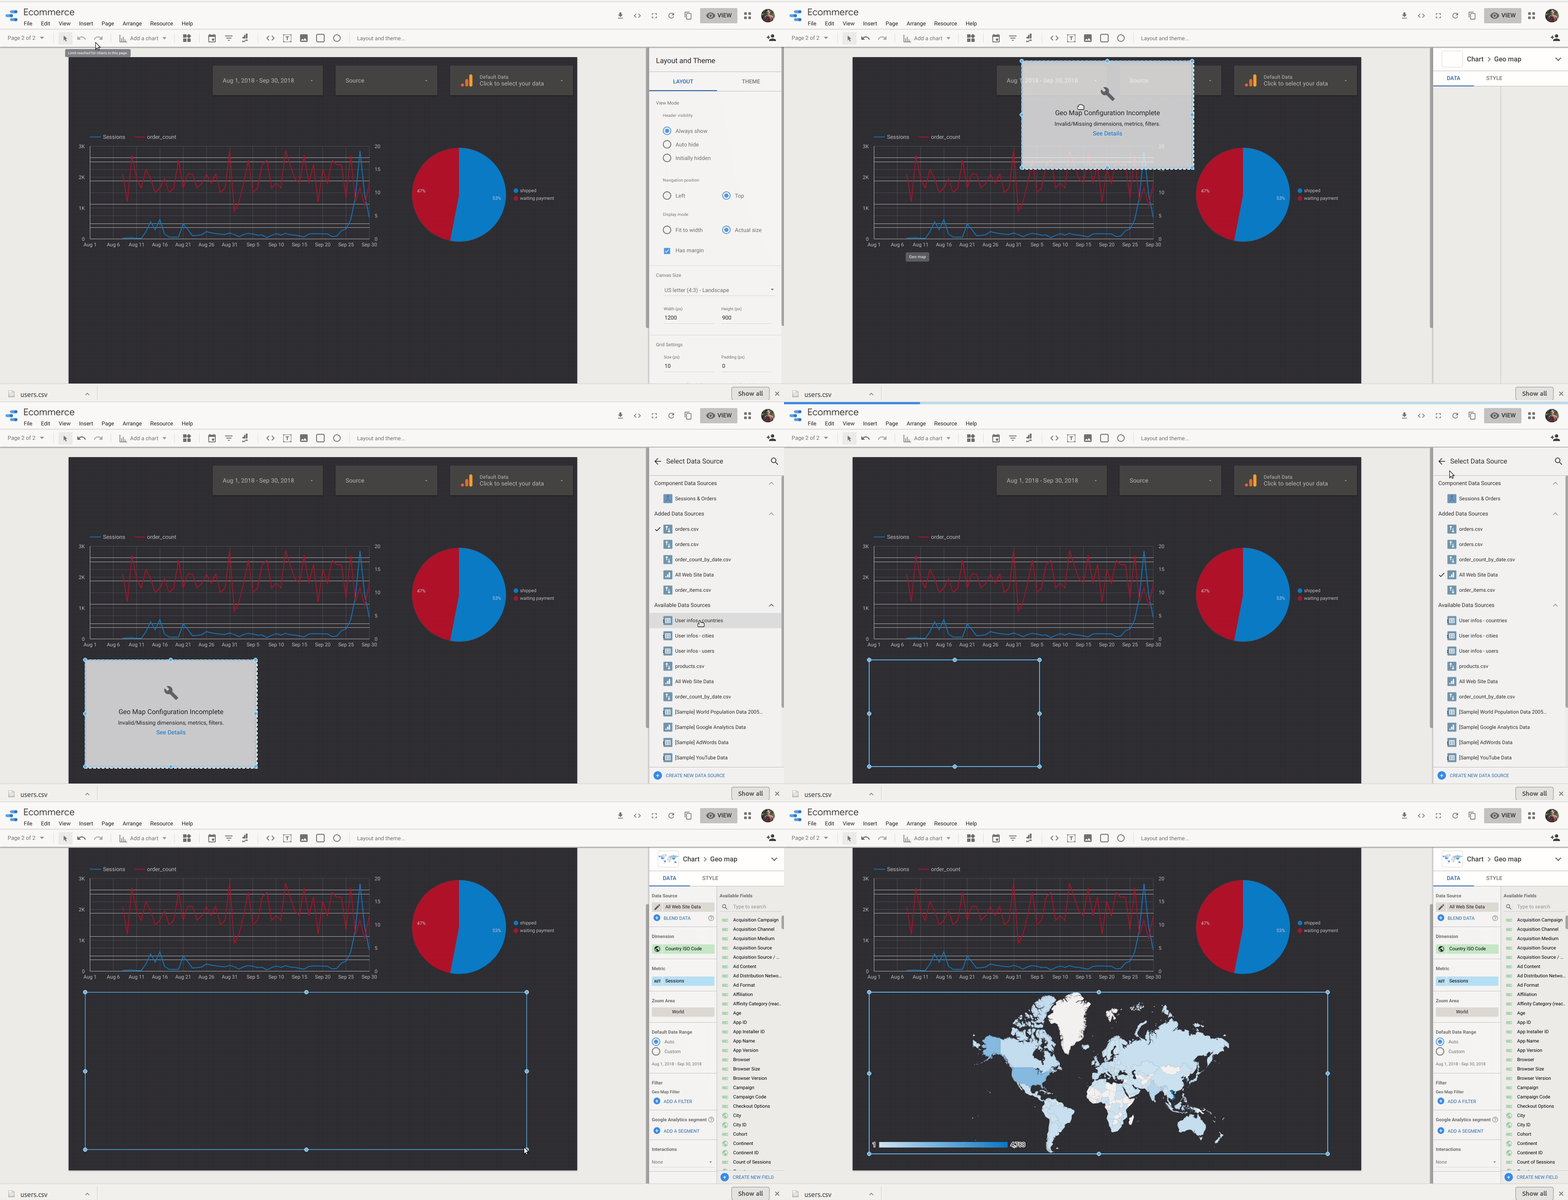
On the editing side, the tool offer a highly interactive drag & drop interface, where user can freely resize and align charts. This gives more freedom to the designer type, but can irritate the ones who only want quick, nice charts that are auto-arranged.
This approach aligns well to the semi-technical business analysts who are used to prettifying Powerpoint slides.
Filtering Data in Google Data Studio
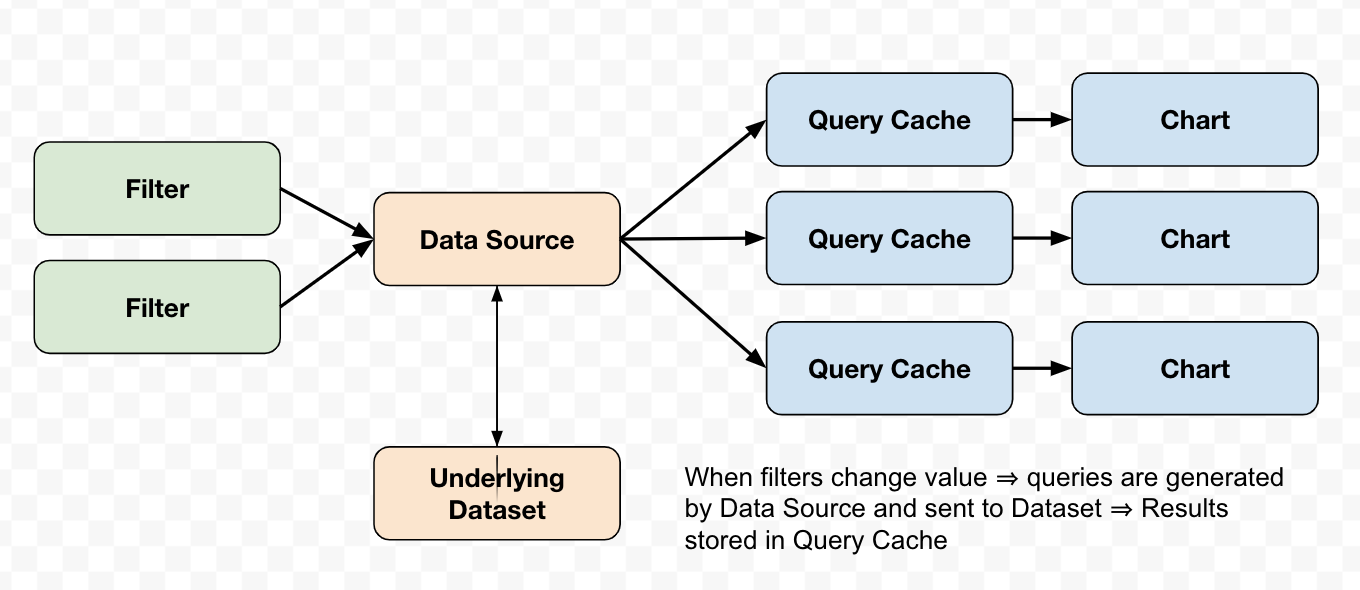
Filtering data in GDS is fragmented. There are different types of filter in GDS: Date range, Filter control, Data control, chart-specific filters.
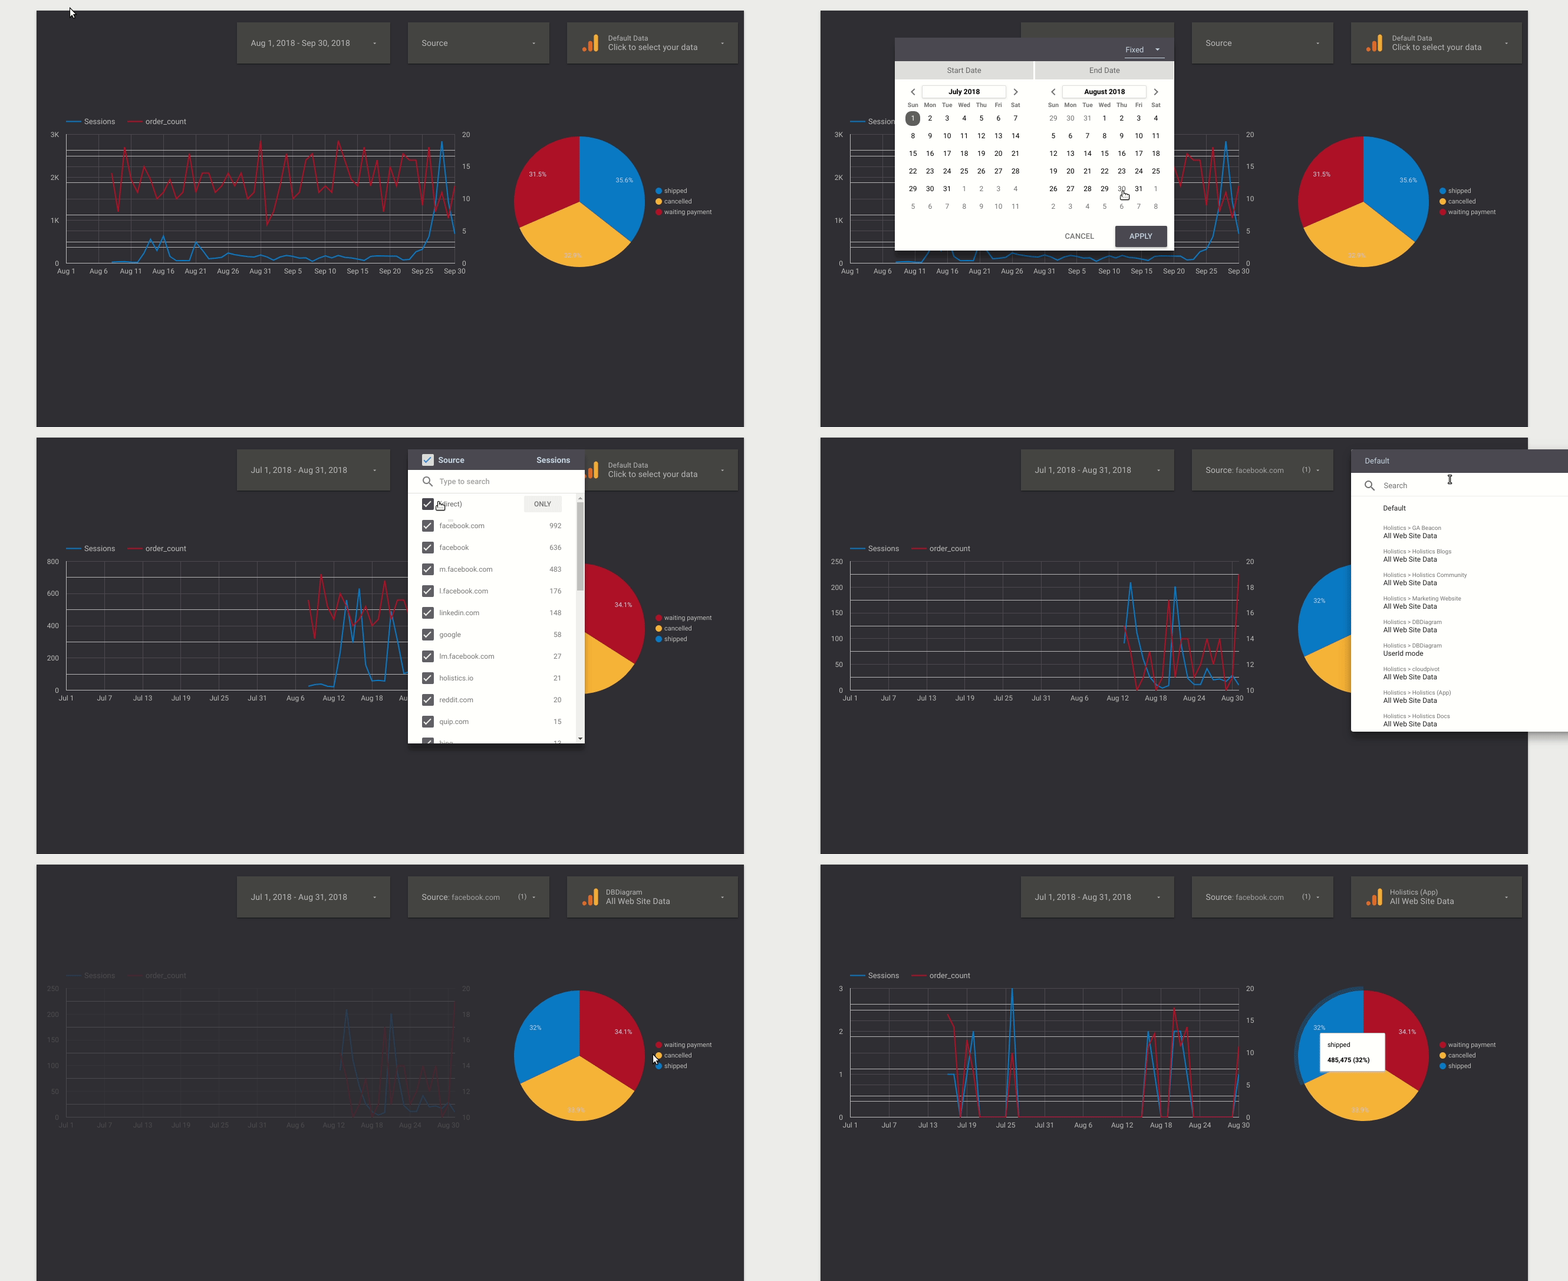
A filter is linked to a data source and takes control of a certain fields/dimensions of that data source.
When the filter value is changed, this change floats up to the data source, generating new queries that get sent to underlying data set. The results are stored as query cache, and then the charts are updated accordingly.
Interactive Drill-down
At the moment there is no drill-down functionality for GDS in both standard view and Explorer view.
How is data being updated (refreshed)?
As stated, GDS do not store your raw data, but pull directly from the source (dataset). Therefore, whenever the underlying data set is updated, any report using the Data Source created from that data set will be updated.
If your dataset isn't big, you can simply upload data directly as Excel/CSV and Data Studio will keep a copy for you (in Google Drive). If you have a lot of data, then BigQuery is the natural choice to load data into here.
To improve report performance, GDS cache data in two ways:
- Query cache: a query here means "data request". GDS remembers result of the previous query, and if the next query use the parameters (same dimensions, same metrics, same filters etc...) then the result will be displayed from cache.
- Pre-fetch cache is the next layer where GDS look for data if the new query cannot be satisfied by query cache. GDS creates it by predicting what kind of data that a component (chart, filters...) in the report can request.
Defining custom dimensions and metrics (aka data modeling)
Within a Data Source, we can add a new field and specify its type. Fields with categorical types like text, date, boolean... will be classified as Dimension, while numbers are classified as Metrics. Each Metric is tied with a default aggregation method.
Formula's syntax is a simplified version of BigQuery's standard SQL syntax. The supported functions satisfy most of the popular use cases, but they are a bit lacking in edge cases where you want a more complicated formula:

It short, it seems easy at first to get used to this functionality, but it does come with some quirks. Also currently they don't allow defining relationships (joins) across different data sources, which is very limiting as you will read below.
Exploration: GDS currently has limited self-service data exploration capabilities
GDS recently introduced Explorer feature (still in Labs/beta mode) which allows user explore a single Data Source in a simplified version of Data Studio. This probably is Google's way to address some users' need for quick & dirty data exploration interface.
However, we think that given a limited data abstraction layer (with no relationships between Data Source), there will be limitation to how much this functionality can developed, unless the underlying modeling layer is complex enough.
Combining Data in GDS (Data Blending)
Combining data from multiple sources is one of the most important features of a BI tool. Below we review how GDS helps you do this.
GDS introduced the Data blending functionality which allows users to combine different data Sources into a single one. It is similar yet different to a SQL JOIN. As Google defined, it is a LEFT JOIN and GDS allows up to 5 sources to be blended in a single operation.
In our opinion, this functionality is under-developed and only useful for a small number of specific use cases.
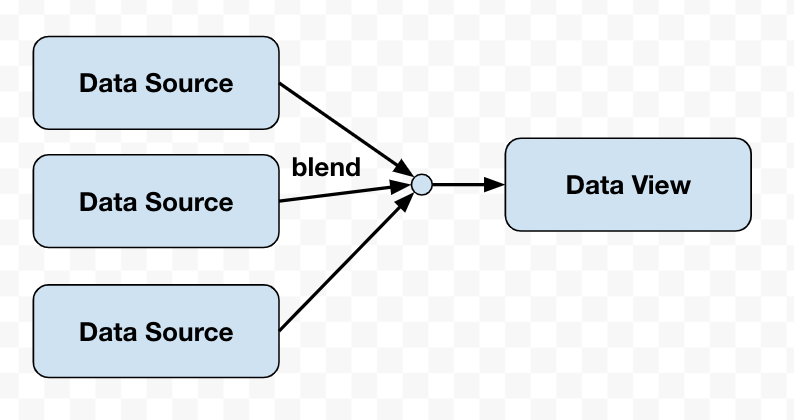
Let's look at the following different join scenarios:
- Blending 2 Data Sources
- Blending 3 or more Data Sources with same join keys
- Blending 3 or more Data Sources with different join keys
Below we describe more details on the different cases on the conceptual level.
Blending 2 Data Sources (similar to VLOOKUP)
You want to get a list of users, together with the city name (join to table cities)

This simple operation works well in GDS, and it behaves like a normal SQL JOIN on one key.
Blending 3 or more Data Sources with SAME join keys
Assume you've extracted and aggregated 3 data points (pageviews, signups and orders), and you want to combine them together into a single result table.
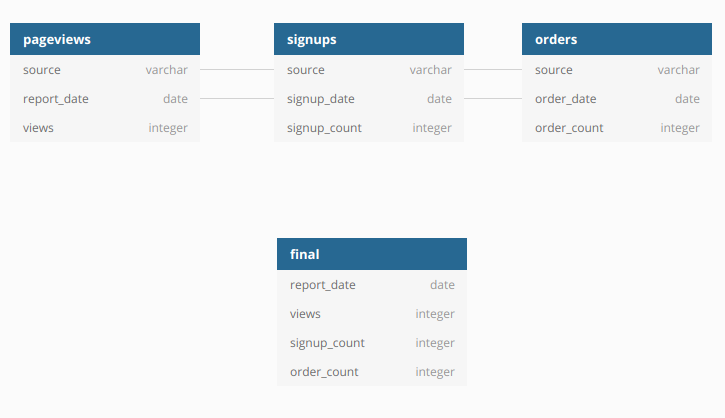
This, similar to the above example, can work well in Google Data Studio. As long as the tables you want to join have the same keys, Data Blending will works fine. Although pageviews (GA), signups and orders come from 3 different data sources, we can combine them into a single table.
Blending 3 or more Data Sources with DIFFERENT join keys (popular)
GDS starts to get complicated with the following use case (extending on the first example), where you want to list users together with their city and country name (2-level joins).
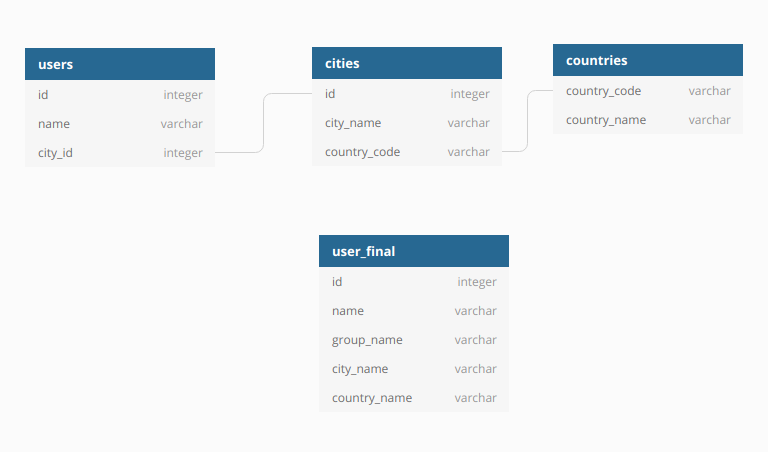
At this point Data Blending does not behave like a SQL JOIN, as the blending requires the same join keys to present in all data sources, or the blending will not happen at all.
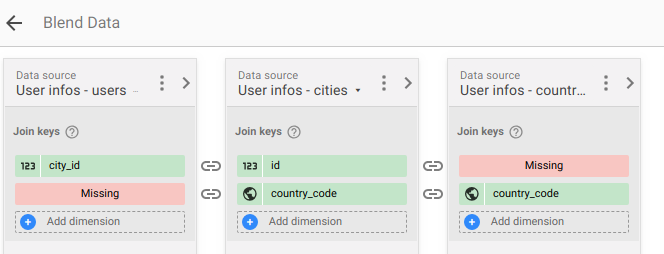
Typically, to solve this problem we would think of blending users and cities into a view, then blend this view with country. Unfortunately, this operation is not currently supported in GDS.
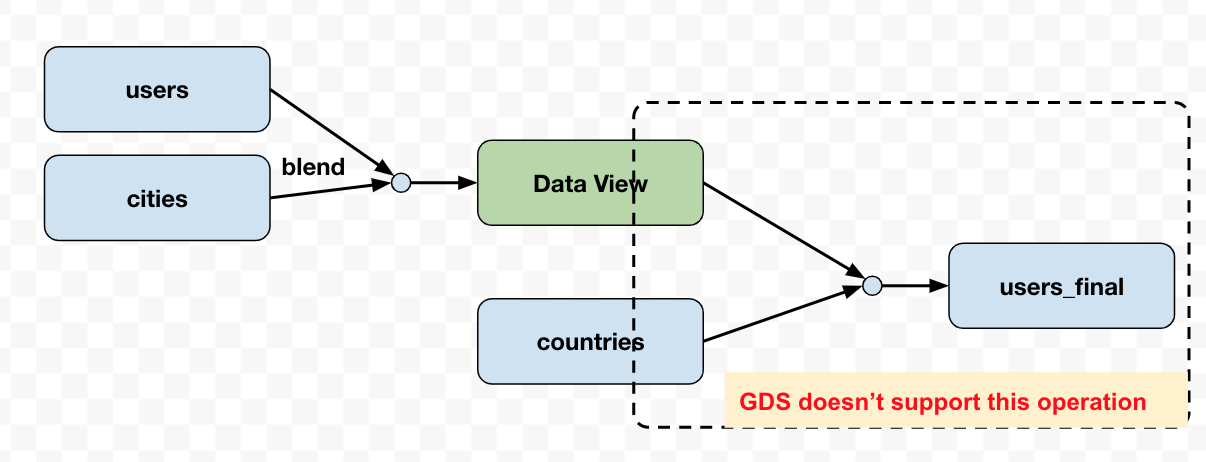
Blended data sources is called a "Data View" which is only available within the report it was created, meaning it cannot be shared or reused. In other words, the idea of Data Blending sounds great but the execution is not up to par. If it is developed further, Data Blending will be a great companion with Explorer mode.
In short:
- Data Blending only serves you well if your data is already aggregated, and your table merge operation is simple.
- For more complex data joins, you need to perform the joins in BigQuery using SQL, and only load the resulting data table into GDS.
Access Control & Sharing Data Across Organization
Reports and Data Sources have the same sharing, permission and ownership mechanism as a document on Google Drive, but without folder structure. When created, these objects are saved as an "Unknown File" in the main Google Drive folder, which is quite messy.
Data sharing is easy for individuals, but for groups GDS relies on Google Groups, which add friction to the experience. In fact the mechanism is quite restrictive for large organizations that need complex permission control.
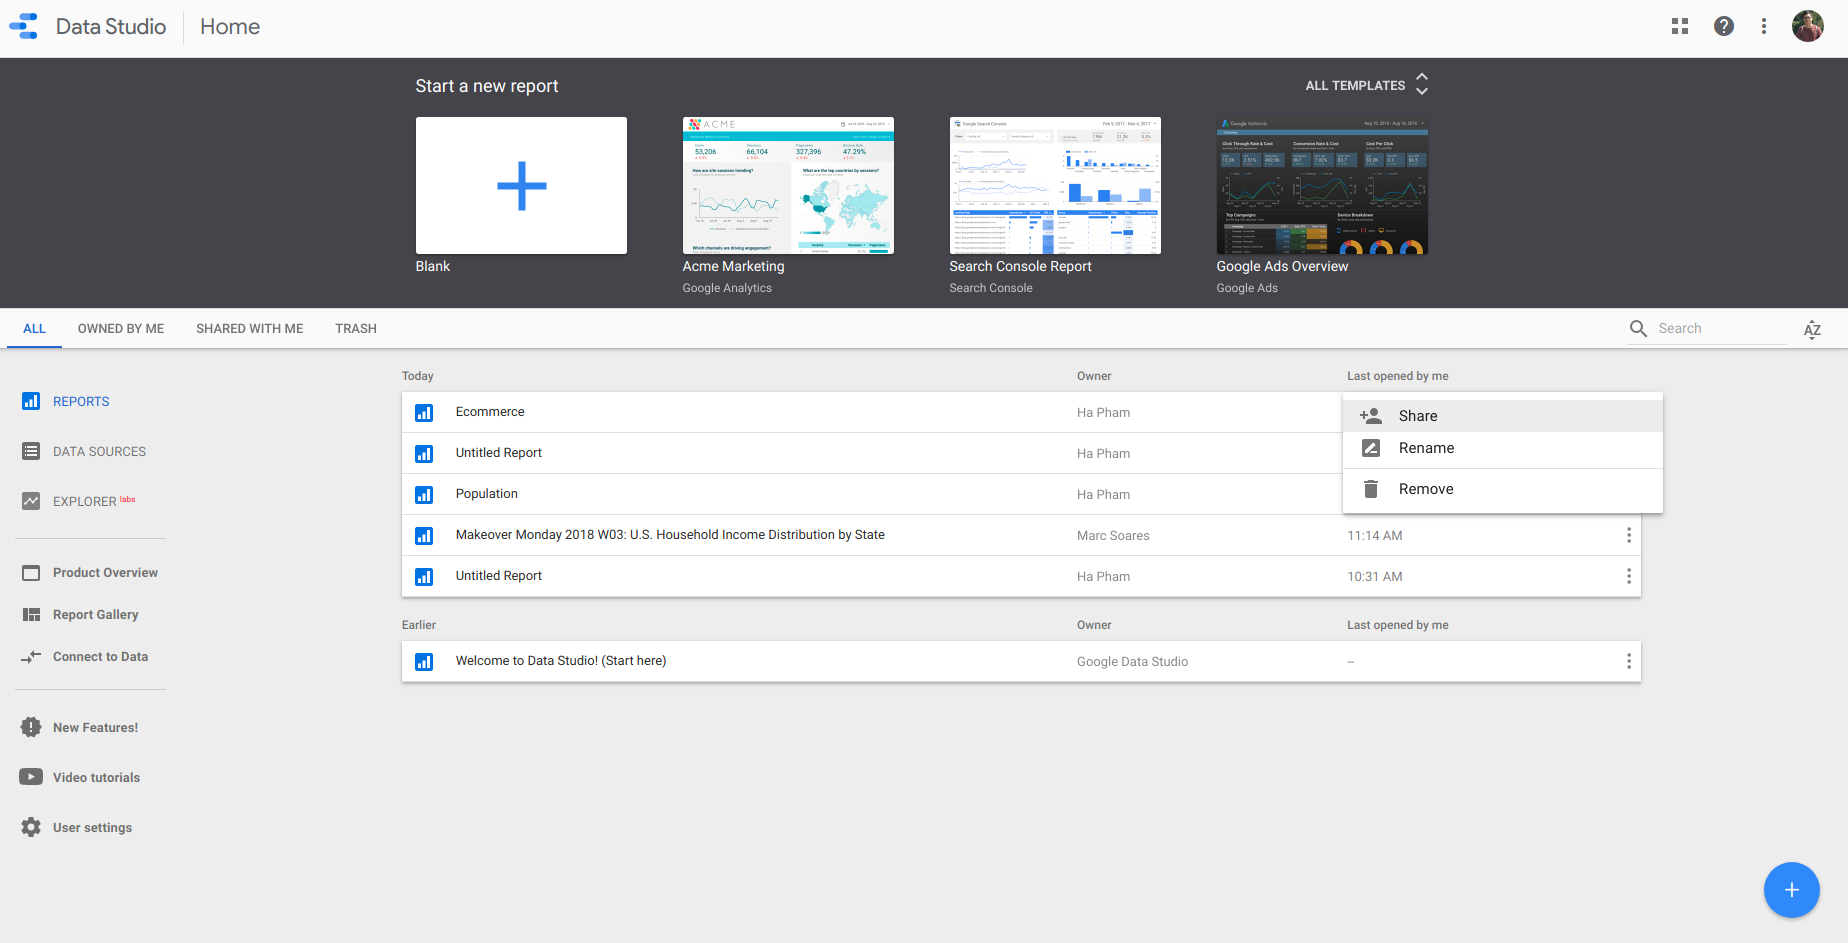
For example, when a user leaves an organization, the ownership transfer process in Data Studio right now is clunky. There are cases when a user's corporate Gmail account is disabled before he could transfer his reports & data sources ownership, and this leads to hundreds of data sources being deactivated and must be re-connected to the data set. This process is quite time consuming, tedious and sometimes unmanageable.
Data Sharing & Delivery
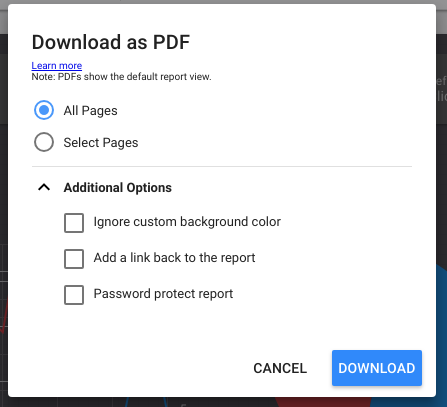
User can share GDS report like any other documents in Google Drive, or download a nicely formatted PDF file (though the optional customization is bare-bone).
The much-needed email schedules feature is nowhere to be found, which is surprising because integration between GDS and Gmail seems to be a natural progression.
Integrations with different data sources
GDS integrates well with other products in the Google ecosystem, mostly database products (BigQuery, Spanner, Cloud SQL...), ads & campaign management products (Google Analytics, Adwords, Youtube Analytics...) and Google Sheets.
- BigQuery: GDS can easily connect to BigQuery's tables and views, and it also support custom SQL to help users optimize dashboard performance and query cost. Each table, view and custom SQL acts as a data set.
- Google Sheets: Each sheet in a Google spreadsheet is a separated data set, meaning each data source will connect to only one sheet in a spreadsheet. Data in the sheet should be in tabular form for GDS to work correctly.
- Apps (GA, Youtube, Google Ads): GDS has official connectors to Google Analytics, Youtube Analytics and the likes. When connecting to these sources, GDS automatically recognize available Dimensions and Metrics. There are also GDS templates built to work instantly with Google Ads or Youtube Analytics, and there is even a dedicated filter to control GA data sources in GDS. However, data obtained via these official connectors are only aggregated (and possibly sampled) data.
- Working with non-Google stack: As shared above, beside official connectors to Google products, GDS features hundreds of connectors written by Google partners as well as a few open source ones. These connectors help you explore public (or sometimes private) data from other websites, in which social media and ads platform connectors account for the largest portion.
Raw data, BigQuery & Data Studio
In case you want raw, hit-level data from Google Analytics, you can export those to BigQuery if you have a Premium GA account. Raw GA data is quite large and in nested form, so you would need another transformation layer before exploring it with GDS.
As for Firebase Analytics, the only way connect it with GDS is to export raw data to BigQuery and use GDS to explore those Firebase tables. This option only available for Blaze Plan (aka Premium Plan) users.
Google wants Data Studio to be a complementary product to their Cloud Platform
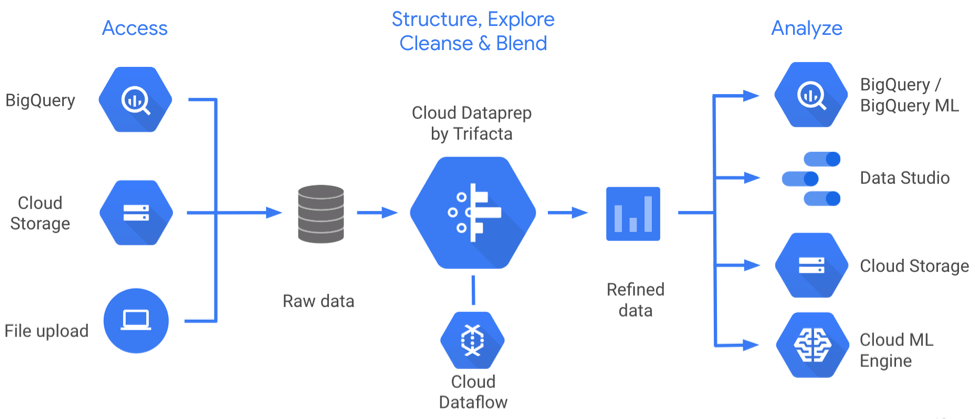
From the look of it, Google would build and position GDS as the reporting/BI piece of their Google Cloud Platform stack. That would also mean a few things:
- They will focus on getting GDS works seemlessly with GCP, rather than trying to support every single database/integration out there. Their goal will be to increase the overall competitiveness of Google Cloud to compete with AWS and Microsoft Azure.
- They might not necessarily focus on making Google Data Studio the best-possible BI tool (as compared to other independent BI provider)
- If you're not on Google stack, choosing Google Data Studio might not be a wise choice. Granted there are data connectors that allow you to work with database like Redshift (AWS), but these won't be first-class citizen.
Pricing
At the moment, Google Data Studio is offered completely free by Google as part of their Google Cloud Platform offering.
It's likely that Google will start charging for it (or a premium version of it) in the future, similar to that of Google Analytics (with Google Analytics 360)
Will Google deprecate Data Studio if it doesn't take off?
In the past, there has been multiple cases that Google shut down products that didn't take off. Though most of them are B2C products, there has been deprecated B2B products like Search Appliance or Maps Engine.
So this might happen again. Thus you stand the risk of GDS being shut down or discontinued. This may not be a big deal for small to medium startups who are generally more tech-savvy and can switch to other BI easier, but will be risky for more established companies.
But as we've shared earlier, our take is Google likely won't shutdown Data Studio as they need it to complement their cloud stack. However, they won't be as invested in building up the tool's capabilities as other dedicated BI tools.
For more Google Data Studio Analysis and Comparison, check out:
Summary & Conclusion
Overall, we think Google Data Studio is a decent BI tool that is great for reporting purpose that has simple data structure but complex formatting requirements (i.e the data behind is not complex, but end users require sophisticated reports).
A few key points highlighted below:
- Built for the semi-technical users, aka the business analysts.
- Multiple data connectors that support many integrations, but no guarantee of community-contributed connectors.
- Their reporting view with Powerpoint-like experience is unique and stand out from other tools we know.
- Their data modeling is weak and very basic, thus unable to perform complicated operations and self-service reporting. No drilldowns, and standard filtering capabilities.
- Data blending has potential but still very limited and makes it difficult for users to manipulate and join data (which usually takes 80% of the time)
- Designed to complement and works well with Google Cloud stack. Recommended only if you're already using (or decide to be) Google and GCP services.
| Functionality | Assessment | Notes |
|---|---|---|
| Report Presentation Layer | Great | Flexible report designer that appeals to business analysts and PowerPoint users |
| Combine Data Sources | Medium | Has potential but currently isn't up to par |
| Connectors Support | Good | Has in-built connectors as well as partners and community contributed connectors |
| Build complex reports | Weak/Medium | Drag and drop interface, thus difficult to build complex reports, have to resort back to writing SQL queries in BigQuery |
| Works with Google stack | Great | Google design Data Studio specifically to work well with GCP stack |
| Data Delivery | Medium | Allow PDF export |
| Data Access Control | Weak/Medium | Follows Google Drive permission sharing. |
| Self-service for Business Users | Weak | Feature still in Beta, and with weak data modeling layer this might not be possible |
| Interactive Drilldown | Weak | Not available |
| Pricing | Great | Currently free |
If you have any additional things to share, or particular area you want us to add, please share with us, or tweet to us at @holistics_bi!
p/s: If you're looking for an alternative to Google Data Studio, one with good self-service analytics capability and data governance/control support, check out Holistics.
What's happening in the BI world?
Join 30k+ people to get insights from BI practitioners around the globe. In your inbox. Every week. Learn more
No spam, ever. We respect your email privacy. Unsubscribe anytime.

