Healthcare BI Tools: A Research-Backed Buyer Guide (2025)
This guide cuts into healthcare business intelligence and the top healthcare BI tools—scalpel not included.


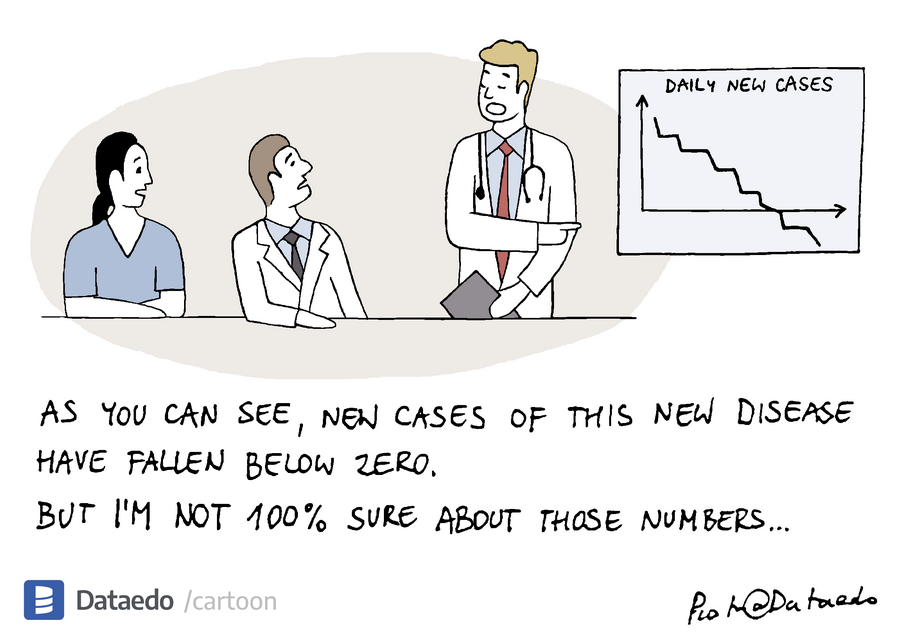
Imagine, if you can, an episode of Grey's Anatomy written by a BI analyst.
Instead of dramatic confessions in the elevator, Dr.Derek would now be tracking patient flow bottlenecks.
Instead of romantic tension in the operating room, we'd witness the revelation of a correlation between nurse staffing patterns and post-surgical infection rates.
The climactic moment wouldn't be a last-minute lifesaving procedure, but the implementation of a predictive model that identifies high-risk patients before they crash.

Sounds boring? Yes. But it'll probably be more realistic than the usual dramatic television because these scenarios play out in healthcare organizations nationwide. Healthcare organizations drown in data yet struggle to extract meaningful insights. They collect vast amounts of clinical, operational, and financial information without effective analytical approaches to improve patient safety or operational efficiency.
These challenges echo what we've heard from customers like Datacubed Health (eClinical solutions) and ZOE (personalized healthcare and nutrition app). Standard BI models fail in healthcare's complex environment, where sensitive data faces strict regulations and patient outcomes depend on connecting information across disparate systems, from electronic health records to billing platforms.
In this blog post, we'll introduce a healthcare-specific BI maturity model to assess readiness and guide strategy development, plus share key evaluation criteria and recommended solutions for healthcare BI tools.
Uses Cases of Business Intelligence in Healthcare
Healthcare runs on data. Hospitals, clinics, and research labs generate mountains of it—patient records, billing data, clinical outcomes, and staffing schedules. But raw data is useless without intelligence. That’s where business intelligence (BI) comes in.
Here are some of the common use cases in healthcare BI.
Patient Safety & Quality Improvement
Healthcare BI helps prevent errors before they happen. Hospital and clinical organizations use BI dashboards to track outcome metrics like adverse drug events, readmission rates, infection rates, and patient satisfaction scores in real-time, allowing for prompt intervention if quality drops.
For example, Duke University Health System reduced Clostridium Difficile infections by tracking data patterns and adjusting protocols. The result is fewer infections, lower costs, and better patient outcomes.
Common metrics are:
- Readmission Rate: The percentage of patients who return to the hospital within a set period (e.g., 30 days) after discharge.
- Infection Rates: Incidence of healthcare-associated infections (like surgical site infections or hospital-acquired infections per 1,000 patient-days).
- Medication Errors: The number of medication mistakes (wrong drug/dose/patient) in a given period.
- Patient Satisfaction Scores: Often measured via surveys (like HCAHPS scores in the US), an aggregate score of how patients rate their experience.
- Patient Follow-Up Rate: The percentage of patients who receive a follow-up contact or visit after discharge.
- Treatment Outcomes/Clinical Success: Metrics specific to certain departments – e.g., tumor remission rate in an oncology clinic, or percentage of diabetic patients with controlled blood sugar.

Operational Efficiency
Hospitals are complex machines. Every inefficiency costs time, money, and sometimes lives. BI can optimize scheduling, resource allocation, and patient flow. For example, dashboards can reveal patterns in patient flow to forecast peak times and adjust nurse/physician schedules accordingly, preventing staff shortages that could compromise care.
A well-run hospital is a safer hospital. Common metrics to measure operational efficiency are:
- Patient Wait Time: The average time patients wait to be seen (in clinics or ER).
- Bed Occupancy Rate / Room Utilization: The percentage of hospital beds or exam rooms in use at a given time.
- Staff-to-Patient Ratio: Number of patients per provider or nurse on duty.
- Equipment Utilization: Percentage of time critical equipment (MRI machines, OR theaters, etc.) is in use.
- Inventory Levels and Stock-outs: Metrics tracking medical supply inventory, such as days of inventory on hand and frequency of stock-outs.
Financial Performance
Billing errors, claim denials, and revenue leakage drain hospitals. BI stops the bleeding. BI can highlight a high claims denial rate or slow claim processing times, prompting administrators to improve documentation or follow-up processes.
Good healthcare BI tools come with financial tools allows admins to detect inefficiencies or wasteful spending, enabling cost reductions (e.g. identifying high-cost procedures or unnecessary tests). In practice, this means healthcare CFOs track KPIs like cost per patient, average treatment charges, and accounts receivable days to ensure financial health. For example, at Duke, BI analytics uncovered revenue cycle inefficiencies, recovering $12 million in lost revenue.
Common metrics to measure financial performance are:
- Net Profit Margin: The percentage of revenue that remains as profit after all expenses.
- Revenue Cycle KPIs: Metrics that gauge billing efficiency and reimbursement.
- Average Treatment Charge: The average charge for a specific treatment or service, which can be tracked by procedure or department.
- Cost per Patient (or per Visit): Total operational cost divided by number of patients treated. A lower cost per patient indicates better cost-efficiency.
- Payer Mix: The breakdown of revenue by payer type (e.g., what percentage comes from Medicare, Medicaid, private insurance, self-pay)
Public Health & Predictive Analytics
By leveraging historical and real-time data with machine learning algorithms, healthcare BI can predict patient risks, for example, identifying which patients are at high risk of hospital readmission or complications after discharge. Armed with these predictions, providers can implement preventive measures (such as follow-up calls or early interventions) to mitigate the risk, thereby improving outcomes and reducing costs. Predictive analytics also aids in population health by forecasting disease outbreaks or chronic disease prevalence in communities, helping public health officials and providers prepare resources
A notable example is Mayo Clinic’s use of BI-driven predictive models to flag patients likely to be readmitted, allowing care teams to provide targeted support and successfully lower readmission rates. Whereas in the eClinical/pharma realm, predictive analytics is used for risk-based monitoring of clinical trials and for drug discovery. Healthcare BI tools can analyze vast clinical trial datasets to predict potential patient dropouts, identify safety signals earlier, or determine which trial sites might underperform so that sponsors can take corrective action.
Imagine a hospital that collects terabytes of patient data every day. Every test result, diagnosis, and prescription is logged into an electronic health record. But there’s a problem—nobody really knows how to use this data effectively. Physicians drown in fragmented reports. Administrators struggle to track costs. Compliance teams spend weeks preparing regulatory filings. Data is there, but intelligence is missing.
This is the reality for many healthcare organizations. They invest in business intelligence (BI) tools but fail to extract real value. Why? Because they lack maturity in their BI adoption.
How to Build a Healthcare-Specific BI Maturity Model
A BI maturity model is a roadmap. It tells a hospital where it stands in terms of data capabilities and what steps to take next. Generic BI models exist, but healthcare is different. It has unique challenges: strict privacy laws, complex billing systems, and life-or-death decisions. A healthcare BI maturity model accounts for these realities.
Stages of Healthcare BI Maturity
Every hospital, clinic and healthcare organization falls somewhere on this spectrum:
- Adhoc (No BI Strategy): Reports are scattered, often in spreadsheets. Data is siloed: financial, clinical, and operational systems don’t talk to each other. Decisions rely more on gut feeling than data.
- Reactive (Basic Reporting): Basic dashboards exist, but they are backward-looking. Reports answer “What happened?” but not “Why?”
- Proactive (Data-Driven Decisions): Data from different departments is connected. Dashboards provide near real-time insights. Leaders start using data to drive decisions.
- Predictive (Advanced Analytics): Hospitals move beyond looking at past trends. They predict patient readmissions, optimize staffing with AI, and catch billing fraud before it happens.
- Prescriptive (Fully Integrated BI): BI is embedded in workflows. The system suggests actions in real-time, guiding clinical and financial decisions.
Building the Model: Steps to Take
- Assess Readiness: Identify current BI capabilities. Where is data stored? How is it used?
- Break Down Silos: Ensure that clinical, financial, and operational data can be integrated.
- Focus on Actionable Insights: Reports don’t matter unless they lead to better decisions. Hospitals must design BI systems that answer real-world questions: Where are costs leaking? Which patients are at risk?
- Invest in Training & Culture: Even the best BI system fails if staff don’t trust it. Doctors, nurses, and administrators need training to use data effectively.
- Scale Over Time: BI adoption should be incremental. Start with foundational analytics and gradually move toward AI-driven insights.
What To Look For When Evaluating Healthcare BI Tools
First, we understand that we healthcare as a whole is too broad and there’s a big difference between general healthcare analytics and pharma/clinical research.
Healthcare providers like hospitals, EMR systems, and patient engagement platforms might want to prioritize performance-driven analytics, where insights are mostly pre-built, static, and easily digestible. Dashboards should be simple, with minimal interaction, allowing clinicians and administrators to access key performance indicators without complex data manipulation.
Pharma and clinical research, on the other hand, demand deeper interactivity. They require granular row- and column-based controls, advanced filtering, and dynamic access rules—especially in clinical trials, where blinded and unblinded data must be strictly enforced. This means healthcare BI tools should support fine-grained access control, advanced permissions, and dynamic data masking.
Security and compliance are non-negotiable in both sectors, but with different priorities. HIPAA compliance is essential for healthcare providers, while pharma and biotech firms focus more on CFR Part 11, GDPR, and HiTrust certifications. A BI vendor with these certifications has a clear advantage.
Given this complexity, this section covers the must-have features we've identified from working with clinical research and healthcare providers when evaluating healthcare BI tools.
(P/S: There is a pretty robust community for data teams in the healthcare sector on dbt Slack which is where I get most of the knowledge used in this article. Join it here)
Let's get back to our core BI features.
1. Robust Integration with Existing Systems
Healthcare runs on a maze of software including, but not limited to Electronic Health Records (EHRs), billing platforms, lab systems, scheduling tools. A healthcare BI software must connect with these. Otherwise, you’re stuck exporting and merging spreadsheets manually. Look for tools that support integrations with Epic, Cerner, or Meditech, as well as finance and HR systems.
2. Near Real-Time Analytics
A hospital can’t afford to wait for monthly reports.
Healthcare BI software should provide real-time dashboards for patient admissions, staff utilization, or supply shortages. Even better, it should predict problems before they happen. Imagine knowing which patients are at high risk for readmission before they leave the hospital. AI-powered BI makes that possible.
3. Strong Data Governance & Compliance
Healthcare data is highly regulated.
A BI system must handle HIPAA, GDPR, BAA, SOC2, HiTrust and CFR Part 11 compliance effortlessly. It must also offer strict user access controls, audit trails, and encryption and allow de-identified reporting for research while keeping patient identities protected.
4. Intuitive, No-Code or Low-Code Interface
BI should be accessible to everyone, not just data scientists. Look for drag-and-drop dashboards, natural language queries, and pre-built templates. If doctors and administrators need an IT team every time they want a report, the system will fail.
5. Scalability & Performance
Healthcare data grows fast. A good BI tool should scale without slowing down. Whether you run a single hospital or a multi-location health network, your BI system should handle large datasets, run queries fast, and support cloud deployment.
For large datasets or high concurrency, efficient caching and query performance are essential to maintain a good user experience. Look into:
- Caching mechanisms: How the tool handles caching. Common caching mechanisms are:
- In-memory caching: Storing data in RAM for fast access. Offers speed at the cost of memory usage and data freshness management.
- Materialized Views: Precomputing and storing query results as tables in the database, which shift computation to a pre-processing phase, giving fast reads at the cost of storage and refresh complexity, and are best for relatively static, heavy queries.
- Query caching: Saving previous query outputs to avoid redundant computation. This boosts performance for repeated workloads but requires query repeatability and cache invalidation strategies.
- Pre-aggregations: Pre-aggregating data across dimensions for rapid multi-dimensional analysis. This provides an interactive fast analytic experience for defined data models, trading off flexibility and requiring significant upfront investment in design and processing.
- Performance Analytics: Tools to measure query response times at the dashboard or widget level.
- Query control options for managing resource-intensive operations.
6. Advanced Reporting & Customization
Every healthcare organization is different. A BI tool should offer:
- Custom KPI tracking (readmission rates, bed occupancy, infection control).
- Automated alerts (flagging overdue payments, staffing shortages).
- Mobile access (real-time data on any device).
8 Best Healthcare Business Intelligence Software
10 best healthcare BI tools we recommend are:
- Holistics
- Precision BI
- Power BI
- Tableau
- Sisense
- Domo
- Looker Studio
- Thoughtspot
01. Holistics
Holistics is a powerful self-service analytics platform providing a centralized data modeling approach for BI teams. (Yes, it's us!)
Strengths: Holistics takes a developer-first approach to BI, making it a strong choice for data-mature healthcare organizations. Its code-based semantic modeling layer allows data teams to define standardized metrics, data models, and reports programmatically, reducing inconsistencies core metrics in patient outcomes tracking and financial reporting.
For governance and compliance, Holistics is BAA-compliant. It also integrates Git version control, allowing data team to track changes in analytics models and dashboards.
The canvas-based dashboard system (demo below) is highly flexible, supporting both operational monitoring (e.g., ER patient flow, bed occupancy) and interactive clinical dashboards for physicians and administrators. Unlike rigid, visualization-first tools, Holistics empowers non-technical users to build their reports and explore data independently for operational needs.
With ten years in the market as a bootstrapped, sustainable company, Holistics offers a stable alternative to venture-backed competitors that might prioritize growth over product consistency.
Limitations: Holistics requires a learning curve, making it less ideal for non-technical healthcare users who need plug-and-play dashboards. The lack of a large partner ecosystem limits out-of-the-box EHR integrations (e.g., Epic, Cerner). Healthcare organizations needing prebuilt healthcare analytics modules may find setup more complex than in established tools like Power BI or Tableau.
Best for: Data-driven hospitals, research institutions, and scale-ups in healthcare looking for programmable BI with strong governance. Ideal for small, efficient data teams supporting complex reporting needs without excessive dashboard maintenance.
02. Precision BI
Strengths: Precision BI is built specifically for healthcare analytics, making it a natural fit for hospitals, clinics, and healthcare networks. Unlike generic BI tools, it comes pre-integrated with major EHR systems like Epic, Cerner, and Meditech, reducing the technical lift required for implementation. This makes it easier for healthcare administrators, finance teams, and clinical staff to access insights without heavy IT involvement.
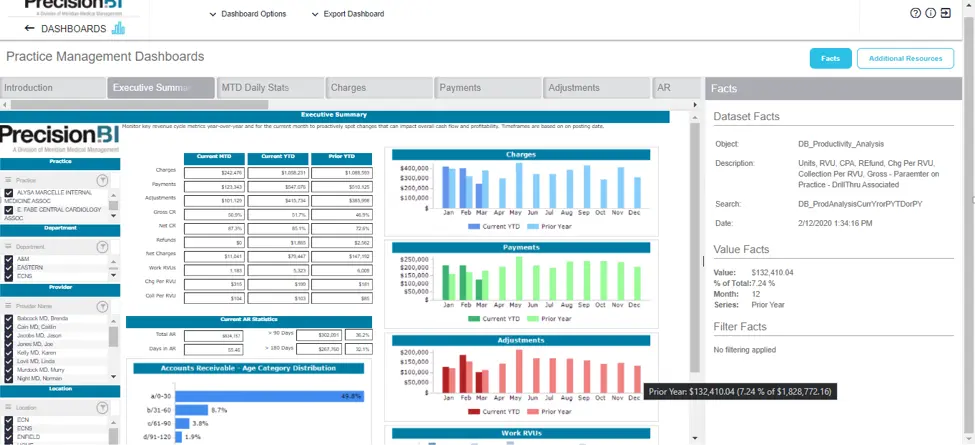
Precision BI excels at regulatory compliance and population health analytics. It includes pre-built dashboards and reports for CMS reporting, Medicare reimbursements, and quality measures tracking. Healthcare organizations can benchmark performance against national standards, making it a strong tool for value-based care initiatives.
Limitations: While healthcare-focused, Precision BI lacks the flexibility and UX polish of broader BI platforms like Power BI or Tableau. Customization is limited, which can be a drawback for organizations with unique analytics needs. Without Git-based version control, change tracking and accuracy maintaining are also limited.
Best for: Hospitals, clinics, and healthcare networks that need turnkey BI with deep EHR integration and compliance-focused reporting.
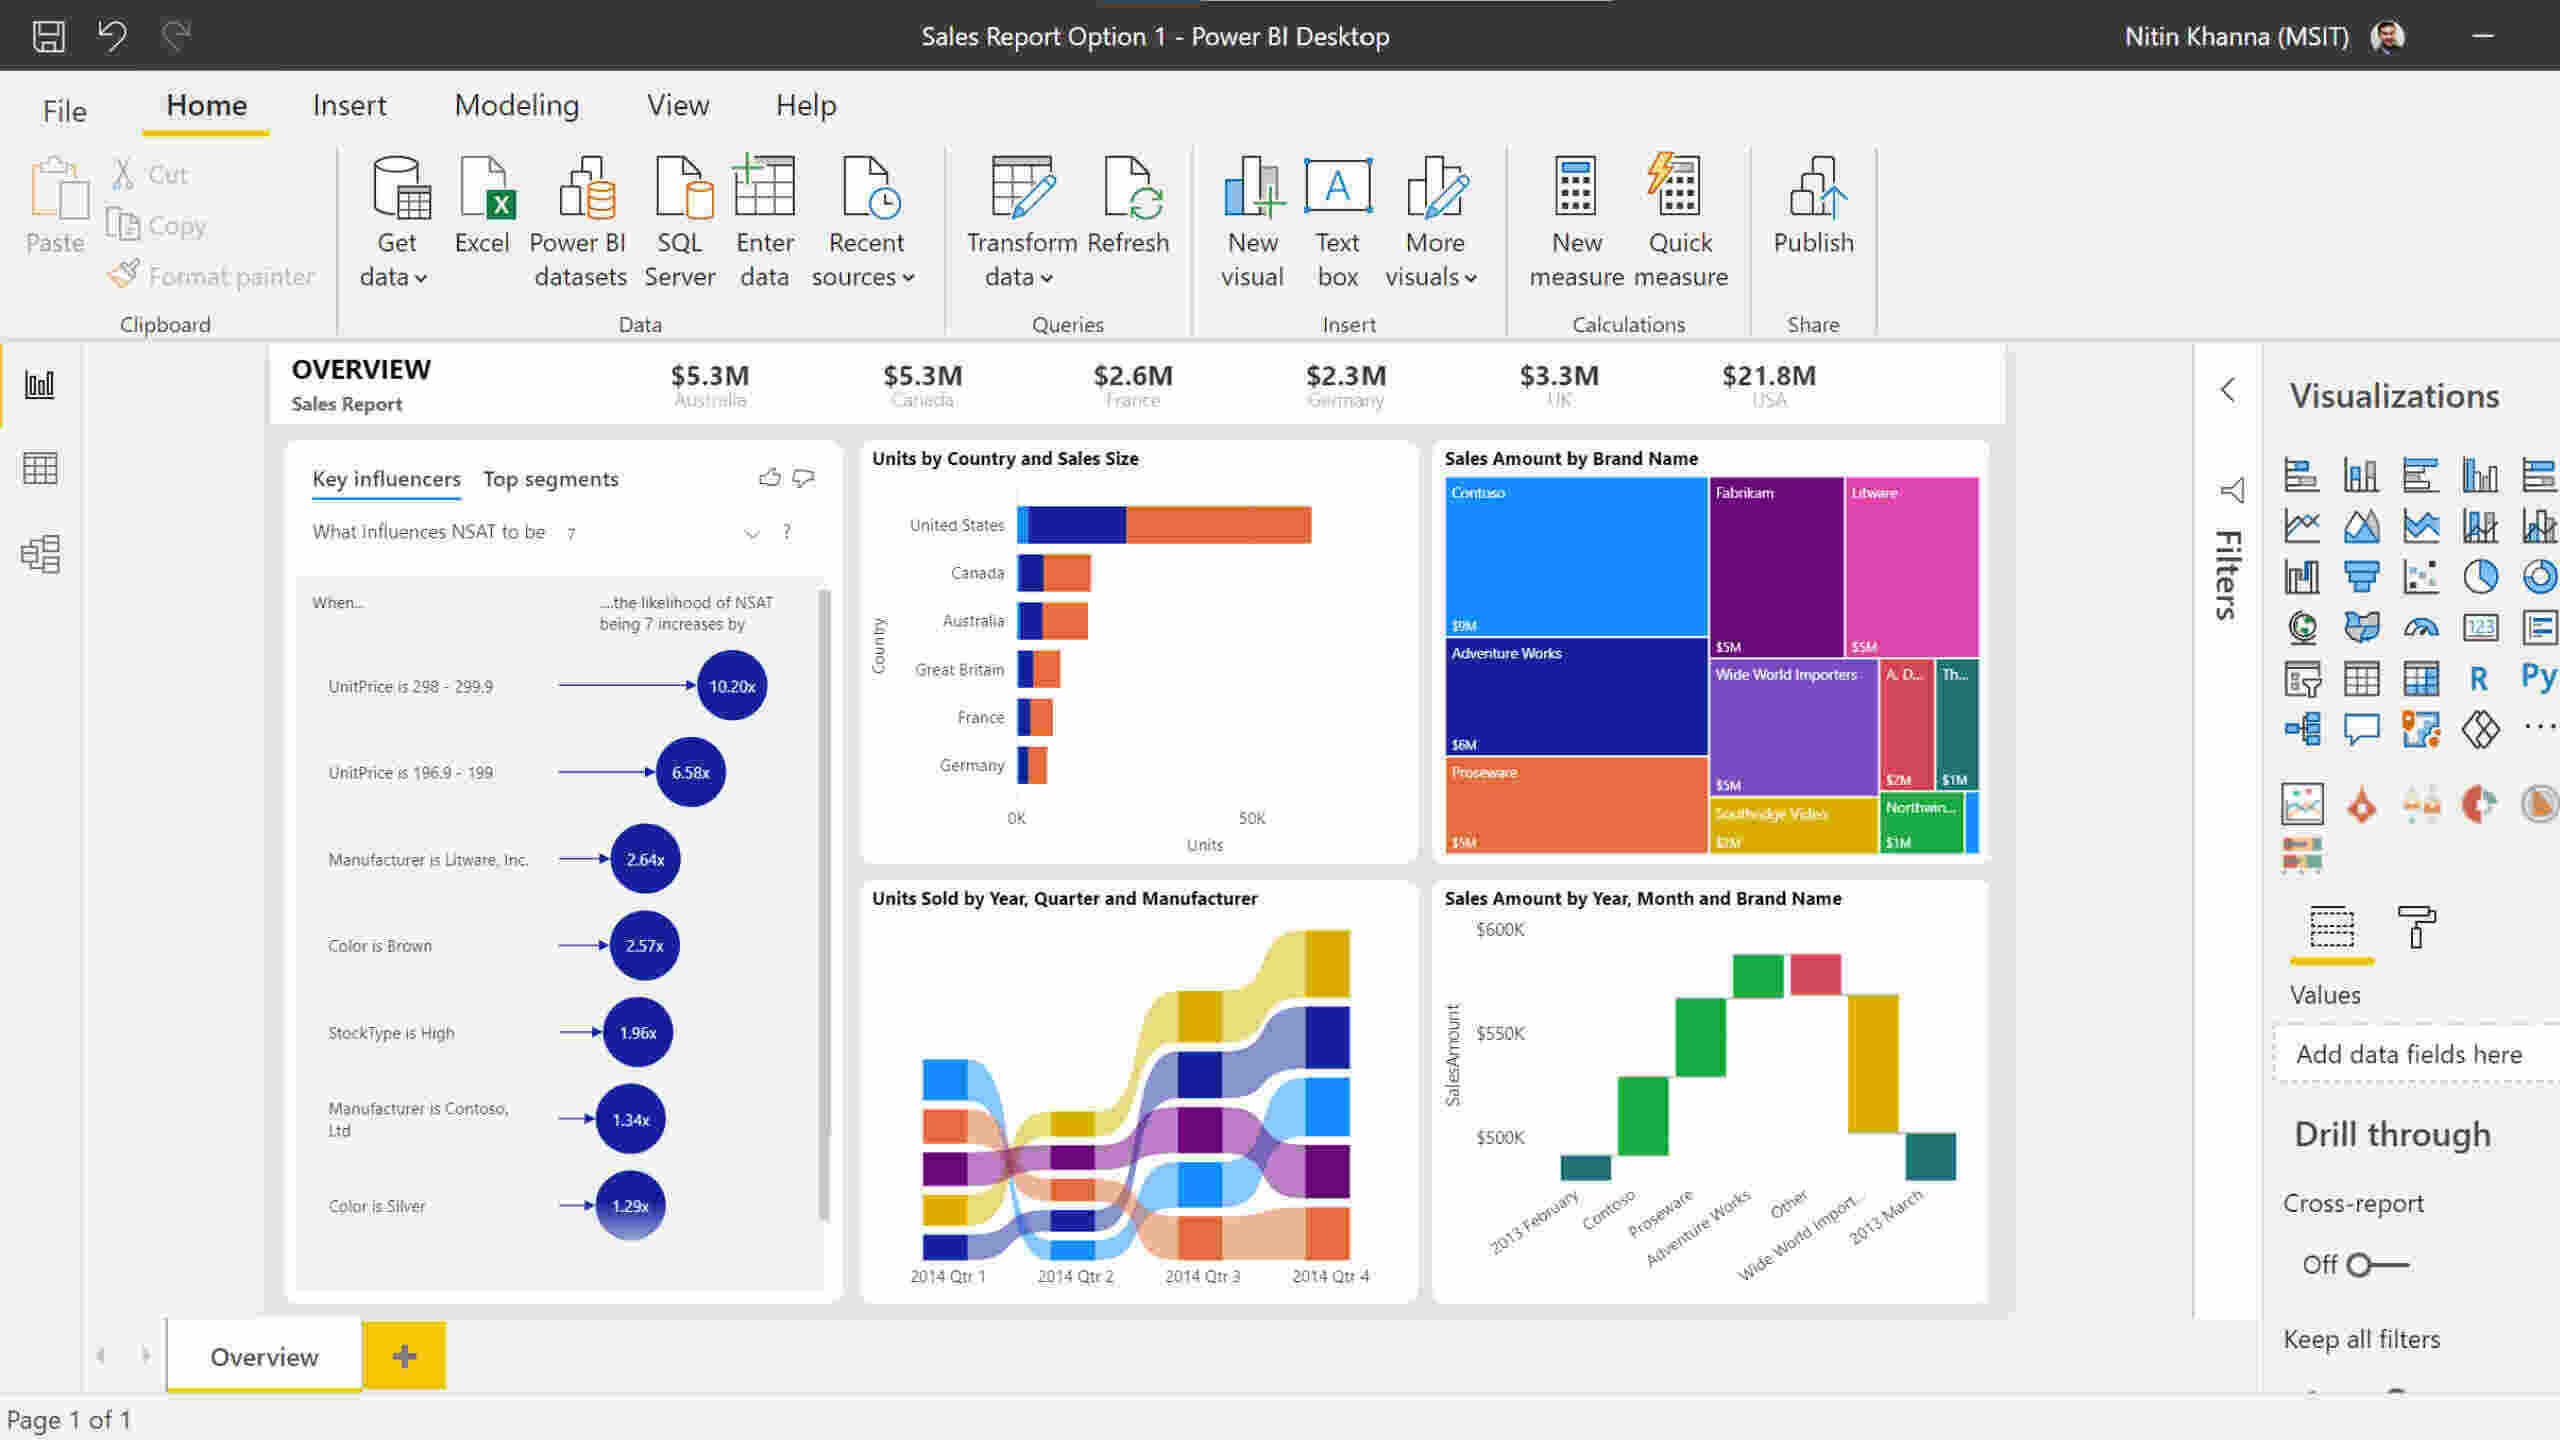
03. Power BI
Strengths: Power BI is one of the most widely adopted BI platforms, and for good reason. Microsoft’s flagship analytics tool offers deep integration with healthcare IT ecosystems, particularly for organizations already using Azure, Dynamics 365, and Microsoft Cloud for Healthcare.
Power BI is known for its scalability and affordability. Its AI-powered analytics can also help hospitals predict staffing shortages, detect billing anomalies, and flag high-risk patients before they need critical care.
Power BI self-service capabilities allow business users to build reports with minimal technical expertise, while advanced users can leverage DAX and Power Query for complex modeling.
Limitations: Power BI lacks a centralized semantic layer, making it harder for hospitals to maintain a single source of truth across multiple reports and dashboards. Without Git version control, tracking changes in data models or dashboards is challenging, making auditing and governance more cumbersome.
Best for: Large hospitals, healthcare systems, and insurers looking for enterprise-grade analytics with deep customization.
04. Tableau
Strengths: Tableau is known for best-in-class data visualization, making it a strong choice for healthcare organizations that need interactive, dynamic reporting. It excels at turning complex datasets (patient outcomes, financials, clinical workflows) into intuitive dashboards that even non-technical users can explore.
Healthcare providers benefit from Tableau’s pre-built healthcare templates, including dashboards for hospital operations, patient care metrics, and revenue cycle management. Its drag-and-drop interface makes it easy for administrators, clinicians, and executives to build reports without writing complex SQL queries.
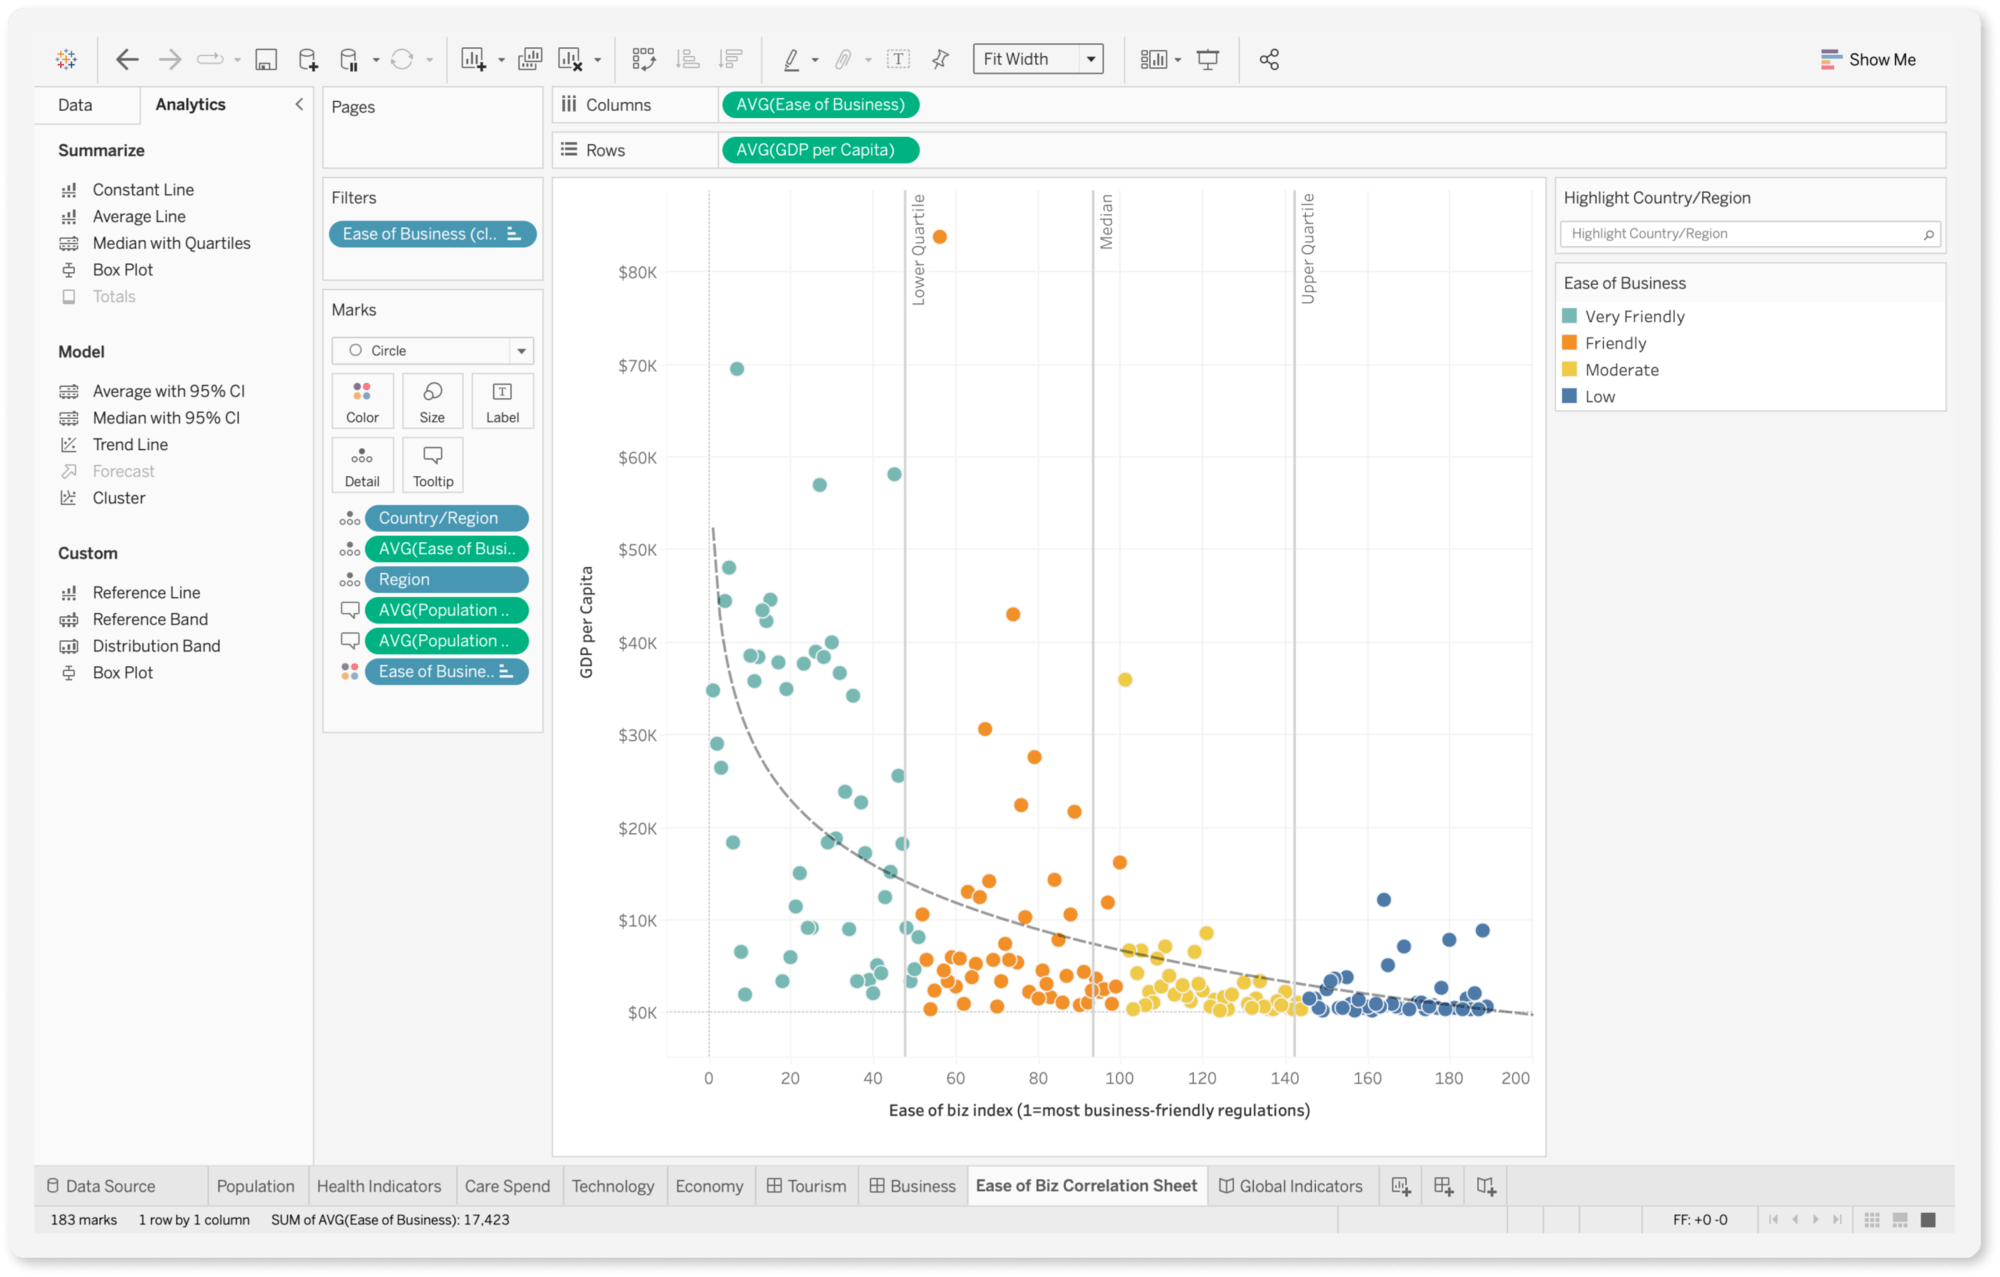
Limitations: Despite its strengths in visualization, Tableau also lacks a built-in semantic layer, making it difficult to maintain consistent KPIs across an entire healthcare organization. Without Git version control, tracking changes in metrics or reports is manual and error-prone. Real-time analytics capabilities are limited, making it less suited for use cases that demand instant operational insights, like ER wait time tracking.
Best for: Healthcare organizations prioritizing data visualization and exploration over advanced data modeling.
05. Sisense
Strengths: Sisense is known for its robust embedded analytics and flexibility for technical users. Sisense's powerful API and white-labeling options allow organizations to customize dashboards to fit seamlessly within their healthcare applications. This is useful for patient portals, clinical decision support systems, and operational healthcare dashboards. Sisense also supports JavaScript-based custom scripting, enabling developers to modify dashboard behavior, automate workflows, or add unique healthcare-specific analytics features.
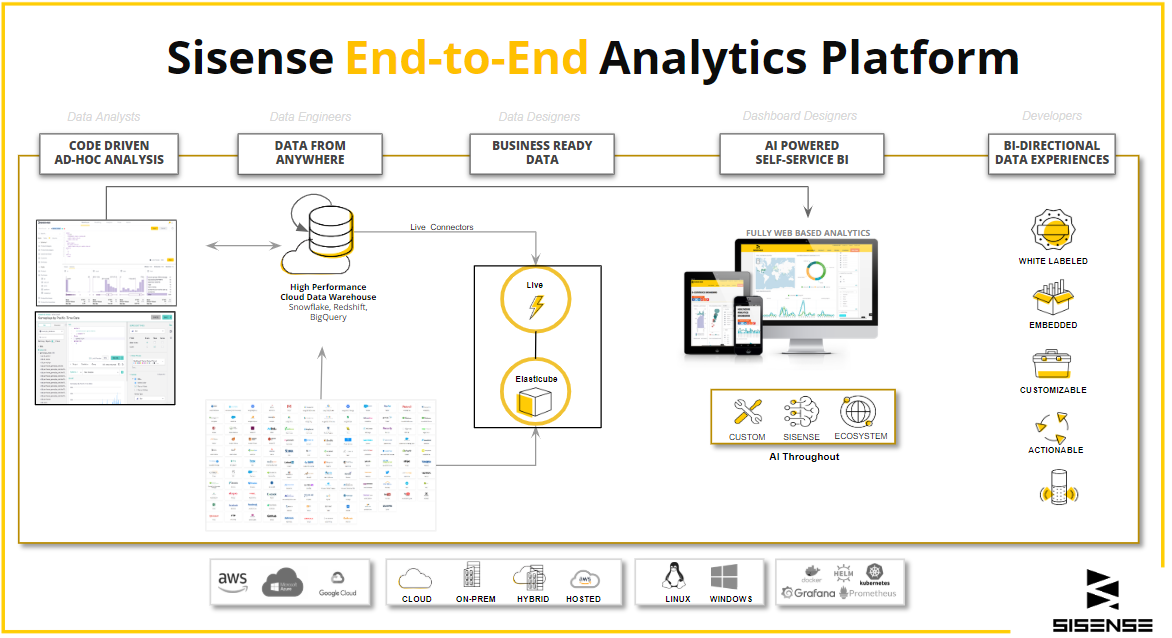
Limitations: Despite its strengths, Sisense has a steep learning curve, especially for non-technical users. Analysts accustomed to more intuitive tools like Power BI or Tableau may find its data modeling view cluttered and the dashboarding interface unintuitive, with limited layout flexibility and frustrating design constraints.
Pricing is another drawback. Sisense is opaque about its pricing structure, making it difficult for healthcare organizations to budget properly. It’s also considered expensive for the level of out-of-the-box functionality it provides.
Best for: Healthcare SaaS companies, digital health startups, and large health systems that need deeply embedded, customizable analytics.
06. Domo
Strengths: Domo takes a business-user-first approach to BI, making it a strong contender for healthcare organizations that need quick, self-service analytics without heavy IT involvement. A key differentiator is Domo’s end-to-end cloud-native architecture. Unlike traditional BI platforms that require separate ETL, storage, and visualization tools, Domo provides data ingestion, transformation, analysis, and dashboarding in one unified platform. This is particularly valuable for healthcare providers with limited IT resources who need an all-in-one BI solution.
Domo also offers over 1,000 data connectors. Its AI-powered insights help identify patient care trends, optimize staffing, and track financial performance in real-time.
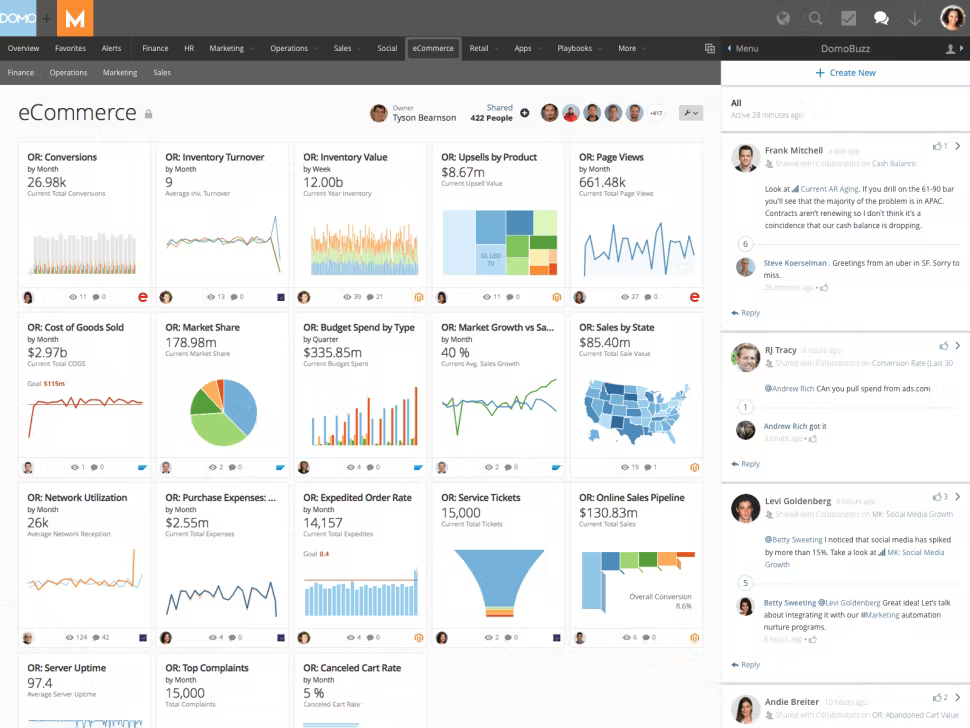
Limitations: While Domo is easy to deploy, its strengths are in accessibility rather than deep customization. Unlike Holistics and Looker, it lacks advanced governance controls for metric consistency, making it harder for large healthcare systems to enforce standardized KPIs across departments.
Additionally, Domo’s pricing model can be a barrier. Unlike per-user pricing models, Domo uses a consumption-based model, which can become expensive for large health networks processing significant volumes of data.
07. Looker Studio
Strengths: Looker Studio (formerly Google Data Studio) is a free, cloud-native BI tool that excels in data visualization and dashboarding. It’s a great option for healthcare organizations looking for lightweight, easily shareable reports. With its tight integration into the Google Cloud ecosystem, it connects seamlessly with Google BigQuery, Google Sheets, and other cloud-based data sources, making it a natural choice for healthcare institutions leveraging Google’s data infrastructure.
A major advantage is its recent integration with Looker’s semantic layer. This allows healthcare organizations to maintain consistent KPIs and definitions across reports, reducing the risk of metric discrepancies.
Limitations: While Looker Studio is free and easy to use, it lacks enterprise-grade features for large-scale healthcare analytics. Compared to Holistics or Looker Core, it has weaker governance controls and limited data modeling capabilities. Organizations needing real-time analytics or complex data transformations may find Looker Studio too basic.
Best for: Smaller healthcare organizations, clinics, and research teams that need quick, Google-friendly reporting tools without heavy IT investment. Ideal for teams already using Google Cloud and BigQuery but not suitable for complex, large-scale healthcare BI environments.
08. Thoughtspot
Strengths: ThoughtSpot stands out with its search-driven analytics and natural language query (NLQ) capabilities, making it one of the best BI tools for non-technical healthcare professionals. Instead of building complex dashboards, users can simply type questions like “Which clinics have the highest readmission rate?” and get instant, AI-driven insights.
Its AI-powered insights engine, SpotIQ, automatically identifies anomalies, trends, and correlations in patient care, hospital operations, and financial data.
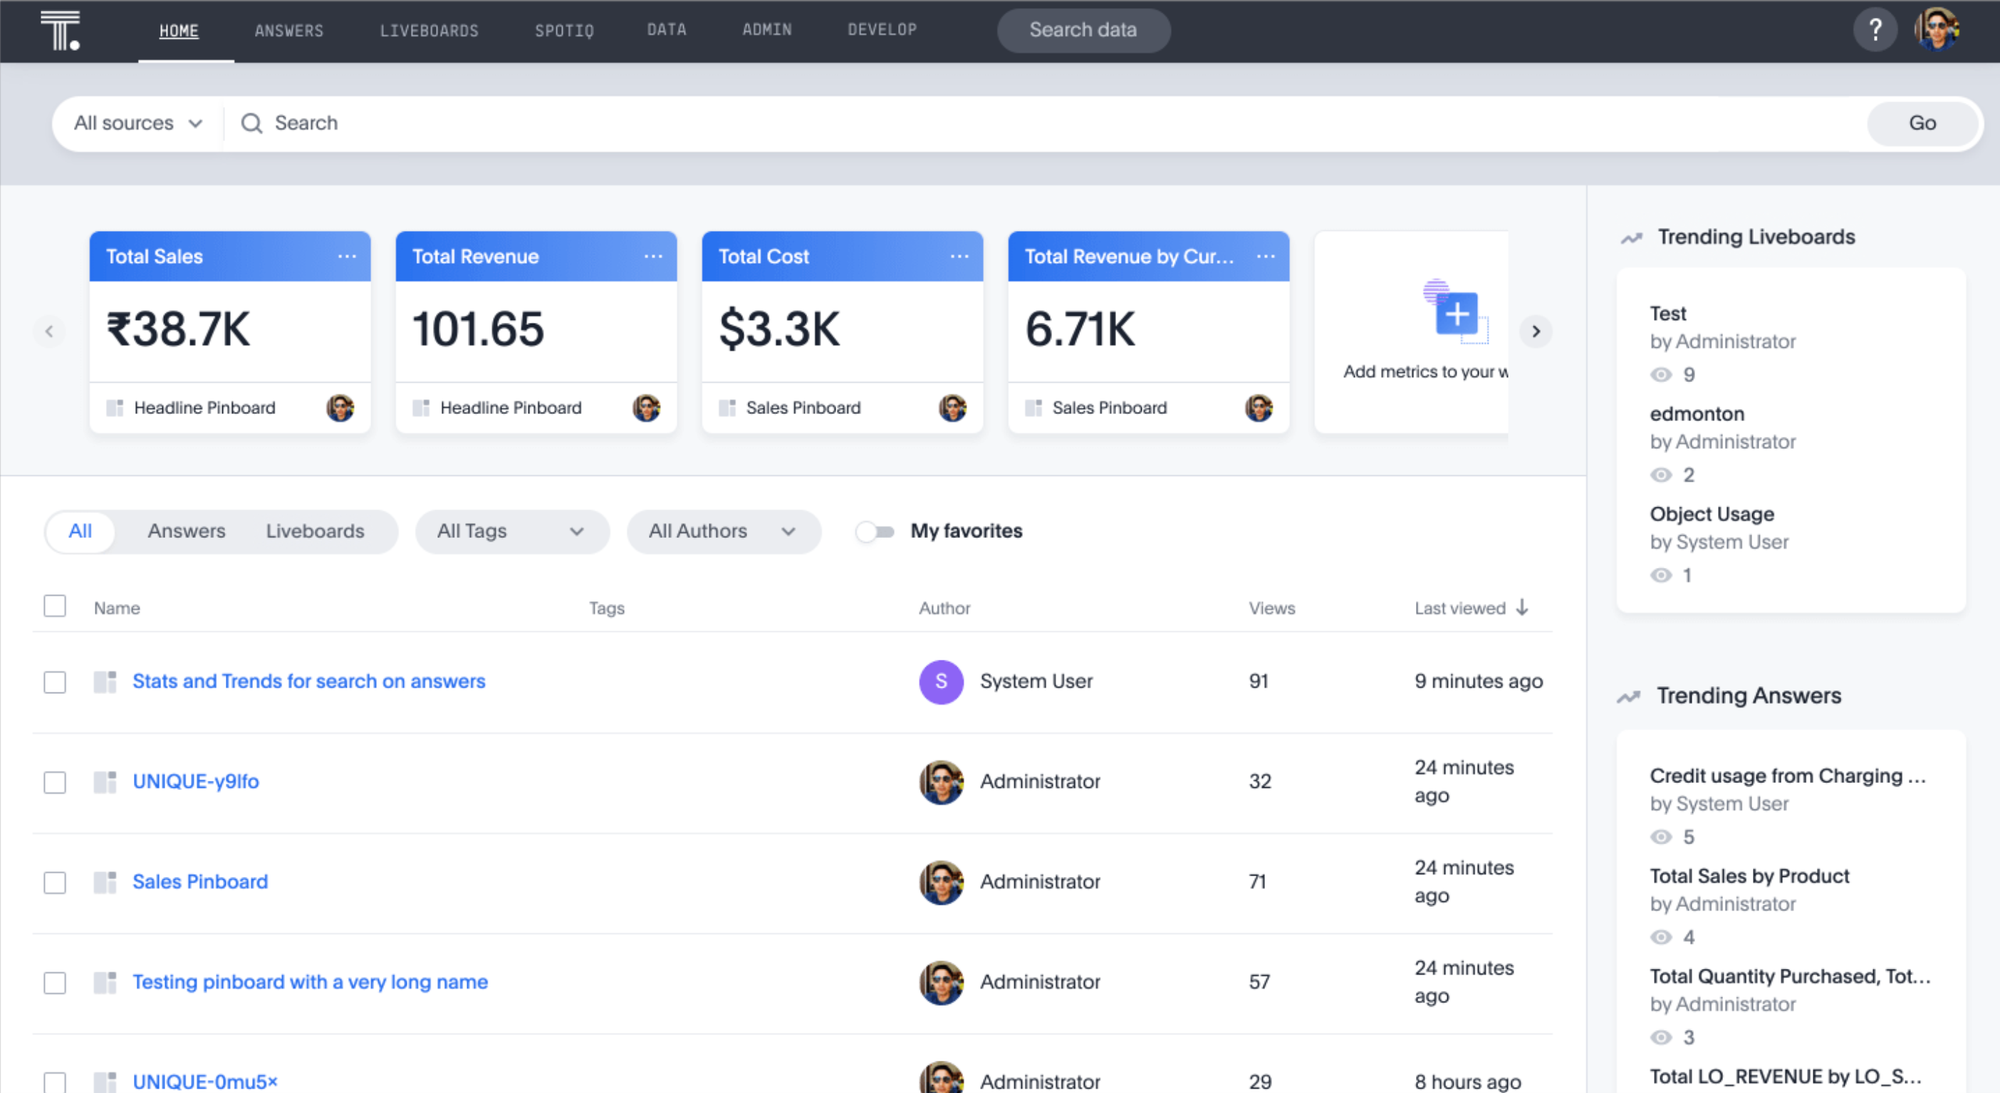
Limitations: While ThoughtSpot’s NLQ and AI-driven insights are powerful, it lacks advanced visualization capabilities compared to Tableau or Power BI. Healthcare organizations requiring centralized modeling, predictive analytics, or complex report customization may find it limiting.Additionally, ThoughtSpot is expensive, particularly for organizations that need enterprise-scale deployments.
Best for: Healthcare organizations focused on self-service analytics and AI-driven insights.
Wrapping Up
Research we looked into includes:
- Ferranti, J.M., Langman, M.K., Tanaka, D., McCall, J. and Ahmad, A., 2010. Bridging the gap: leveraging business intelligence tools in support of patient safety and financial effectiveness. Journal of the American Medical Informatics Association, 17(2), pp.136-143. [Online] Available at: https://doi.org/10.1136/jamia.2009.002220 [Accessed 11 March 2025]
- Ramalingam, S., Subramanian, M., Reddy, A.S.V., Tarakaramu, N., Khan, M.I., Abdullaev, S. and Dhahbi, S., 2024. Exploring business intelligence applications in the healthcare industry: A comprehensive analysis. Egyptian Informatics Journal, 25, p.100438. [Online] Available at: https://www.sciencedirect.com/science/article/pii/S111086652400001X [Accessed 11 March 2025].
What's happening in the BI world?
Join 30k+ people to get insights from BI practitioners around the globe. In your inbox. Every week. Learn more
No spam, ever. We respect your email privacy. Unsubscribe anytime.
