How Planogram and Share of Shelf (SOS) Reports Maximise Revenue for Retail and FMCG Companies
Planogram and Share of Shelf/Space (SOS) reports are key field execution reports that are important concerns for decision makers to carry out the marketing strategy. In this article, we will explain what Planogram and SOS reports are.
Contents
Please scroll down for a Bahasa Indonesia version of the article.
In the Retail and FMCG world, a Marketer is not only required to master the field but also has to report to the Head Office. Considering that the marketed products are diverse, in large quantities, and are spread across many areas, the field execution reports have become important concerns for decision makers to carry out the marketing strategy moving forward. But good field execution becomes nonsensical if the reports we send cannot provide good insights to the Head Office.
Planogram and Share of Space (SOS) reports are examples of various key reports that must be sent to the Head Office. In this article, we will explain what Planogram and SOS reports are.
Planogram
A planogram is a visual diagram that provides the detail of the placement of merchandise inside the store. Planograms are used in several retail companies to show product placement on a shelf in the store. Product placement is one of the most important aspects of the retail industry, so as to maximize sales and minimize wasted space. In addition, planograms are used by manufacturers as a medium to optimize the appearance of their merchandise in the store.
Planograms are executed by the visual merchandiser or the marketing team. Also, planograms serve as a reference when we try to conduct the retail performance analysis to identify the potential causes of lower sales. The influence of planograms on increasing the value of sales depends on good merchandising planning.
As a consumer, often if we come to a store to buy one item, we are instead motivated to buy additional products that we actually did not plan to purchase before. In fact, we didn't even know that we wanted or needed it. This happens when the planogram is designed with the right structure. Similarly, consumers who come to buy a specific product can determine alternative options that might be better items to buy.
To increase revenue through Planograms, some producers carry out their analysis by combining historical sales data with planograms to identify high and low sales items and their placement. This will give you insight into which products you need to maintain, or which products you should move to areas with higher sales forecasts, and which products are likely to be more in demand with changes in placements.
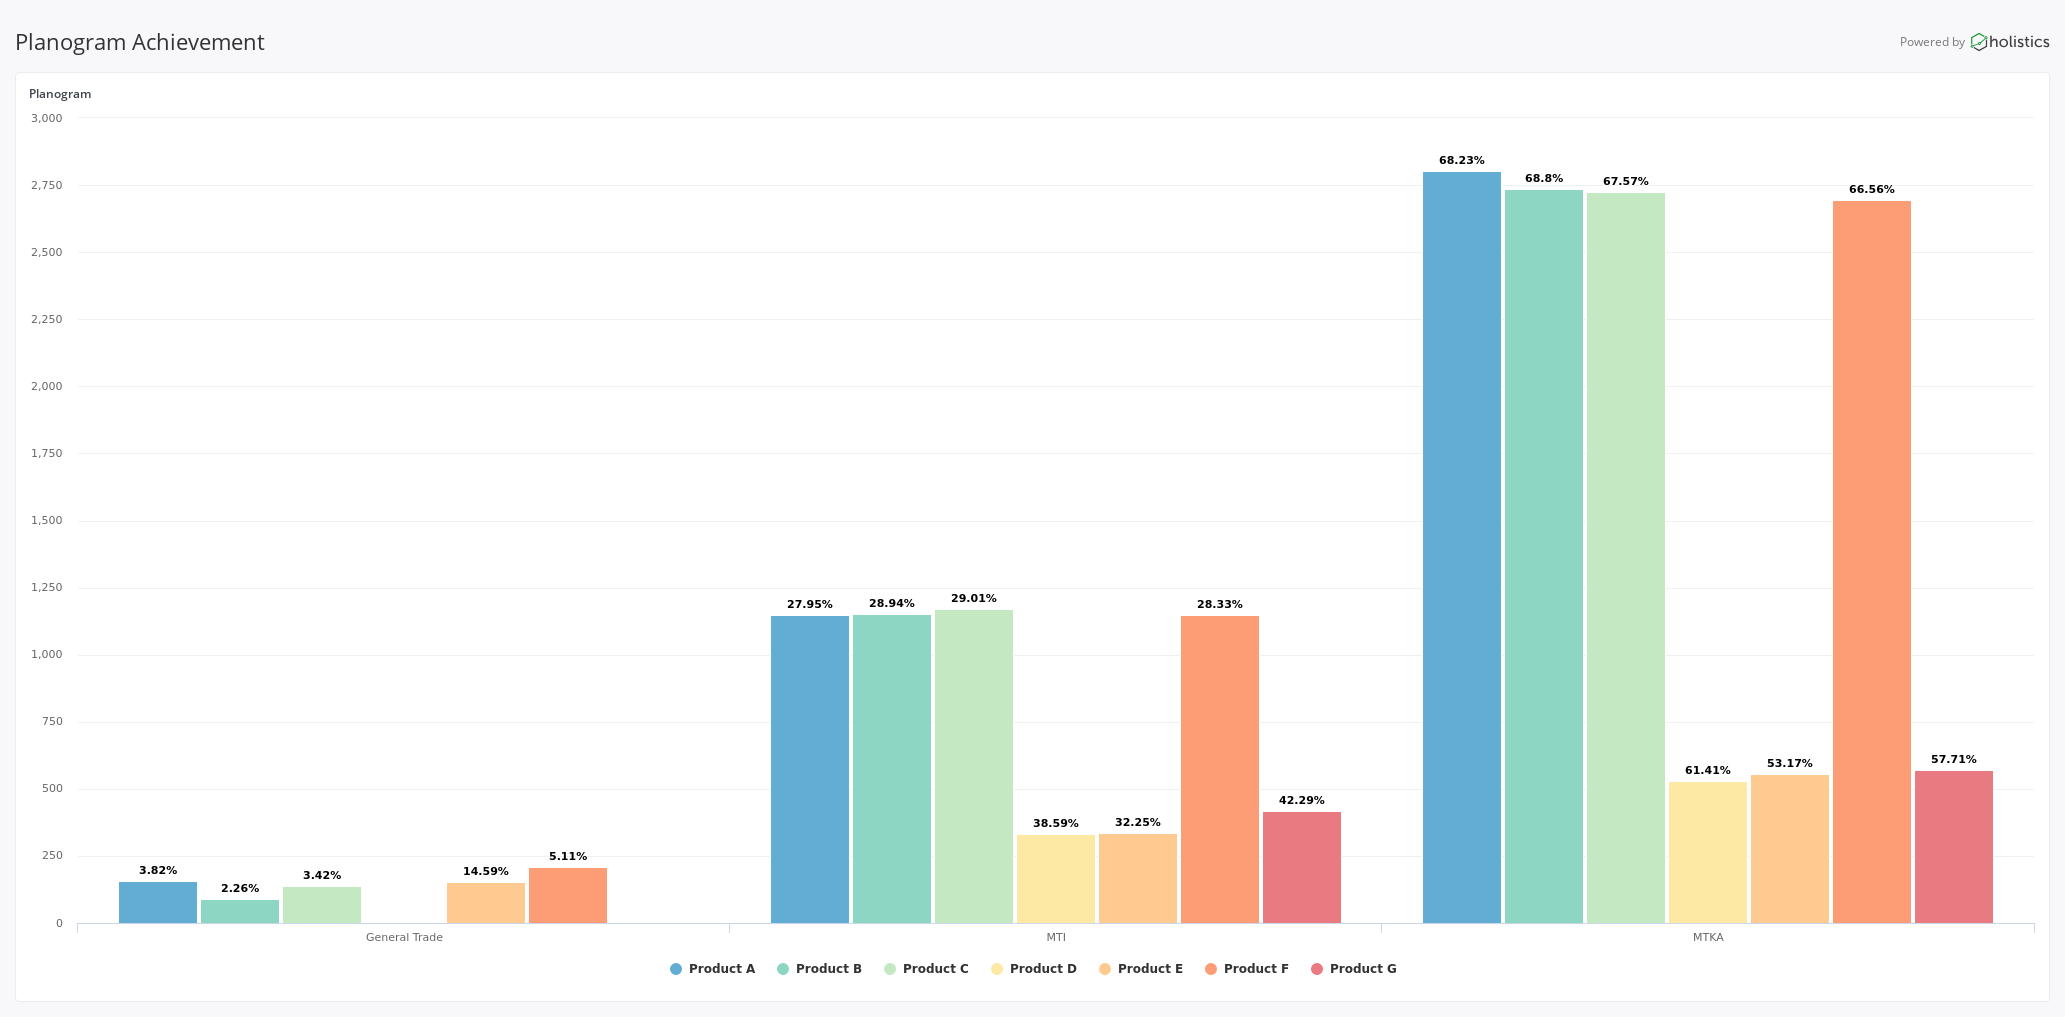
The diagram illustrates an example of a report in tracking planogram compliance. The visualization has been done based on the planogram distribution categories and product type categories. The percentage value is taken from the number of products in a complying status, by the total target in the Store category. For example, for one category held by Modern Trade Key Account (MTKA) stores spread throughout Indonesia, you will share that with several Merchandisers who will be in control. This will make a Merchandiser hold more than one for the number of stores within the same category. From the sample report, you will get 2 points of views, namely performance of your Merchandiser and the Performance of the Stores/Retailers Category.
Share of Shelf/Space (SOS)
Some call it Share of Space or Share of Shelf, it is basically a space allocation which is planned and implemented properly. The poor allocation leads to ineffectiveness in marketing strategies that lead to lost sales and high inventory storage costs. This can be explained by running out of stock for some items, or on the other hand, having excess stock for other items and so on.
To optimize this, marketers implement the SOS strategy by placing the stock forward, while allocated rack space is roughly comparable to market demand. For example, the share of space should be roughly the same as the share of sales. Although practically speaking, Merchandisers also play a role in the implementation of SOS.
In maintaining wider product range and considering the accommodations of the less-known brands, the well-known brands will tend to get fewer SOSs. Many store channels like minimarkets, supermarkets, and hypermarkets maintain at least two sides for most of their items.
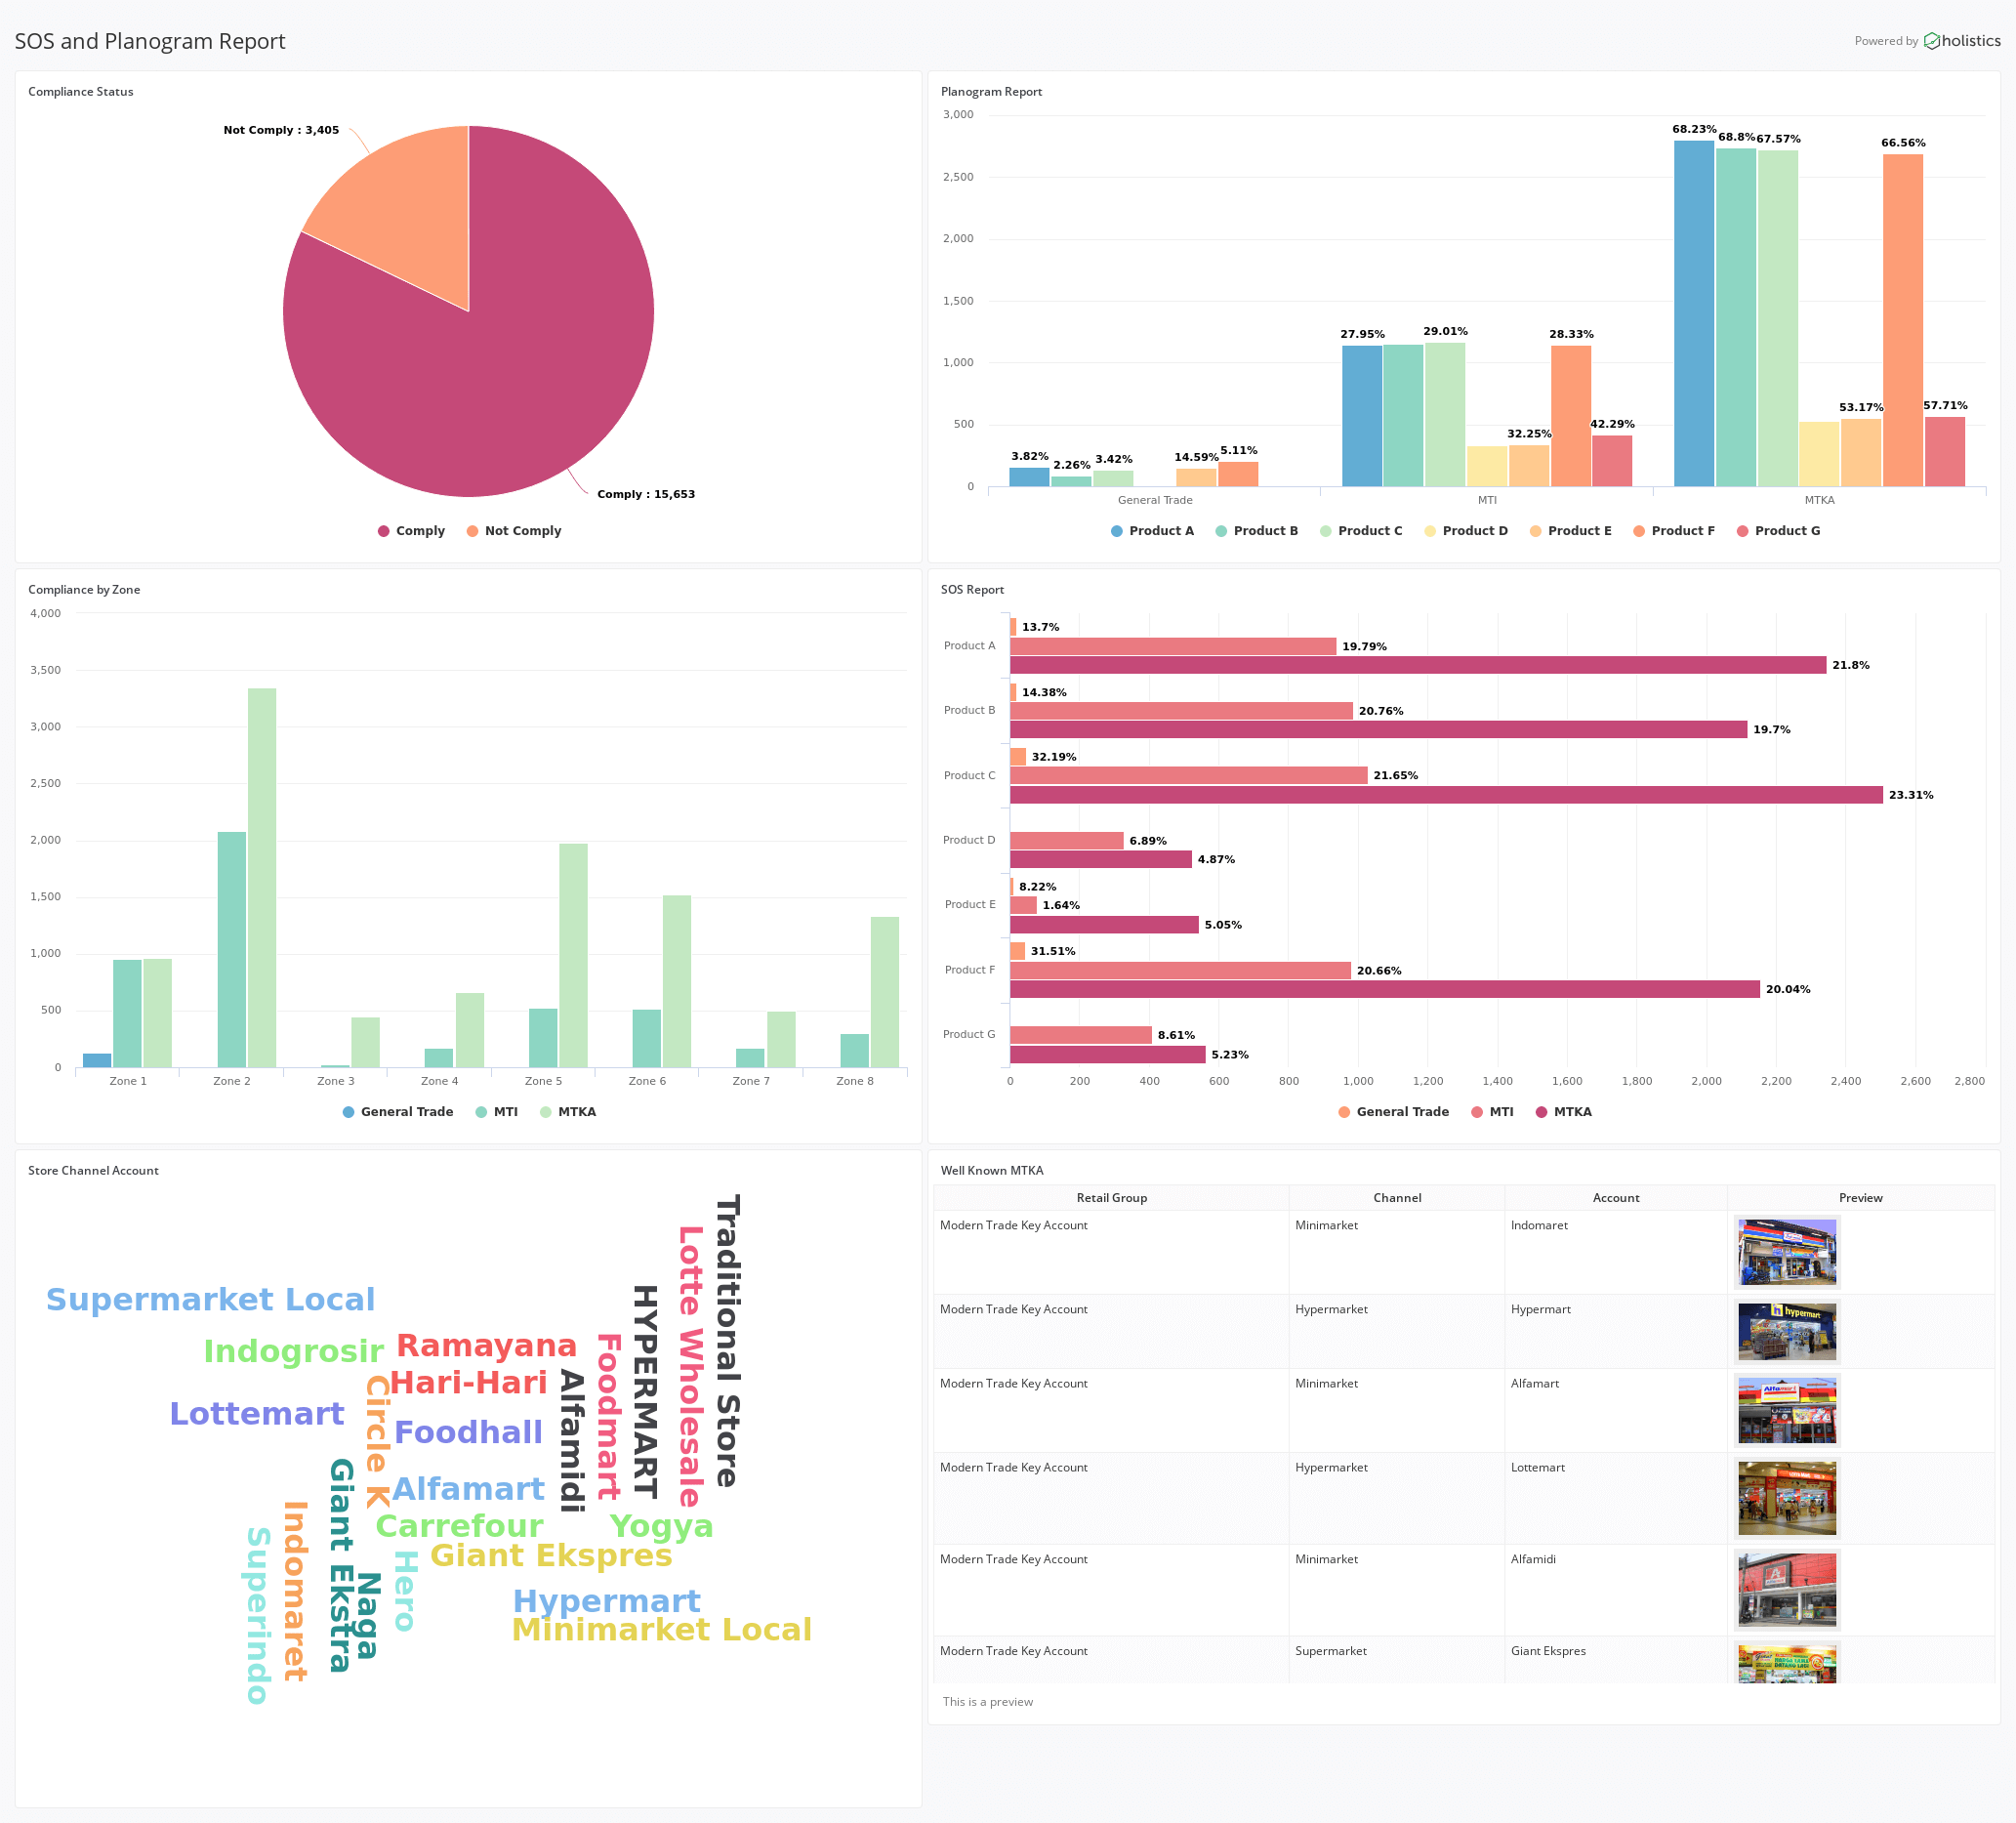
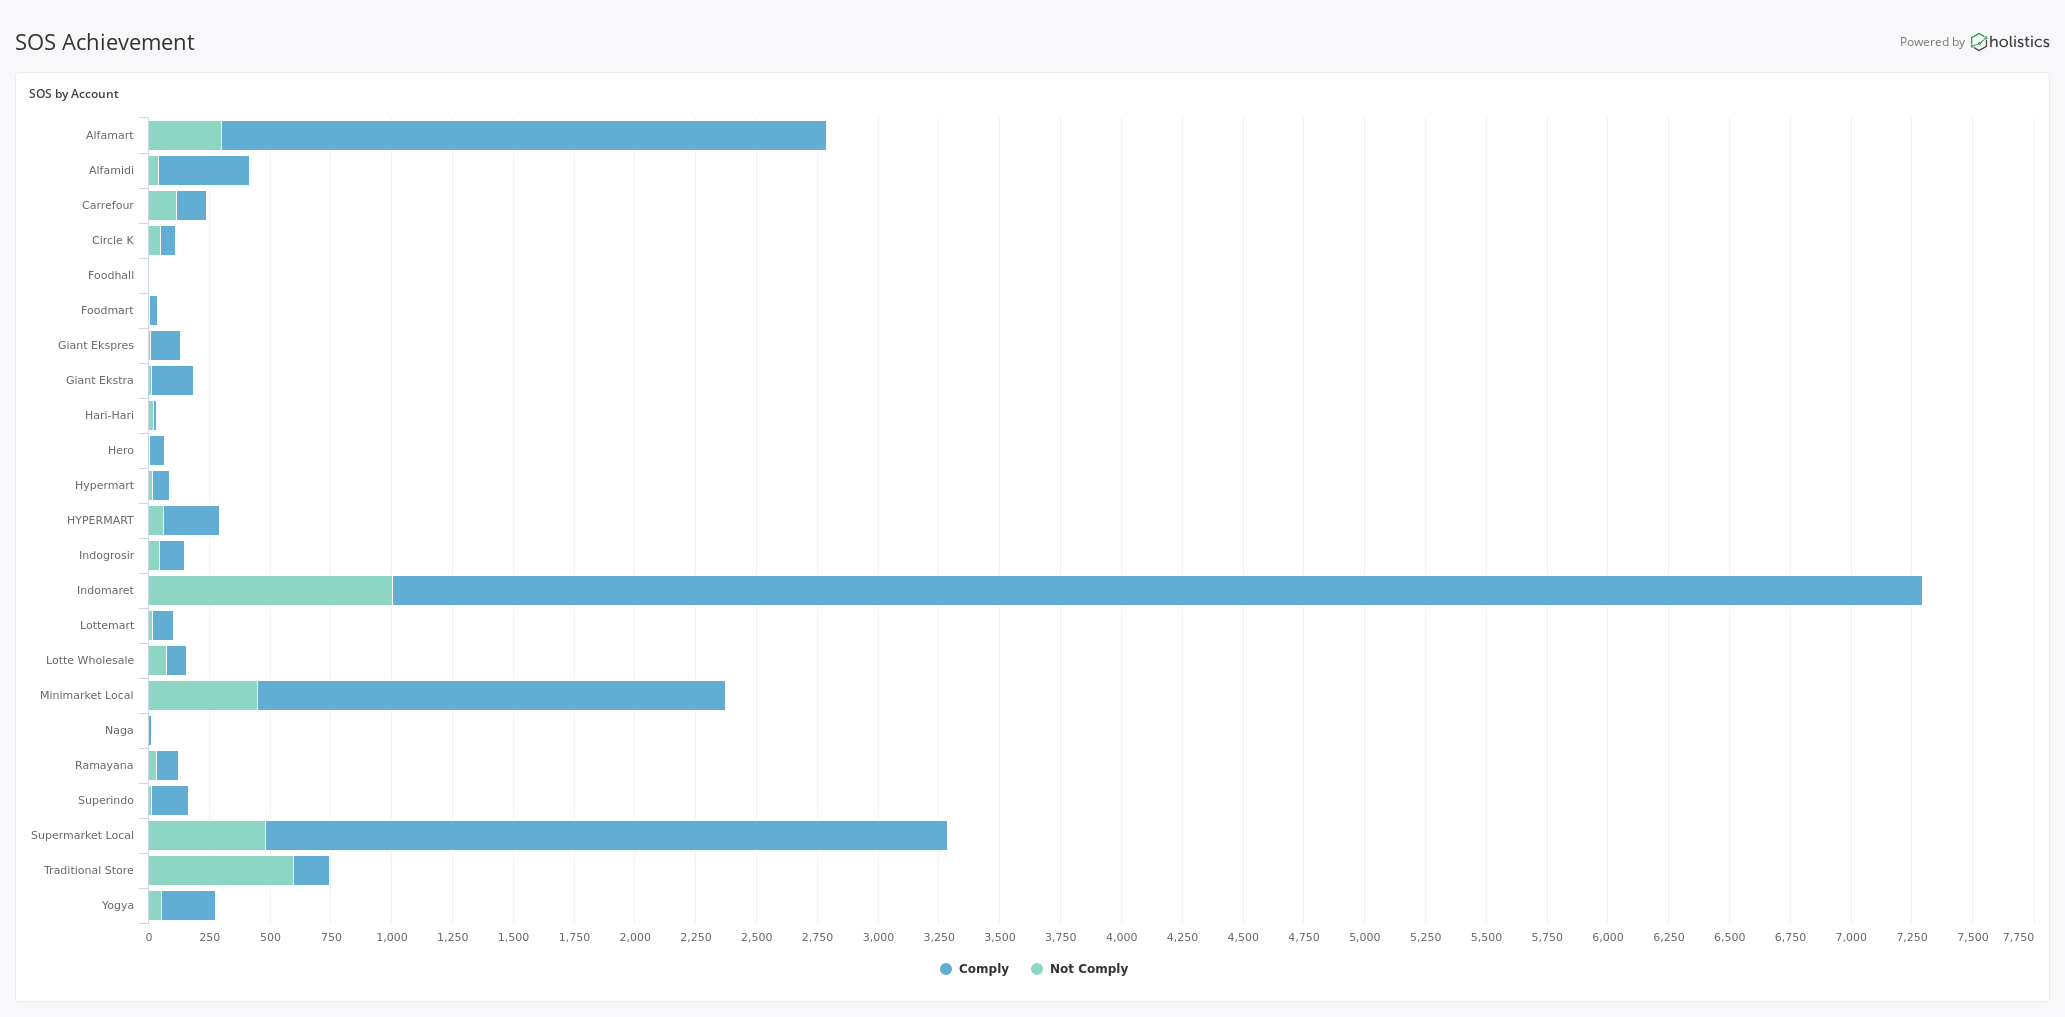
The following is an example of data visualization for reporting in maintaining SOS allocations. In the following report, we try to provide insight into the percentage in a compliance status that is reviewed from the channel in the store channel category in general.
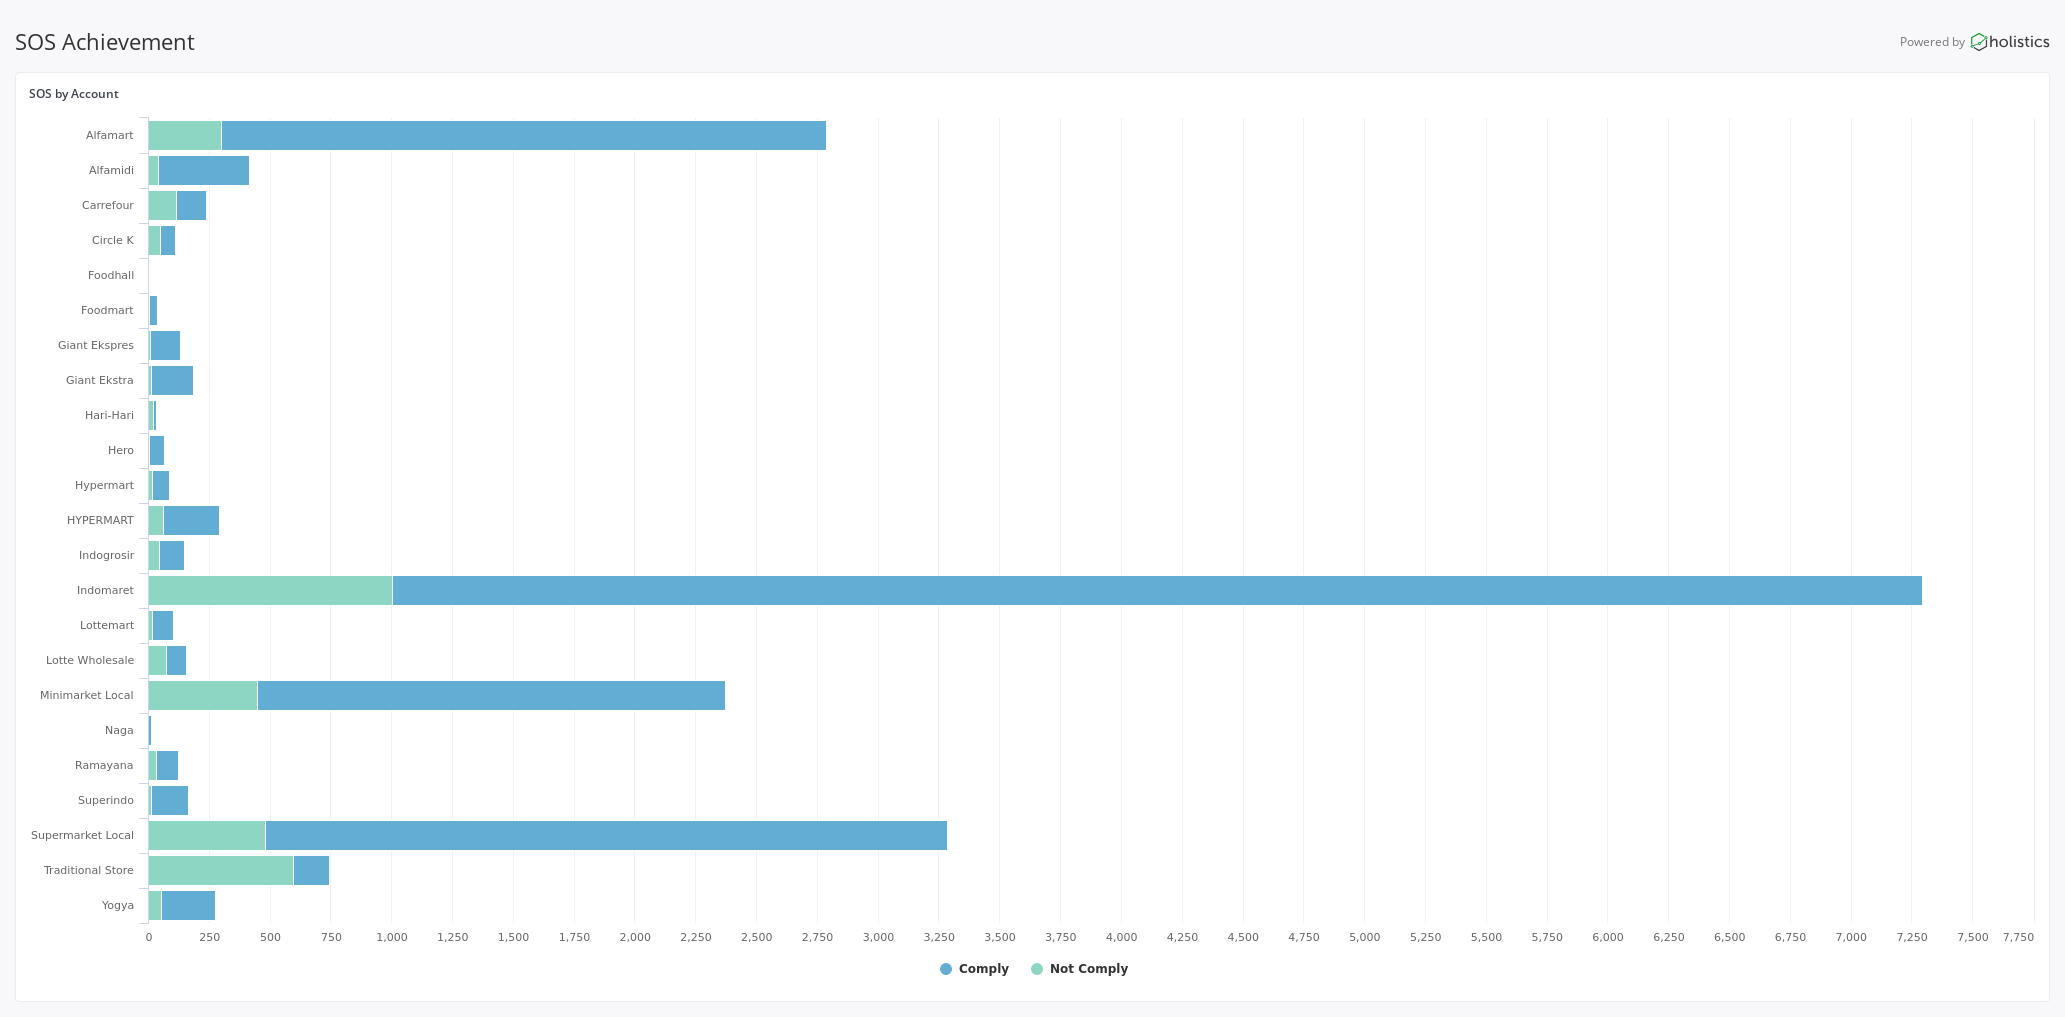
Successful implementation of planogram and SOS reporting is largely about achieving compliance by following a set of rules that will ensure that the right products are in the right place on the shelf. Moreover, it’s important that these products have been given the right amount of space. So in terms of brand-fighting with competitors on the same shelf, this should be a solid enough reason for you to not only push for compliance but to maintain it too.
The fact is that you will not have much time to carry out checks on the spot, another good way to ensure Planogram and SOS performance is to automate their proof of application. Your merchandiser will take a photo of the shelf inside the store and upload it to the data center, where it can be seen by the Head Office and the data management so that if something goes wrong, you can immediately contact the store. This effort ensures that both your Merchandiser and the store perform to their potential.
You can learn more about automation of Planogram and SOS reports here!
Bahasa Indonesia version begins here.
Di dalam dunia ritel atau FMCG, seorang Marketer tidak hanya dituntut untuk menguasai lapangan, namun juga melakukan laporan yang baik ke Kantor Pusat. Mengingat produk yang dipasarkan beragam dan dalam jumlah besar, dan area yang di handle sangat banyak maka laporan-laporan mengenai eksekusi lapangan turut menjadi concerns penting bagi pihak pengambil keputusan untuk melakukan strategi marketing kedepannya. Eksekusi lapangan yang baik menjadi omong kosong apabila laporan yang kita kirim tidak dapat memberikan insight yang baik di Head Office.
Planogram dan SOS merupakan contoh diantara beragam laporan yang harus kita kirim ke Head Office. Pada tulisan berikut, saya akan membagikan contoh laporan Planogram dan SOS.
Planogram
Planogram merupakan diagram visual yang memberikan detail penempatan dari setiap merchandise di dalam store. Planogram digunakan pada beberapa perusahaan ritel untuk menunjukkan penempatan produk di rak yang ada di toko. Penempatan produk merupakan bagian terpenting dalam industri ritel untuk memaksimalkan penjualan dan meminimalkan ruang yang terbuang. Selain itu, Planogram digunakan oleh produsen sebagai media untuk mengoptimalisasi tampilan dari barang dagangan mereka di toko.
Planogram dikerjakan oleh visual merchandiser atau tim marketing. Planogram juga berfungsi sebagai referensi ketika mencoba menganalisis kinerja ritel untuk mengidentifikasi salah satu penyebab potensial dalam penjualan yang lebih rendah. Pengaruh Planogram dalam peningkatkan nilai penjualan sangat bergantung oleh perencanaan merchandising yang baik.
Seringkali, kita sebagai seorang konsumen datang ke suatu toko untuk membeli satu item, alih alih kita termotivasi untuk membeli produk tambahan yang sebenarnya tidak kita rencanakan sebelumnya. Bahkan, kita tidak tahu apakah kita menginginkannya atau membutuhkannya. Hal tersebut merupakan imbas penataan merchandise yang dirancang dengan planogram yang tepat. Serupa, konsumen yang datang untuk membeli suatu produk spesifik dapat menentukan alternatif pilhan yang kemungkinan turut menjadi barang yang mereka beli.
Untuk meningkatkan revenue melalui Planogram, beberapa produsen melakukan analisa dengan menggabungkan data penjualan historis dengan planogram untuk mengidentifikasi item penjualan tinggi dan rendah serta penempatannya. Hal ini akan memberikan insight produk mana saja yang perlu anda pelihara, atau produk mana yang seharusnya anda pindahkan ke daerah dengan penjualan yang lebih tinggi, serta produk mana yang kemungkinan akan lebih laris untuk melakukan pergantian penempatan.
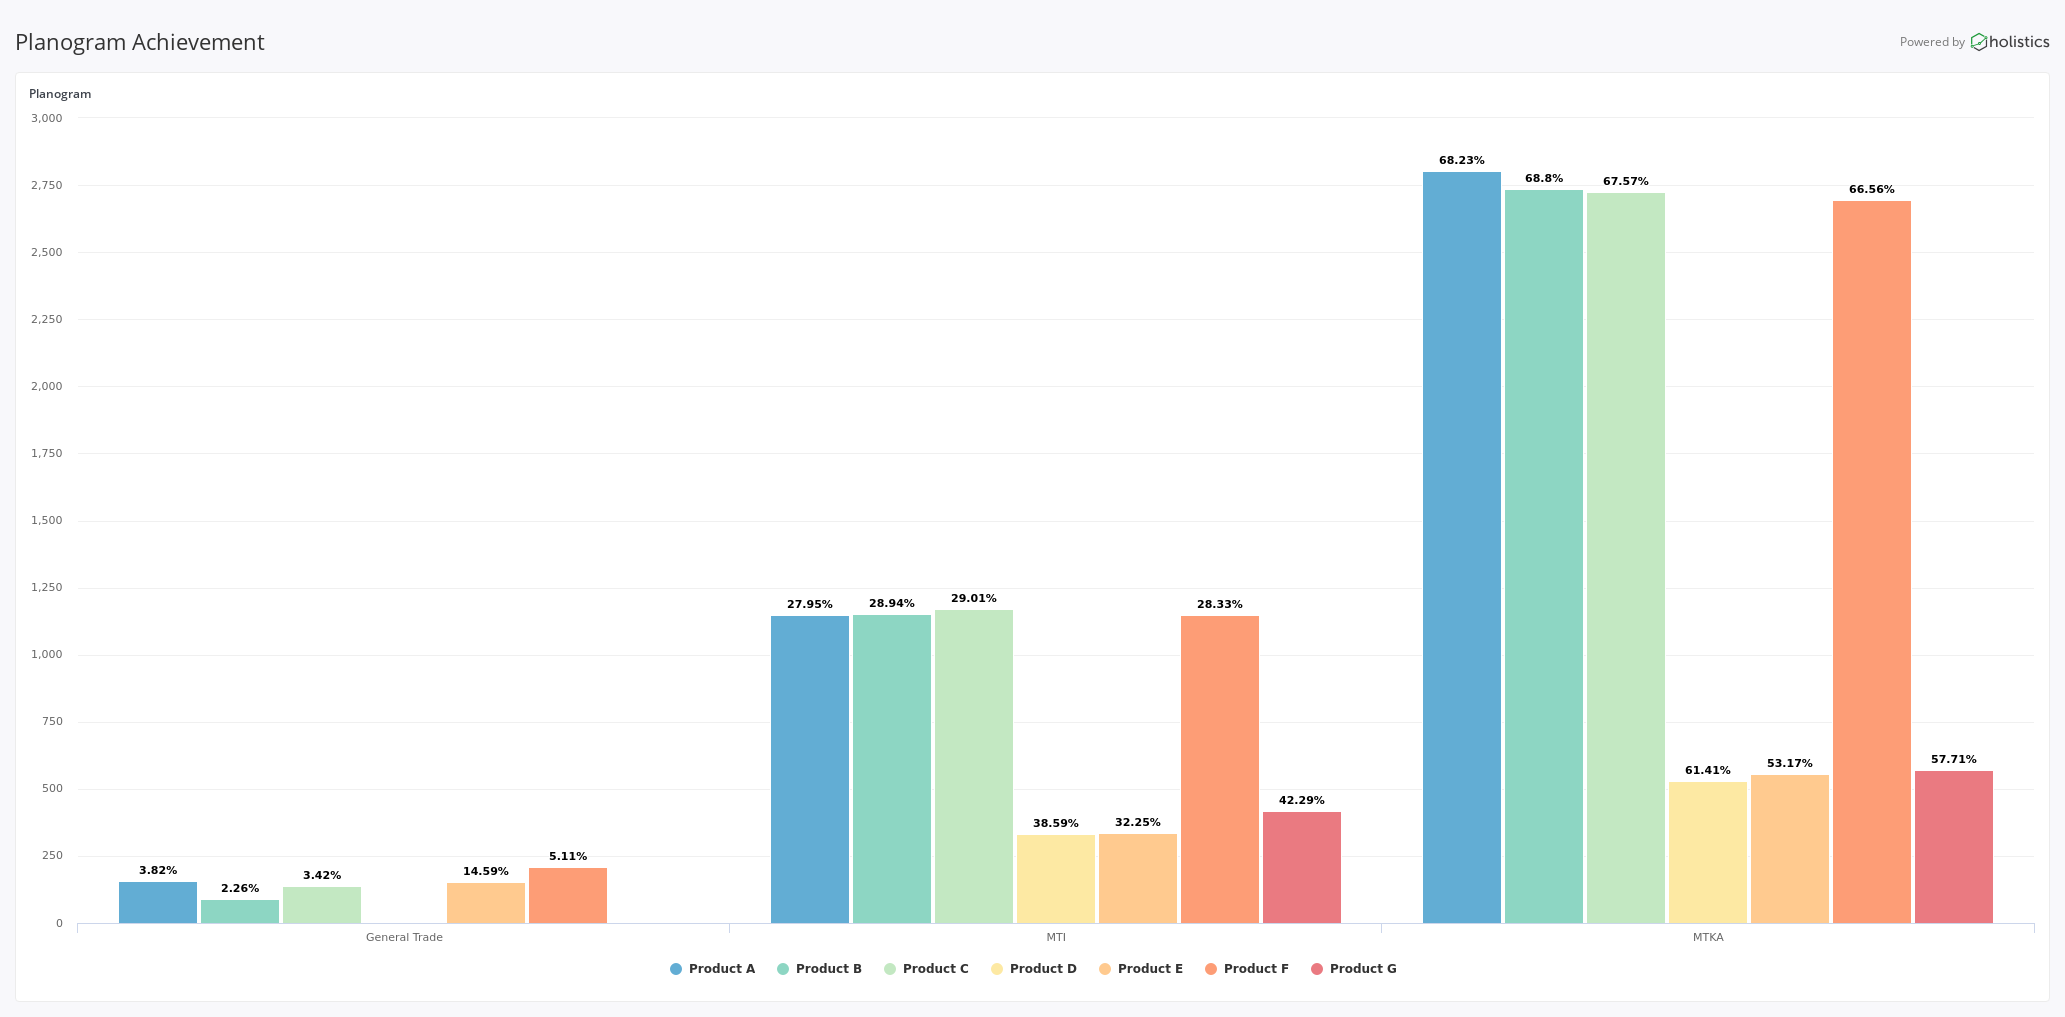
Diagram dibawah ini menggambarkan slaah satu contoh report dalam tracking planogram compliance. Dalam report dibawah ini, kami menyajikan visualisasi lokasi berdasarkan kategori persebaran planogram dan kategori jenis produk. Nilai prosentasi diambil dari banyaknya status Planogram yang comply dengan total target Planogram di kategori Toko. Sebagai contoh, dalam satu kategori toko Modern Trade Key Account yang tersebar di seluruh Indonesia anda akan membaginya dengan beberapa Merchandiser yang akan memegang kendali. Hal ini membuat satu orang Merchandiser memegang lebih dari satu untuk jumlah toko dengan kategori yang sama. Dari contoh report ini, anda akan mendapatkan 2 sisi insight yaitu dari sisi performa merchandiser dan performa toko/pengecer.
Share of Shelf/Space (SOS)
Share of Space atau beberapa menyebut Share of Shelf merupakan alokasi ruang dimana direncanakan dan diimplementasikan secara baik. Alokasi yang buruk akan menyebabkan ketidakefektifan dalam strategi pemasaran yang berujung pada penjualan yang hilang dan biaya penyimpanan inventaris yang tinggi. Misalnya kehabisan stok untuk beberapa item, disisi lain terdapat stok berlebih untuk item lainnya, dan sebaliknya.
Untuk mengoptimalkan hal tersebut, para marketer melakukan strategi SOS dengan menempatkan stok ke depan, ruang rak dialokasikan kira-kira sebanding dengan permintaan pasar. Sebagai contoh, pangsa ruang kira-kira sama dengan pangsa penjualan, walaupun dalam praktiknya pertimbangan merchandising juga turut berperan dalam eksekusi penerapan SOS.
Dalam mempertahankan jangkauan produk yang lebih luas dan mempertimbangkan akomodasi merek-merek dengan awarness minim, merek-merek yang lebih dikenal akan cenderung mendapatkan lebih sedikit SOS. Banyak minimarket, supermarket maupun hypermarket mempertahankan setidaknya dua sisi untuk sebagian besar item mereka.
Berikut adalah contoh visualisasi data untuk pelaporan dalam memaintain alokasi SOS. Dalam implementasinya, pihak produsen akan membagi persebaran jenis kategori toko dari Channel. Dalam rekomendasi report berikut, kami mencoba memberikan insight persentase status comply yang ditinjau dari channel secara general di kategori toko.
Faktanya anda tidak akan punya banyak waktu untuk melakukan pemeriksaan di tempat, cara lain yang bagus untuk memastikan kinerja planogram adalah mengotomatiskan bukti penerapannya. Merchandiser anda akan mengambil foto rak di dalam toko dan mengunggahnya ke pusat data, di mana dapat dilihat oleh Kantor Pusat dan pihak pengelola data sehingga apabila ada sesuatu yang salah, anda dapat segera menghubungi toko tersebut. Ini adalah upaya untuk memastikan bahwa baik Merchandiser anda maupun pihak toko berkinerja untuk potensi mereka.
You can learn more about automation of Planogram and SOS reports here!
What's happening in the BI world?
Join 30k+ people to get insights from BI practitioners around the globe. In your inbox. Every week. Learn more
No spam, ever. We respect your email privacy. Unsubscribe anytime.

