Metrics Deserve Better Composition Than What SQL Allows


Contents
If you have dabbled in the Software Engineering world, you may think this post is about the catchphrase: “Composition over Inheritance” and wondering how that could be relevant to building Metrics. But the composition in that phrase is a narrow view of the OOP (think Java) world and is not what composition is in the general sense.
In this post, I’ll go over what Composition is, why it matters, and especially, why it matters for building metrics.
A Primer on Composition
At its core, Composition is about the ability to arrange the logic such that:
- You can extract commonly used logic and reuse them in different places.
- You can put related logic close together, so you can change them at the same time.
- You can reason about a piece of logic by the surrounding code, without having to know everything about the system.
But the ability to do Composition is not free, not all programming languages have it. And even in languages that have it, the level of composition capabilities varies across different libraries/frameworks, and even within the same framework.
The ability to do Composition is so sought after that some have to change everything to enable them. One of the more famous examples of this is when Vue (the JS Framework), introduced their Composition API.
It’s a simple idea really, you don’t have to know Vue (or any JS) to understand what’s happening in the GIF.
What Composition API enabled is the ability to arrange pieces of code by their logical concern (their color) instead of by their actual type/class. Imagine if we could apply the same principle to metric logic that was scattered across multiple analytic layers.
Composition in SQL
As of now, I think you should have a basic understanding of Composition. I even argued that you’ve already used Composition in SQL when you’re using CTE to extract common transformation logic. But Composition in SQL stops there, the smallest unit of composition in SQL is a query, to make changes to a smaller part you must first convert it to a full SQL query. Take this query for example:
SELECT
  users.age_group
, COUNT(*) count_users
, AVG(users.age) avg_age
FROM users
GROUP BY 1
To change count_users to only count Female users we cannot apply a WHERE clause to the whole query since it would also affect avg_age. So we must first move count_users to another query, apply the WHERE clause, and then join back while having to deal with preserving aggregation on count_users.
WITH count_users_cte as (
	SELECT
		users.age_group
	, COUNT(*) count_users,
	FROM users
	WHERE users.gender = 'female'
	GROUP BY 1
)
SELECT
	users.age_group
, MAX(count_users_cte.count_users) count_users
, AVG(users.age) avg_age
FROM users
LEFT JOIN count_users_cte USING (age_group)
GROUP BY 1
What if we can put WHERE right inside count_users without touching any other parts like this?
SELECT
  users.age_group
, COUNT(*) FILTER (WHERE users.gender = 'female') count_users
, AVG(users.age) avg_age
FROM users
GROUP BY 1
Guess what, this is a real feature that dates back to the SQL 2003 standard, but since it’s optional and can be emulated with CASE WHEN, no databases other than PostgreSQL actually support this.
Though this seems like a contrived example, I wholeheartedly believe that this is where the SQL Standard stopped too soon before they struck gold. If they had continued and added more features in the same vein, SQL would’ve been a better language for defining metrics.
They could’ve added a GROUP () clause to express nested aggregation naturally.
SELECT
  users.age_group
, AVG(COUNT(*) GROUP (users.age)) avg_users_by_age
FROM users
GROUP BY 1
They could’ve added a local ROLLUP () clause to create Percentage of Total metric easily.
SELECT
  users.age_group
, COUNT(*) / COUNT(*) ROLLUP (users.age_group) pct_over_all_ages
FROM users
GROUP BY 1
There are more use cases, but obviously, the ship has sailed and I don’t think those will see the light of day anytime soon.
Composition in Metric Layer
I’ve talked about SQL but what about Metric Layer like Looker and dbt Metric? Do they offer better composition? The answer is yes, kinda.
Metric Layers enable the ability to pull aggregation logic out and put them in reusable metrics. So instead of writing SUM(orders.quantity * products.price) over and over in different places, you store it in a metric and reuse it elsewhere. However, I would argue that these Metric Layers only offer that specific type of composition.
Fundamentally, they still operate on this same model of composition from SQL.
The smallest unit of composition in SQL is a query, to make changes to a smaller part you must first convert it to a full SQL query.
Yes, I just quoted myself 🫣
Thus, they did not enable the actual composition of metric code by their logical concern.
Talk is cheap, let’s look at actual use cases where these Metric Layers fall short. Both dbt Metrics and Looker are very similar in concept, so I’ll use Looker (LookML) here since it’s more mature.
Use case: Metric with Nested Aggregation
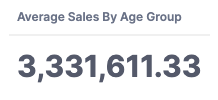
Let's say we want to calculate the Average Total Sales by Age Group.
For simplicity, let’s assume that we have a users table like this (id, age_group, sales_value, created_at)
view: users {
  sql_table_name: ecommerce.users ;;

  dimension: id
  dimension: age_group
  dimension_group: created_at

  measure: total_sales_value {
    type: sum
    sql: ${TABLE}.sales_value ;;
  }
}

explore: users {}
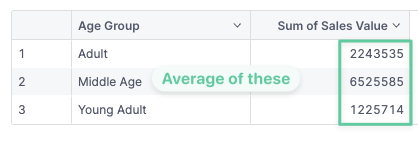
This metric can be considered correct when it satisfies the following criteria:
- When there’s no dimension it should return the overall average by age group
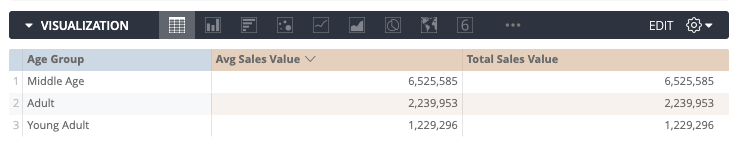
2. When using with Age Group Dimension it should return the number as is (because the average of 1 is itself).
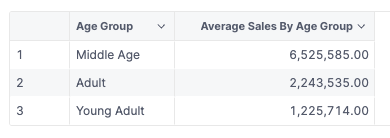
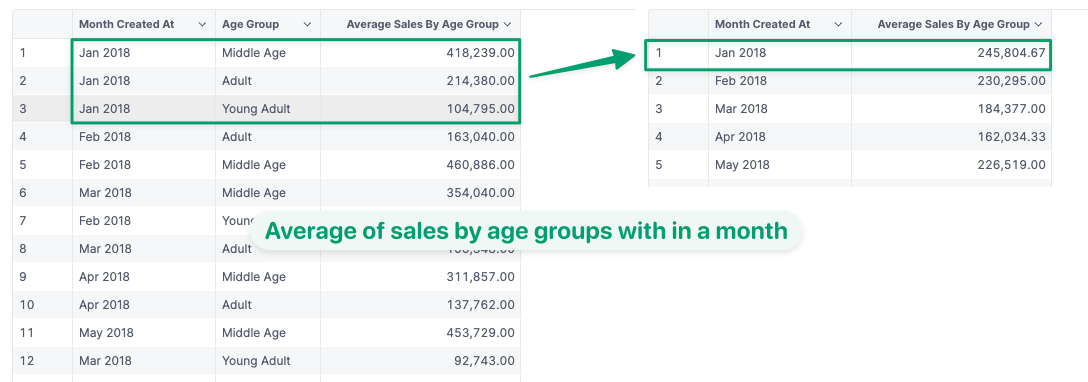
3. Using it with other groupings (dimension) would return the average sales by age groups within that grouping.
Attempt 1: Create an average measure over total_sales_value
As a first attempt, many people think that they can just add another measure that averages on total_sales_value. Something like this:
measure: avg_sales_value {
  type: avg
  sql: ${total_sales_value} ;;
}
But that wouldn’t work and in fact, prohibited by Looker.
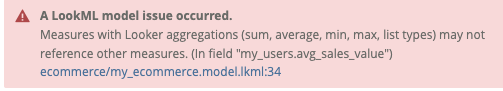
The reason is apparent if we inspect the SQL it would’ve generated.
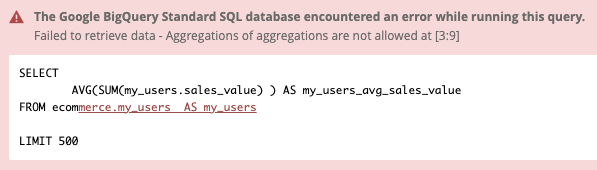
First, the grouping by Age Group is nowhere to be found (we did not know where to put it in the LookML anyway) and second it’s just not possible to put nested aggregation inside another aggregation in SQL.
In an ideal world, the simple solution could’ve worked but I guess we’re not living in that world (or maybe we are 😉).

Attempt 2: Custom Modeling Setup
Okay, that did not work. How does Looker recommend solving this use case? Finding the Looker doc on this specific use case you’ll find this article from them:
So the steps are:
- Write another SQL query to calculate the Total Sales Value by Age Group
- Store that as a view
- Create our “Average Total Sales by Age Group” measure in that view
- Join that view back to our
usersview
Following that we might arrive at this final solution
view: sales_value_by_age_groups {
  derived_table: {
    sql:
      SELECT
          users.age_group,
          COALESCE(SUM(sales_value), 0) AS total_sales_value
      FROM ecommerce.users
      GROUP BY 1
    ;;
  }

  dimension: age_group
  dimension: total_sales_value

  measure: avg_sales_value {
    type: average
    sql: ${total_sales_value} ;;
  }
}

explore: users {
  join: sales_value_by_age_groups {
    relationship: many_to_one
    type: left_outer
    foreign_key: age_group
  }
}
Yep, this is just like the example I gave with SQL’s WHERE clause. To give the measure a different grouping, I must first turn it into a full SQL query.
But, does it work?
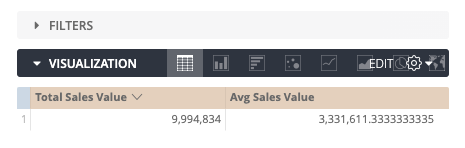
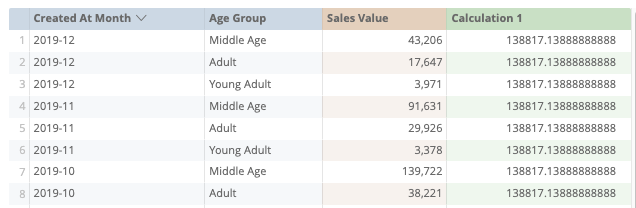
A quick check with the “Month” dimension gives us a weird result. Surely, the value of each month is not the same right? And how can the average be bigger than the sales value itself?
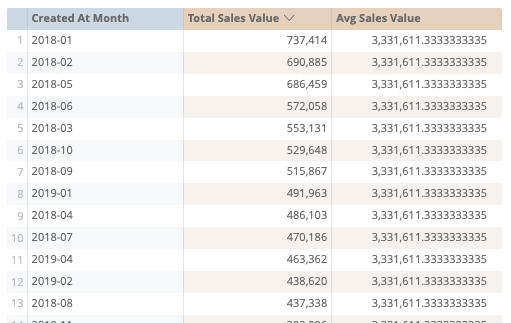
Checking the SQL it’s apparent that this doesn’t work because we’re joining only on Age Group and the aggregation grouping inside the view doesn’t have grouping on Created At Month. Thus, the average will always equal the average of all time.
WITH sales_value_by_age_groups AS (
  SELECT
    users.age_group,
    COALESCE(SUM(sales_value), 0) AS total_sales_value
  FROM ecommerce.users
  GROUP BY 1
)
SELECT
  ... AS users_created_at_month,
  ... AS sales_value_by_age_groups_avg_sales_value
LEFT JOIN sales_value_by_age_groups
ON users.age_group = sales_value_by_age_groups.age_group
GROUP BY 1
By now, maybe you’re thinking “You’re joining it wrong, just add created_at into that view”. But by doing that, the sum will be calculated at the created_at grain you chose in the view, thus returning the wrong result for other grains.
For example, if you put the month grain there and select the year grain in the explore then the average would be 12 times smaller than the correct result.
To give credit where it’s due, this setup could work, but it’s a hassle for both setting it up and for the end-users to use. It forces you to create tightly coupled logic that only works with a specific set of dimensions. For end-users to use this, they must remember which set of dimensions to use with which measure and the result is wrong in non-obvious ways when they get that wrong.
Looker is not alone in this, you can find this guide from Cube that suffers the same problems, and I’m sure they are not the only ones. These problems are not isolated to just this use case either. In fact, I can give you 5+ examples from the top of my head, but can’t keep this article short and to the point. You can see some of them here and compare them to our solution:
Introducing AQL
Let’s not beat around the bush and pretend that we are not trying to sell you something here. We at Holistics have gone through all of the phases above to support use cases like these, so we know there’s a real need for it. What keeps boggling our minds, is the question: “Why can’t it be simple like the first attempt?”
Why is it that we need so much modeling to do something that’s supposed to be simple?
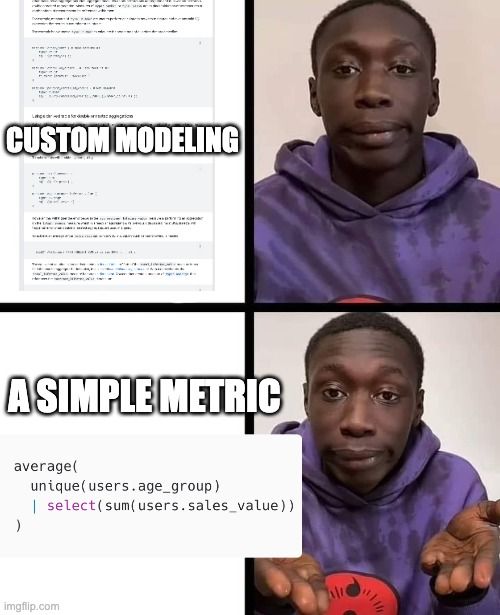
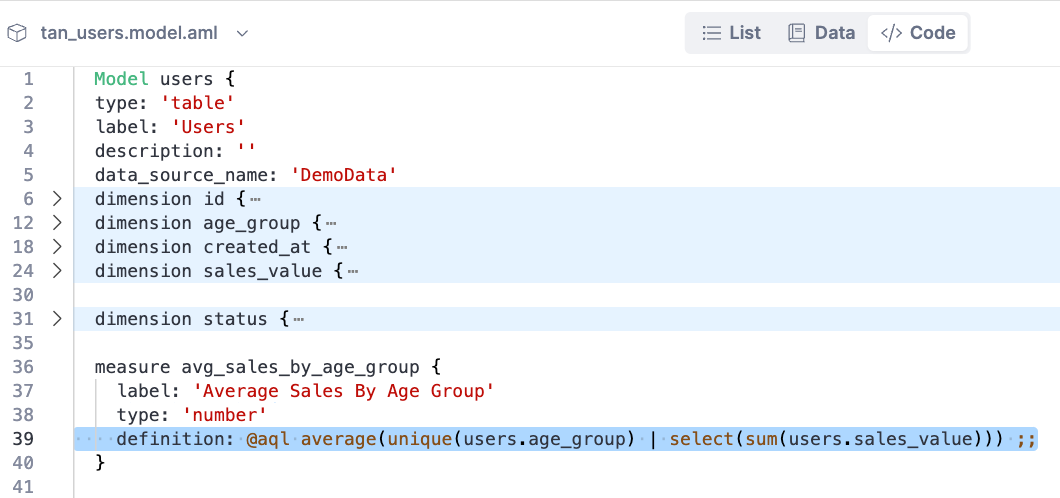
That’s a large part of why we built AQL, a language that enables the composition of metric as the smallest unit.
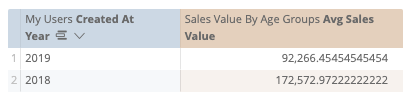
I’ve shown you the result in AQL as the criteria. Here is the whole code needed for “Average Total Sales by Age Group”
Let’s see it in action.
Outro
Just to be clear, while AQL presents a new approach to handling complex metric composition, we're not suggesting it should replace SQL. SQL is the lingua franca of data analysis. It's still going to play a key role in the field whether we want it or not. Transforming and cleaning data is still best done with SQL or other languages that compete in that space (PRQL, Kusto, etc).
Our objective instead was to offer what SQL was missing: “A language that was designed with metric as a first-class citizen”.
What's happening in the BI world?
Join 30k+ people to get insights from BI practitioners around the globe. In your inbox. Every week. Learn more
No spam, ever. We respect your email privacy. Unsubscribe anytime.
