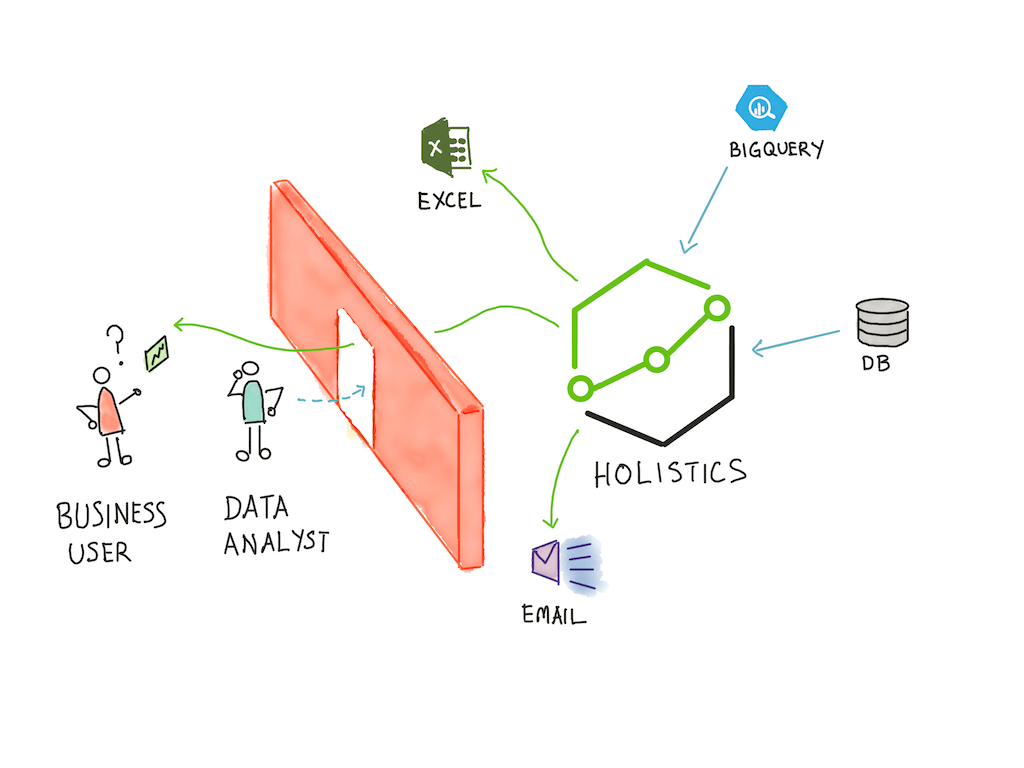
Using Holistics
Data at Work
Custom SQL with Tableau? No Problems
Using custom SQL for your Tableau workbooks is usually a really bad idea. Here's how using Holistics with Tableau makes this a non-problem.

Using custom SQL for your Tableau workbooks is usually a really bad idea. Here's how using Holistics with Tableau makes this a non-problem.

Tableau may be the best data visualizer on the planet today, but Holistics makes Tableau more awesome, by making data prep trivially easy.
We live in the age of apps — and therefore, the age of data. This presents us with an unparalleled opportunity for data analytics, as well as an unparalleled challenge! Here's how to not get left behind.


Occasionally, we get asked “when should we consider getting a data warehouse?”. The answer is a lot simpler than you think!
Looker is among the most popular data analytics platforms on the market today. It has a unique approach to data modeling that …
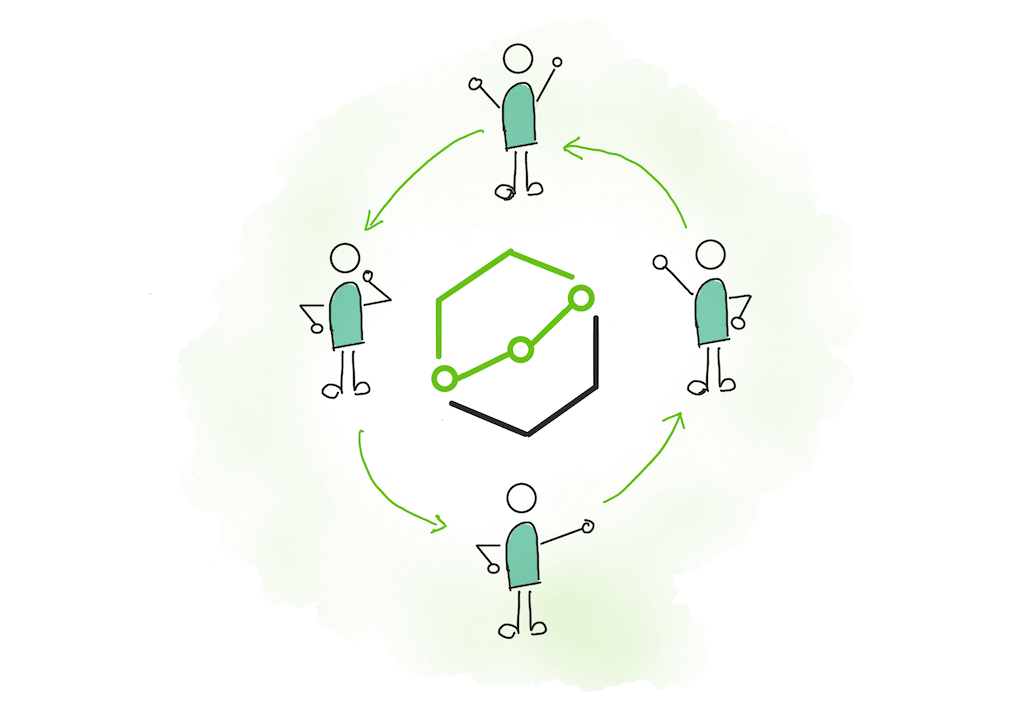
Holistics's data modeling layer allows data teams to radically increase their productivity. No repeated queries. Self-serve reports and dashboards. Here's how it works.
The new version of Holistics is designed from the ground up to increase the productivity of your data team. Here's how that works.


One of the most useful ideas from the 2013 book Lean Analytics is the notion of 'lines in the sand' — concrete values that tell you how well you're doing on a metric that matters.
In Part 2 of our summary of Lean Analytics, we cover the five stages of a data driven startup, and the book's tips for creating a data-driven culture in your company.