Tableau Embedded Analytics: Pros, Cons and Alternatives (2026)
In this article, we'll analyze Tableau Embedded Analytics, its pros, cons, pricing and 5 alternatives.


Contents
Choosing the right embedded analytics tool can feel like navigating a minefield.
You need something powerful yet flexible, secure yet user-friendly, and most importantly, something that won’t require a massive time investment to integrate. With so many options on the market, how do you make the right choice?
Tableau Embedded Analytics is often the go-to option for many businesses, thanks to its reputation in the business intelligence world. It’s known for delivering sophisticated analytics right where your users need them—inside your applications, websites, or portals.
But is Tableau really the best choice for your embedded analytics needs, or is it just the most popular one?
In this article, we’ll break down the key features, benefits, and potential drawbacks of Tableau Embedded Analytics. We’ll explore whether it truly lives up to the hype and how it stacks up against other embedded BI software on the market. Whether you're a product manager, a CTO, or a business owner, this guide will help you decide if Tableau is the right fit for your embedded analytics strategy.
Let’s dig in and find out if Tableau Embedded Analytics is the powerhouse it claims to be or if there’s another solution that might better meet your needs.
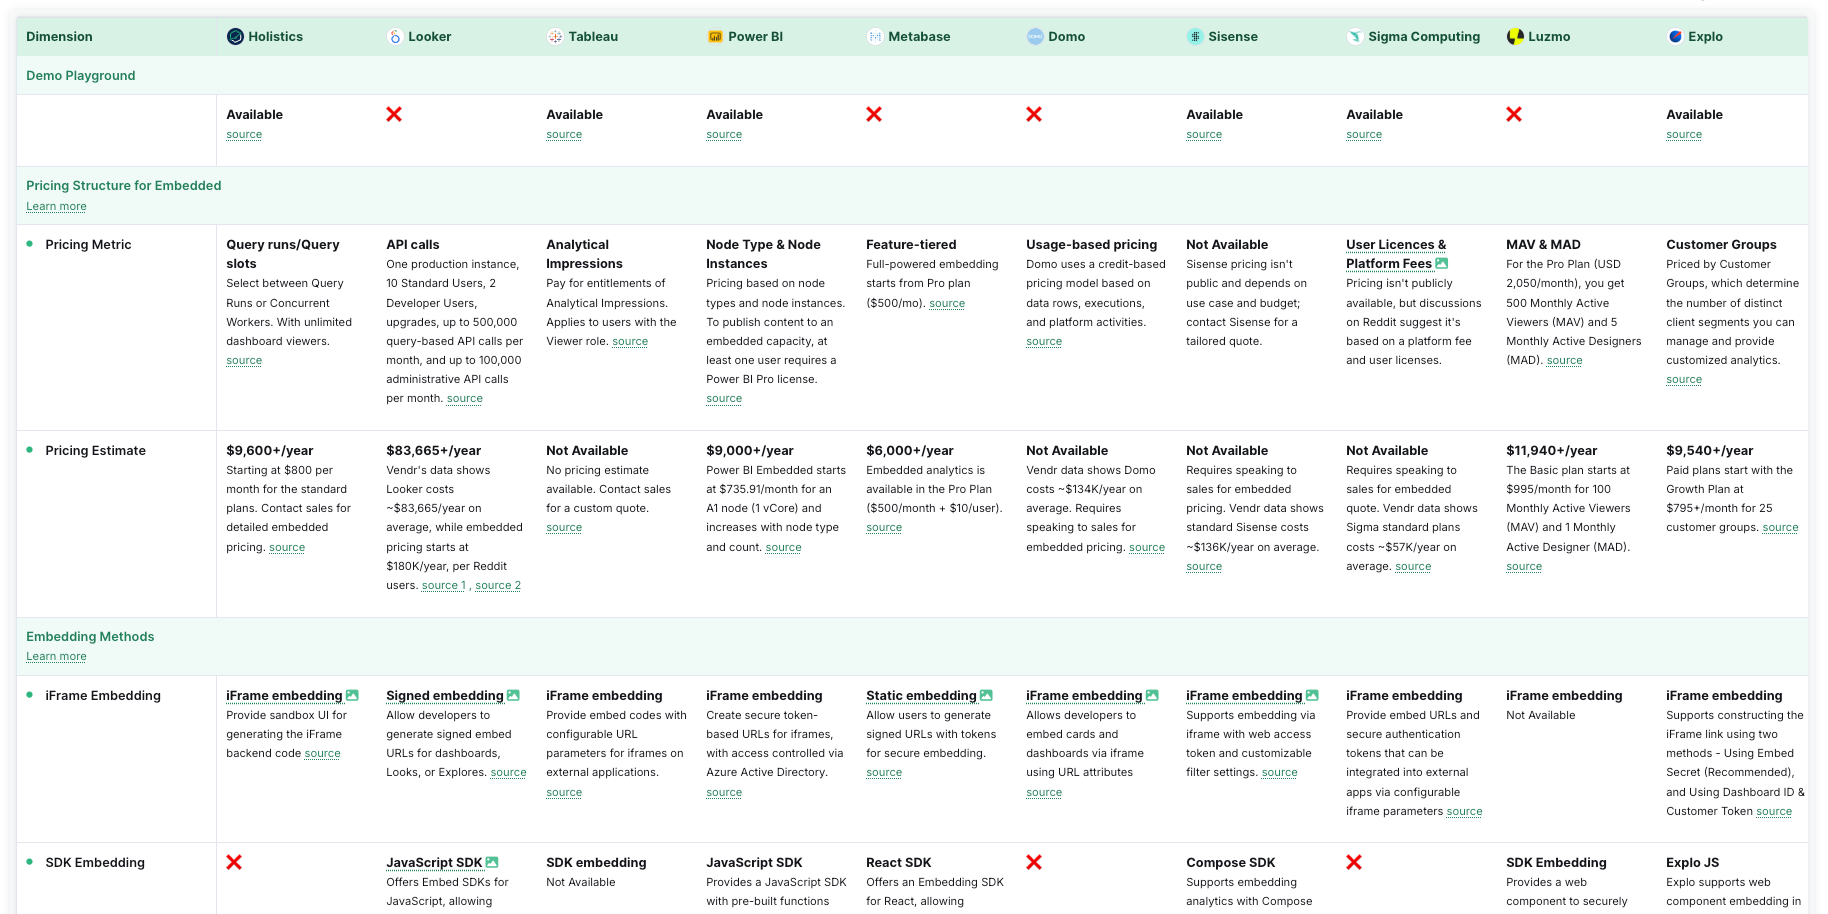
If you're searching for an embedded analytics tool, check out our fact-based comparison matrix. Our analysts provide a detailed, feature-by-feature evaluation of the best solution, complete with links to official documentation. We prioritize facts over opinions, ensuring no biased recommendations.
Use Cases for Tableau Embedded Analytics
Tableau Embedded Analytics offers a versatile solution that can be tailored to fit a variety of business needs. Here are some key use cases:
1. Embedding in Simple Web Pages
For businesses looking to share data visualizations with a broad audience, embedding Tableau dashboards into simple web pages is a straightforward solution.
By using a simple HTML embed code generated by Tableau, you can easily integrate interactive visualizations that update automatically as the underlying data changes. This approach is commonly used in blogs, news sites, and internal knowledge bases to make data-driven insights accessible to a wide range of users.
2. Custom Web Portals
Custom web portals allow organizations to open access to critical business intelligence.
By embedding Tableau dashboards within these portals, businesses can create a unified interface that integrates seamlessly with their existing workflows. This setup is particularly useful for internal analytics portals or customer-facing dashboards, providing users with a consistent and tailored experience. Tableau’s JavaScript API enables full control over the embedded analytics, allowing for features like preset dashboard filtering, custom interface elements, and integration with other systems.
3. Third-Party Applications
Integrating Tableau into third-party applications like Salesforce or SharePoint ensures that users have access to relevant analytics without disrupting their existing workflows.
For example, embedding Tableau dashboards directly into Salesforce allows sales teams to access critical data insights within the same interface they use daily, enhancing decision-making and productivity. Similarly, embedding in SharePoint consolidates important documents and data, making it easier for teams to find and utilize the information they need.
4. Customer-Facing Products
Companies have integrated Tableau into their SaaS products, leveraging its capabilities to deliver custom reporting features without the need for extensive in-house development. This allows businesses to focus on their core product features while still offering advanced analytics to their customers.
Key Features of Tableau Embedded Analytics
Tableau Embedded Analytics offers a range of features designed to integrate seamlessly into your applications, providing robust analytical capabilities. Here’s a concise overview of its key features:
1. APIs and Developer Tools
Tableau provides a comprehensive set of APIs, including REST API, JavaScript API, and Embedding API v3, to facilitate the embedding of analytics into various applications. These tools allow for deep integration, enabling custom functionality and automation, such as managing user permissions and refreshing data.
For more details, check out Tableau docs here.
2. Customization and Scalability
Customization is central to Tableau’s approach, allowing businesses to tailor the embedded dashboards to fit their brand and user interface. The platform is also highly scalable, supporting both small deployments and enterprise-level implementations without sacrificing performance.
3. Security and Compliance
Tableau emphasizes data security, offering features like secure single sign-on (SSO), role-based access control, and encryption. These ensure that data is protected at all stages and that the solution complies with industry standards and regulations.
4. Integration Capabilities
Tableau supports integration with a wide range of data sources, including SQL databases and cloud storage services, making it adaptable to various environments. This flexibility ensures that businesses can consolidate data from different systems into a unified analytics platform.
5. Flexible, Advanced Visualization
Tableau is known for its advanced visualization capabilities, allowing users to create interactive, visually appealing dashboards that can be customized to meet specific needs. These visualizations are designed to be both informative and intuitive, enhancing the user experience.
Limitations of Tableau Embedded Analytics
1. Cost Considerations
One of the most significant challenges with Tableau Embedded Analytics is the cost, especially for large-scale implementations.
When deploying Tableau for external-facing embedded analytics with hundreds of viewers, the traditional licensing model can become prohibitively expensive. However, Tableau does offer a consumption-based pricing model based on "impressions," which can be more cost-effective for users who interact with dashboards infrequently.
2. Customization and Integration Complexity
Tableau provides a range of APIs and tools for embedding analytics, but achieving deep customization or integration can be complex and resource-intensive.
For organizations without dedicated development teams, customizing Tableau to fit specific needs may require significant effort. Additionally, integrating Tableau with legacy systems or handling large, non-standard data sources can present challenges that may necessitate custom development, increasing both the time and cost of deployment.
3. Performance Issues with Large Data Sets
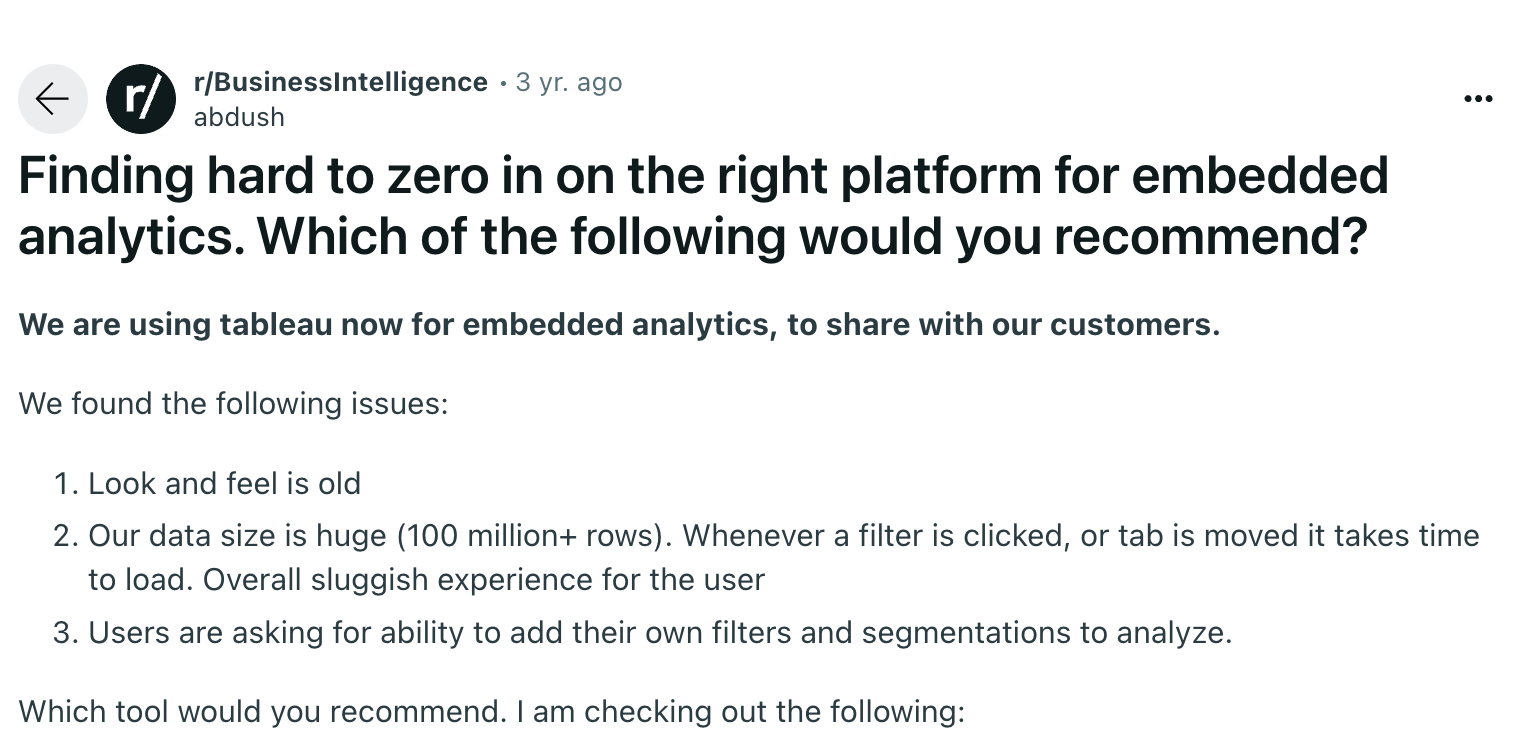
Users have reported that dashboards processing data with over 100 million rows can exhibit sluggish behavior, particularly when applying filters or navigating between tabs.
This can lead to a suboptimal user experience, especially in environments where real-time data interaction is critical. While Tableau offers various optimization techniques, they may not fully address performance issues in all scenarios, particularly for data-heavy applications.
4. Lack of Self-Service Report Building
Another limitation identified by users is the lack of robust self-service report-building capabilities: "Users are asking for ability to add their own filers and segmentations to analyze".
In environments where end-users want to create their own reports, filters, or segmentations within embedded dashboards, Tableau’s current offerings may fall short. This limitation can lead to frustration, particularly for users accustomed to more flexible, self-service BI tools.
5 Alternatives To Tableau Embedded Analytics
As I said previously, you're exploring the world of embedded analytics, Tableau is just one fish in a very big pond.
Below, we dive into five alternatives—each with its own quirks, strengths, and drawbacks. Let’s see how they stack up against Tableau in key areas like performance, ease of use, pricing, and customizability.
1. Holistics Embedded Analytics
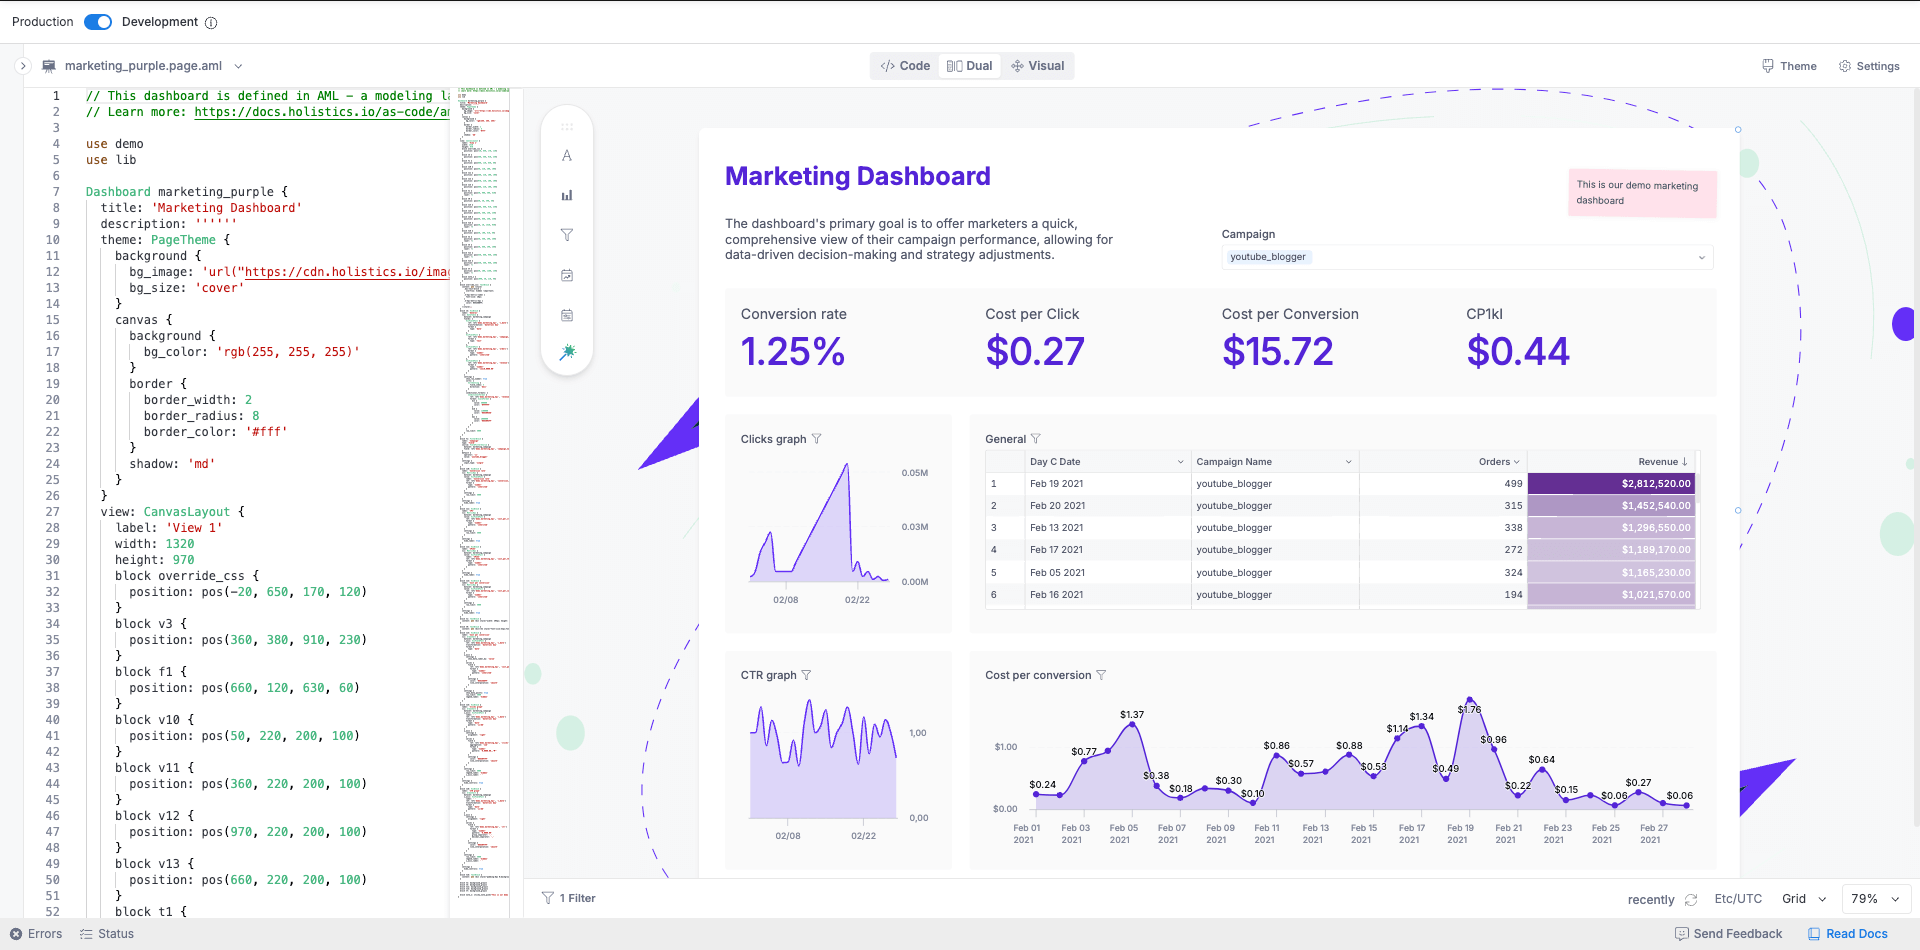
Holistics Embedded is a self-service embedded analytics solution (and a part of Holistics BI platform), designed for SaaS teams that need fast, flexible, and deeply customizable customer-facing analytics. It stands out as a powerful alternative to Tableau Embedded Analytics for teams that want governed metrics and developer-friendly workflows, without sacrificing the visual polish and interactivity Tableau is known for.
With Holistics, everyone can embed dashboards in just a few lines of code.
Key features include:
- Robust customization: Custom visualizations, themes, styling, and CSS let product teams create embedded dashboards that blend more naturally into your app than Tableau’s rigid workbook styling.
- Self-service embedded analytics: Embedded users can drill down, view underlying data, filter, and explore insights intuitively. Embedded users can also build reports themselves using a drag-and-drop interface or an AI chat interface.
- Governed semantic layer: Developers can define, extend, and reuse metrics across the organization to ensure consistency and accuracy everywhere.
- Analytics As Code: Git-native workflows, CI/CD, and testing environments give teams full version control and safe, scalable deployments.
- Reusable components: Developers can parameterize widgets, filters, and dashboards to reuse them across customer tenants and product modules, reducing the repetitive work that often comes with managing Tableau workbooks at scale.
- Enterprise-grade Security: Protect your customers’ data with robust security controls, including row-level and role-based access, audit logs, usage monitoring, and compliance with SOC 2, HIPAA, and GDPR standards.
Pricing
- Usage-based pricing. Unlimited viewers are available for all plans.
- Starts from 800$/month.
Holistics Embedded vs Tableau Embedded
- Performance: Handles large datasets but may not match Tableau’s prowess with complex visualizations.
- Ease of Use: More intuitive and user-friendly than Tableau, with a gentler learning curve. Non-technical users can easily explore data using drill and filters.
- Pricing: More affordable and straightforward than Tableau, allowing for easy scale-up.
- Customizability: Less customizable than Tableau in terms of advanced visualizations, but excels in data modeling and transformation.
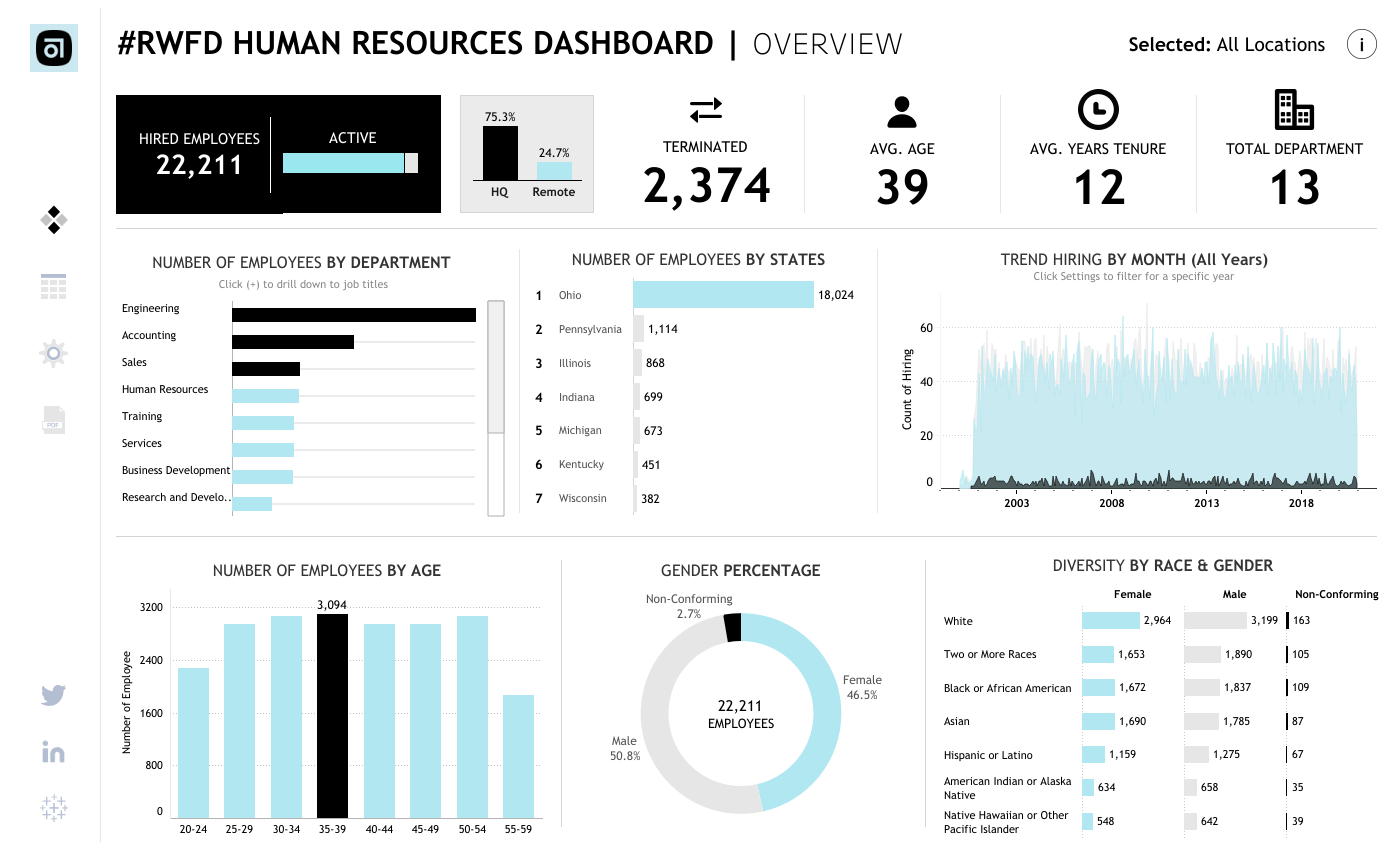
(Example of Holistics dashboard. For more details, check out our playground here.)
2. Embeddable
Key Embedded Analytics Features
- Feels native in your app: charts are fully customisable and extensible in code. Secure embeds that render as part of your application, iframe-free.
- Highly Performant at Scale: multi-layer caching and a high-performance data service, dashboards load in milliseconds and scale effortlessly.
- Excellent developer experience: SDKs, APIs, Git-based version control, and CI/CD compatibility, enabling teams to manage dashboards just like any other part of the application.
- Self-Serve & advanced interactivity: drilldowns, filters, localization, exports, and “Custom Canvas”: self-serve analytics experience that lets end-users build custom dashboards.
- Enterprise-Grade Security: row-level security, SOC2 compliance, and tenant-level data isolation, making it suitable for regulated industries and enterprise-grade SaaS applications.
Pricing
- Fixed-price, unlimited subscription model with no per-user or per-dashboard fees.
- Additional custom services available on request, e.g. for enterprise requirements.
Embeddable vs. Tableau Embedded
- Performance: Embeddable is known for fast-loading at scale; whereas users report that Tableau loads slowly, especially at scale in a customer-facing scenario.
- Ease of use: Embeddable is easier for dashboard builders and end-users, and can be extended in code by developers (requires coding skills); whereas Tableau has a steeper learning curve for all users.
- Pricing: Embeddable provides predictable pricing to support embedded use cases where users and usage can vary, and fluctuate. Tableau on the other hand provides a variable seats-based or usage-based pricing model.
- Customisability: Embeddable enables robust customisability and extensibility, and import of custom charting components, whereas Tableau has an opinionated UI and limited set of charting options.
3. Looker Embedded
Key Embedded Analytics Features
- LookML Modeling Language: Looker’s proprietary modeling language enables advanced data modeling and customization. Users can define complex business logic and reusable data models that can be shared across the organization.
- Embed SDK: Looker’s Embed SDK simplifies the embedding process by encapsulating embedded content, eliminating the need to manually create HTML elements. The SDK also facilitates seamless communication between your web app and the embedded Looker content through a dedicated message channel, avoiding the complexities of cross-frame communication.
- Self-Service Data Exploration: Similar to Holistics, Looker allows users to perform ad-hoc analysis and explore data independently, thanks to its user-friendly interface and robust exploration capabilities.
Pricing
- Custom Pricing: Looker operates on a custom pricing model based on factors like the number of users and the scale of deployment. The pricing can be substantial, especially for larger organizations or those requiring extensive customization and support.
Comparison to Tableau
- Performance: Looker performs exceptionally well within the Google Cloud environment, particularly when leveraging its real-time data exploration capabilities.
- Ease of Use: Looker’s interface is intuitive, but mastering LookML is necessary to unlock its full potential, adding a layer of complexity. Tableau, while more feature-rich out of the box, can be more challenging for beginners but offers more immediate visualization capabilities.
- Pricing: Looker’s custom pricing can be eye-watering, particularly when factoring in the need for technical expertise with LookML. Tableau’s pricing, while also high, might offer more straightforward value for those focused on advanced visualizations.
- Customizability: Looker offers robust customizability, especially with the Embed SDK, which makes embedding analytics into web applications more streamlined and efficient. However, Tableau provides broader customization options for visualizations and user interactions.
4. Power BI Embedded
Key Embedded Analytics Features
- Integration with Microsoft Ecosystem: Power BI Embedded is deeply integrated with the Microsoft ecosystem, making it an excellent choice for organizations already using Azure, Office 365, or other Microsoft services.
- DirectQuery and Real-Time Data: Power BI Embedded supports DirectQuery, which allows users to run queries in real-time against large datasets. This feature is particularly valuable for scenarios that require up-to-the-minute data, ensuring that decisions are based on the latest information available.
- Custom Visuals: Power BI’s Custom Visuals feature enables developers to create and integrate bespoke visualizations that meet specific business needs, offering a high degree of flexibility and personalization within embedded analytics.
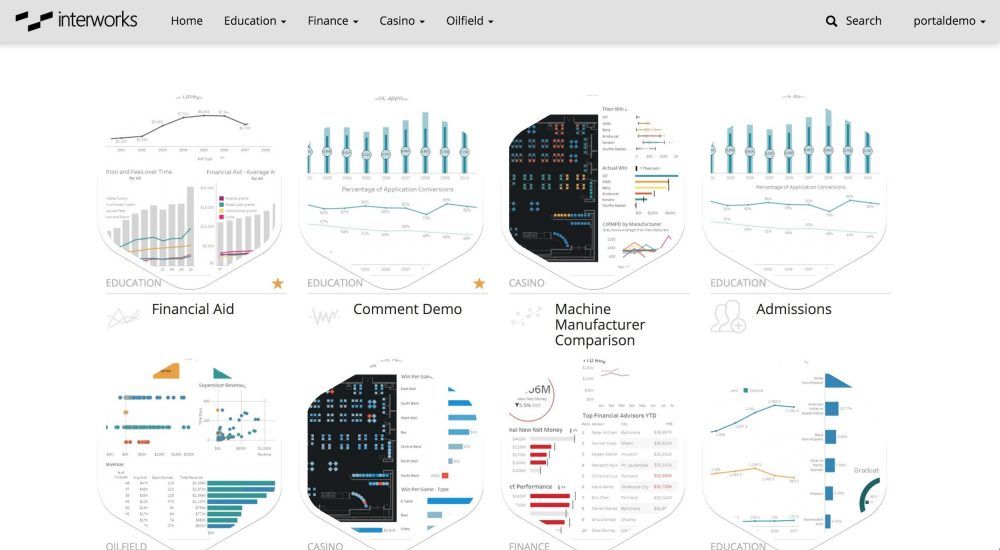
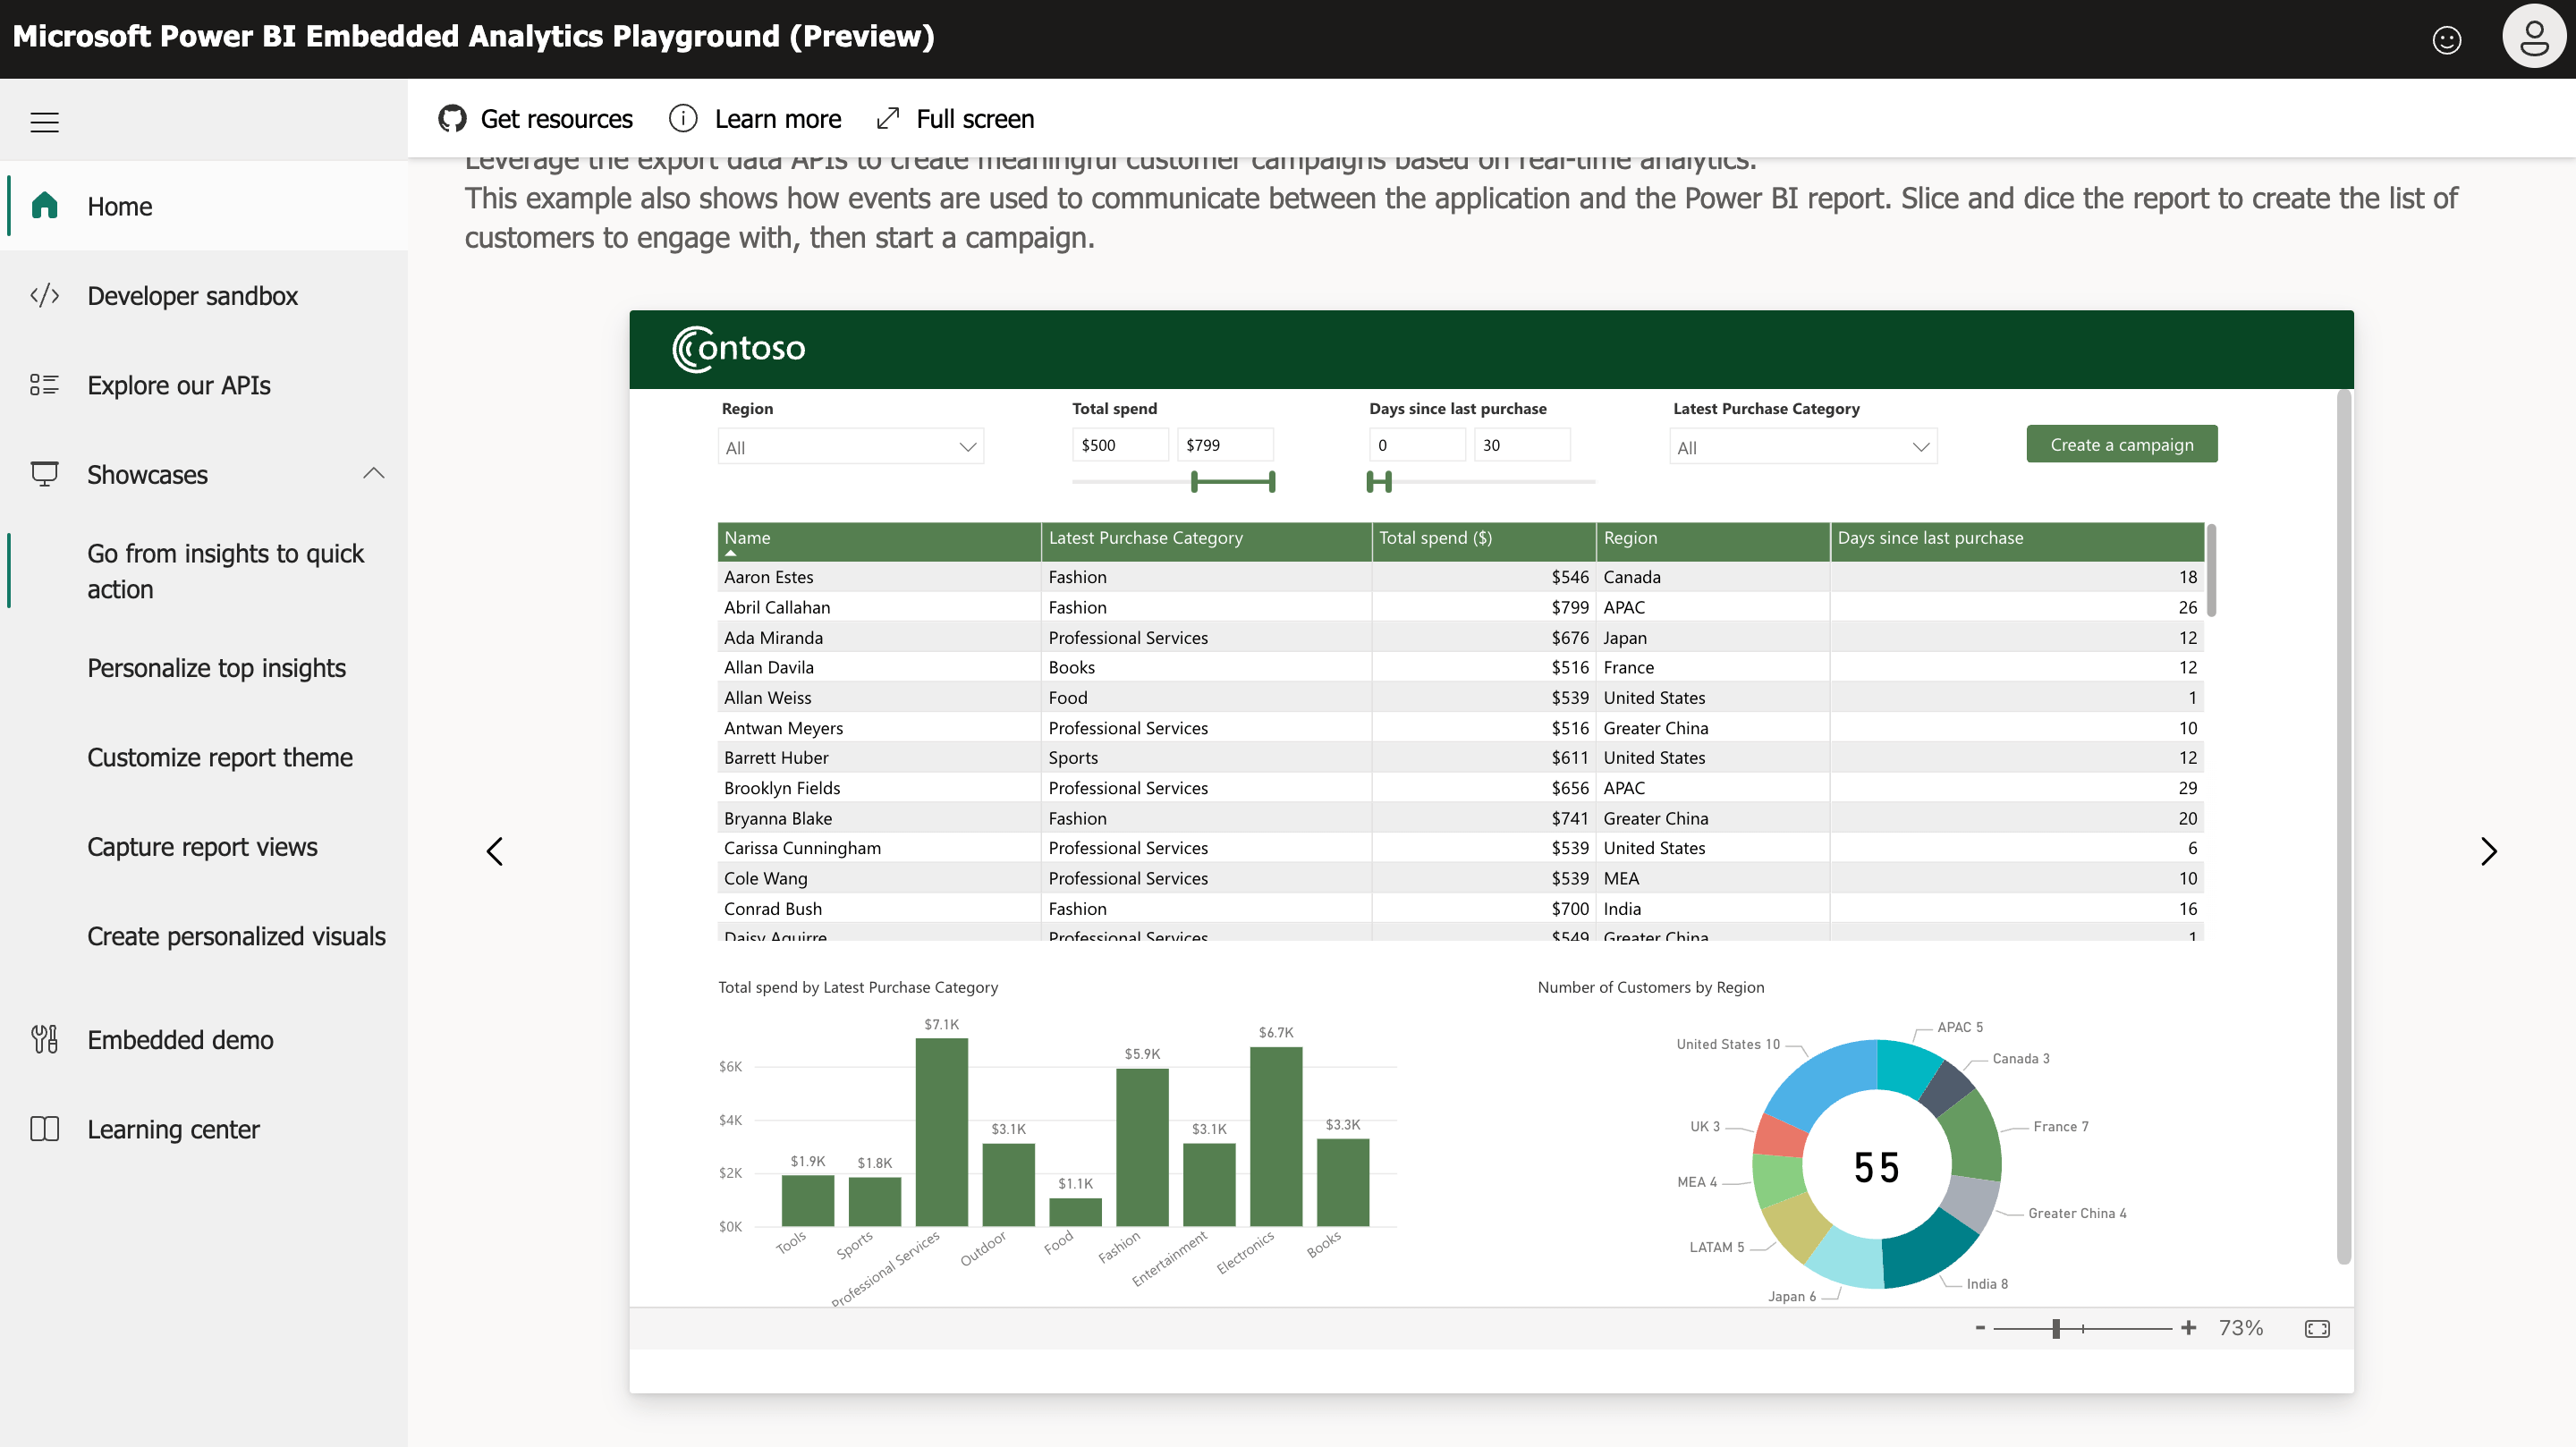
Check out Power BI Embedded Playground here.
Pricing
- Session-Based Pricing: Power BI Embedded operates on a session-based pricing model, which charges based on the number of sessions and the complexity of the reports. This can be cost-effective for businesses with variable analytics usage, allowing them to scale their investment according to actual usage.
- Affordable for SMBs: The pricing is generally more accessible compared to Tableau, especially for small to medium-sized businesses. Organizations that are already invested in Microsoft services may find additional savings through bundled offers or existing subscriptions.
Comparison to Tableau
- Performance: Power BI Embedded performs well, particularly when integrated with Azure and other Microsoft services. Its DirectQuery feature enables real-time data access, which is a strong advantage for real-time analytics. However, Tableau may outperform Power BI in scenarios involving highly complex visualizations or very large datasets due to its more extensive optimization features.
- Ease of Use: Power BI is known for its user-friendly interface, making it relatively easy for non-technical users to create and explore reports. However, Tableau provides a more advanced set of visualization tools out of the box, which might appeal to users needing more sophisticated analytics capabilities.
- Pricing: Power BI’s session-based pricing is generally more affordable than Tableau’s licensing model, particularly for organizations with fluctuating analytics needs. The cost advantage is further enhanced for companies already using Microsoft services, as Power BI can be integrated into existing workflows at a lower incremental cost.
5. Metabase
Key Embedded Analytics Features
- Simplicity and Ease of Use: Metabase is known for its user-friendly interface, which allows non-technical users to create, explore, and share data visualizations without needing to write SQL. It’s particularly suited for organizations looking for a straightforward BI tool that doesn't require a steep learning curve.
- Open Source Flexibility: As an open-source platform, Metabase offers the flexibility to customize and extend its features according to specific business needs.
- Interactive Dashboards and Embedding: Metabase enables easy creation and embedding of interactive dashboards into web applications. Users can filter and interact with data directly within embedded environments.
Pricing
- Free and Open-Source: Metabase offers a free, open-source version that provides core features, making it an attractive option for startups or smaller businesses.
- Paid Version starts from $80/month. For organizations requiring additional features, such as advanced embedding and white-labeling, Metabase offers a paid enterprise version with additional support and capabilities.
Comparison to Tableau
- Performance: While Metabase is powerful enough for many use cases, it may struggle with performance when dealing with very large datasets or highly complex queries. Tableau generally offers better performance optimization, particularly for data-heavy applications.
- Ease of Use: Metabase excels in ease of use, particularly for non-technical users. Its simplicity is a major selling point, whereas Tableau, while offering more advanced features, can be more complex and intimidating for beginners.
- Pricing: Metabase is far more affordable than Tableau, especially with its free open-source version. Even the enterprise version is likely to be less expensive than Tableau, making it a strong contender for organizations on a budget.
- Customizability: As an open-source platform, Metabase allows for significant customization, particularly for businesses with the technical expertise to modify the codebase. However, Tableau’s advanced visualization and embedding features still offer greater overall flexibility, especially for complex analytics needs.
6. Sisense
Key Embedded Analytics Features
- Elastic Data Engine: Sisense’s Elastic Data Engine is a powerful feature that allows users to analyze large and complex datasets quickly. It’s designed to handle massive amounts of data across multiple sources, making it a strong choice for organizations with significant data processing needs.
- AI-Driven Analytics: Sisense incorporates AI and machine learning capabilities into its platform, enabling predictive analytics and advanced data insights.
- Customizable Embedding: Sisense offers robust embedding options with its fully customizable API.
Pricing
- Custom Pricing Model: Sisense operates on a custom pricing model, which varies based on the scale of deployment, the number of users, and specific feature requirements. While the pricing is generally competitive, it can be on the higher side, particularly for large-scale or highly customized implementations.
Sisense Embedded vs Tableau Embedded
- Performance: Sisense is designed to handle large datasets efficiently, thanks to its Elastic Data Engine. However, Tableau generally offers better performance optimization for highly interactive visualizations, particularly when dealing with real-time data. Sisense’s strength lies in processing vast amounts of data, but it may not match Tableau in terms of the smoothness of user interactions in complex visualizations.
- Ease of Use: Sisense is relatively user-friendly, but it does have a steeper learning curve compared to some other BI tools, particularly when it comes to setting up and managing the Elastic Data Engine. Tableau, while complex, is often considered more intuitive in terms of its drag-and-drop interface for creating visualizations.
- Pricing: Sisense’s custom pricing model can be tailored to fit the specific needs of an organization, but it's reported to be expensive, particularly for businesses requiring extensive customization or support. Tableau’s pricing is also high, but it might offer more predictable costs for businesses that need advanced visualizations without as much emphasis on massive data processing.
- Customizability: Sisense shines in customizability, particularly with its API, which allows for extensive customization of embedded analytics. However, Tableau also provides broader options for visual customization and interaction within its embedded analytics environment.
What's happening in the BI world?
Join 30k+ people to get insights from BI practitioners around the globe. In your inbox. Every week. Learn more
No spam, ever. We respect your email privacy. Unsubscribe anytime.
