Using Holistics
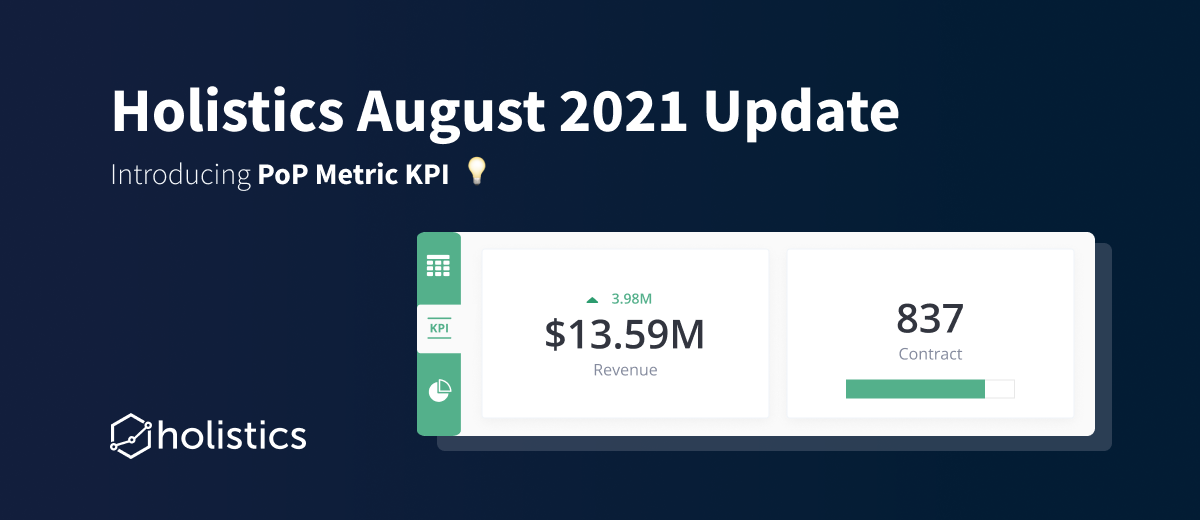
Holistics August 2021 Product Updates
We understand that things are getting tougher and tougher during this pandemic but we will not wave the white flag right now. …

We understand that things are getting tougher and tougher during this pandemic but we will not wave the white flag right now. …
For the past two months, we've been shipping some great features to improve your experience and interactivity inside Holistics.
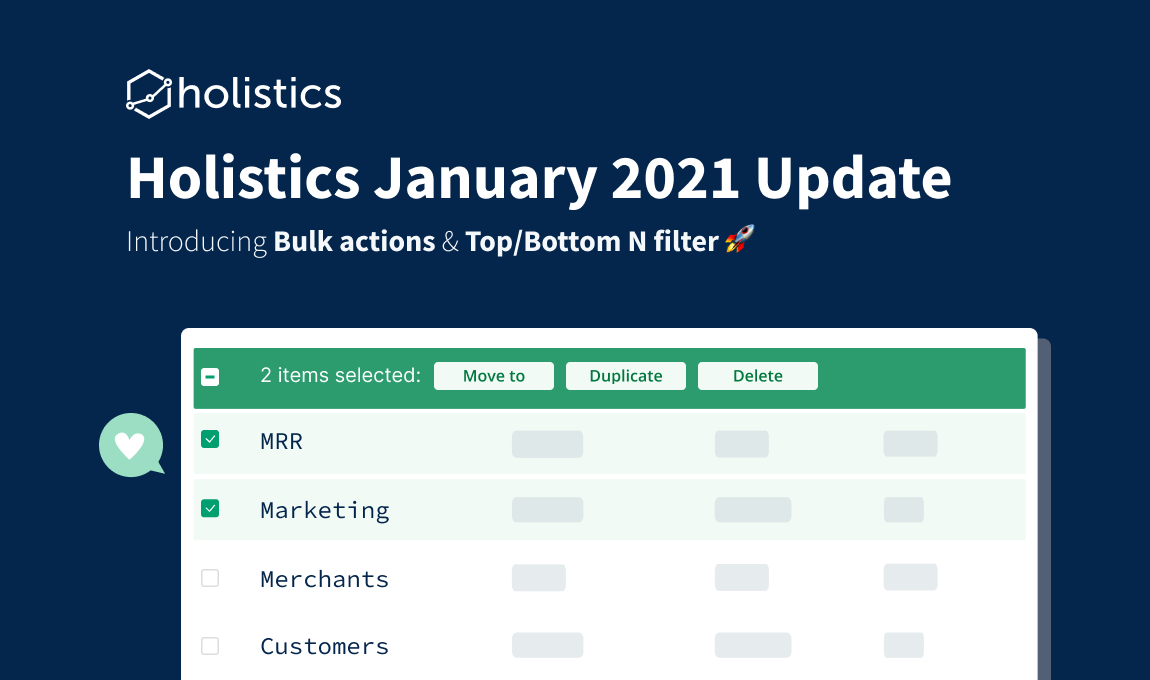
We've shipped 2 new features in January 2021: Bulk actions and Top/Bottom N filters.

2020 has been a really tough period for people around the world due to COVID-19. Regardless, Here at Holistics, we continue to …
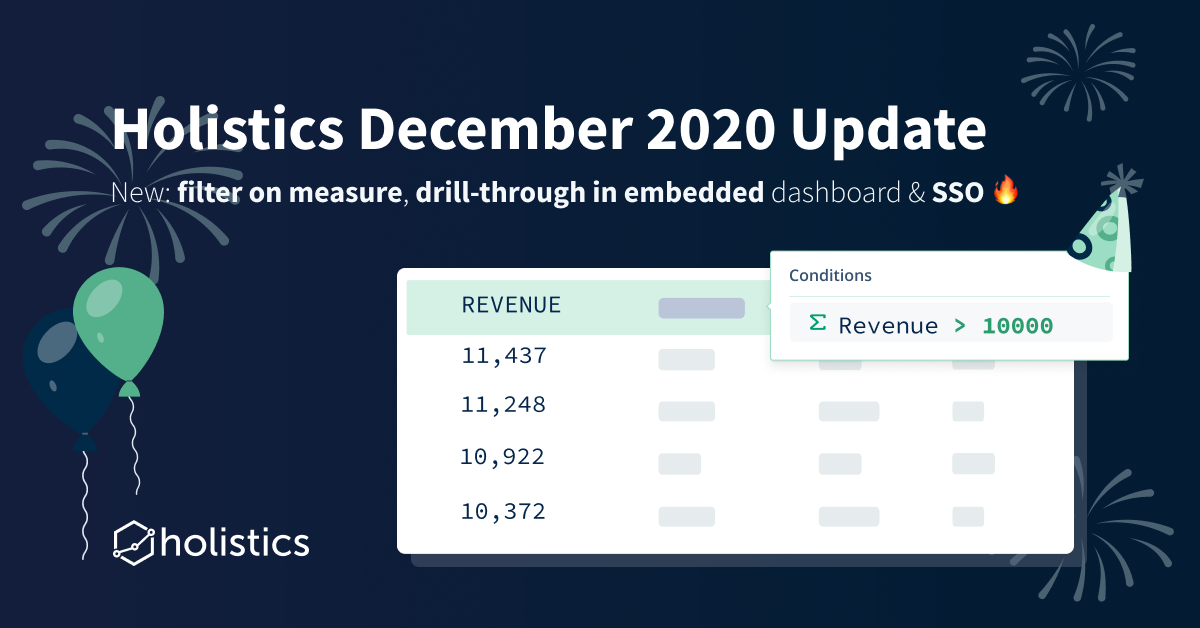
Another festive season is coming! If you haven’t got any plan for the upcoming holidays, here’s our little suggestion: Explore Holistics’ newest features and improvements.
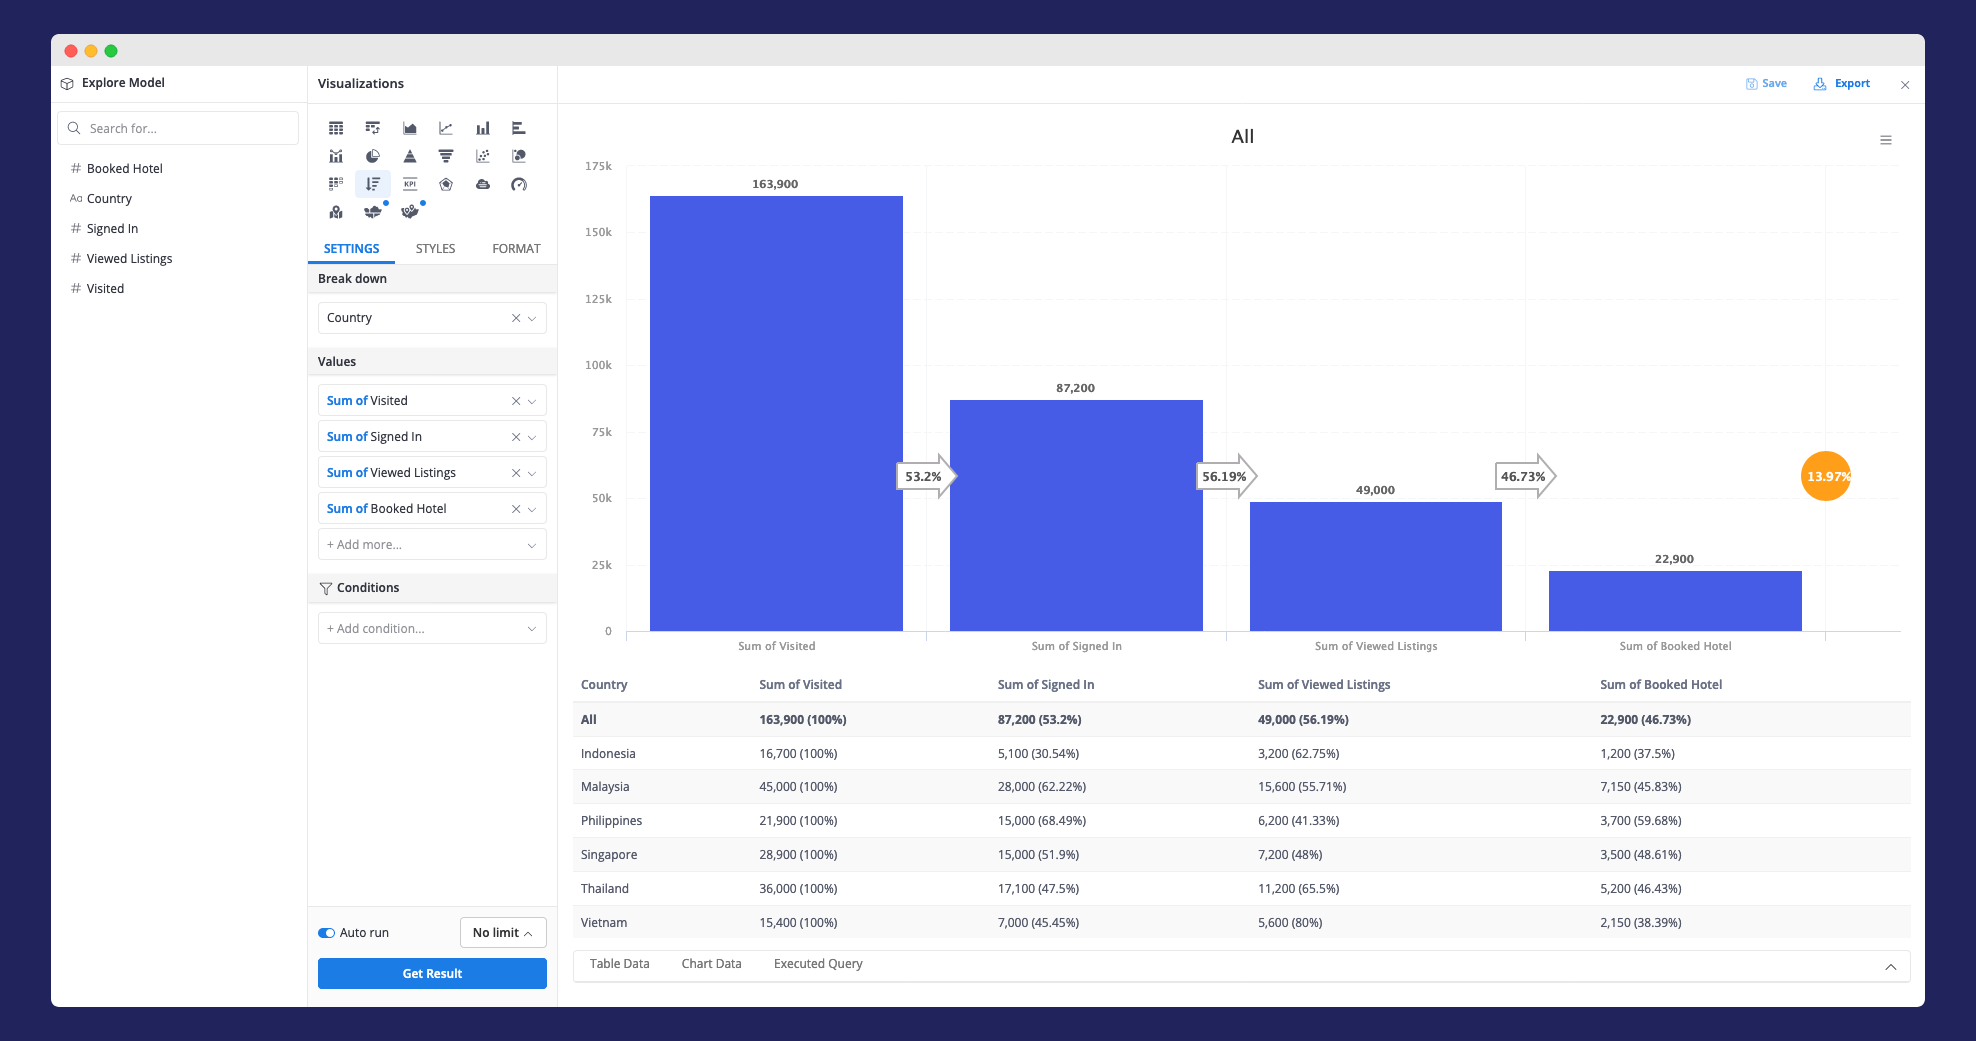
Conversion Funnel has been with Holistics since the first day, but it never got the attention that matches its importance. That' …
We've shipped 3 new features this month: Metric Sheet, Point Map and Adhoc Export.
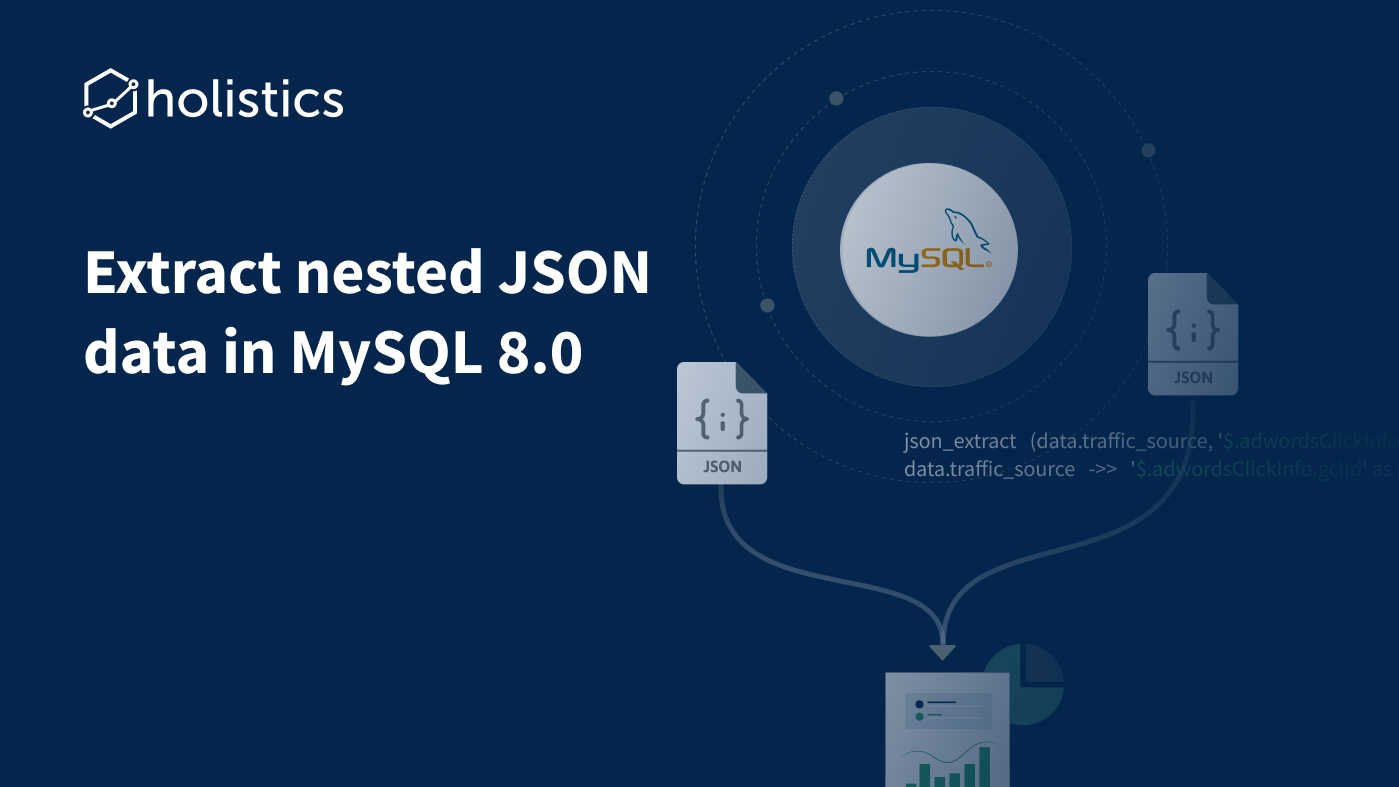
In this article, we will demonstrate how to use the JSON_EXTRACT and JSON_TABLE functions in MySQL8.0 to convert JSON table into tabular data for analysis and reports, and also how to utilise it in Holistics for drag-and-drop reports.
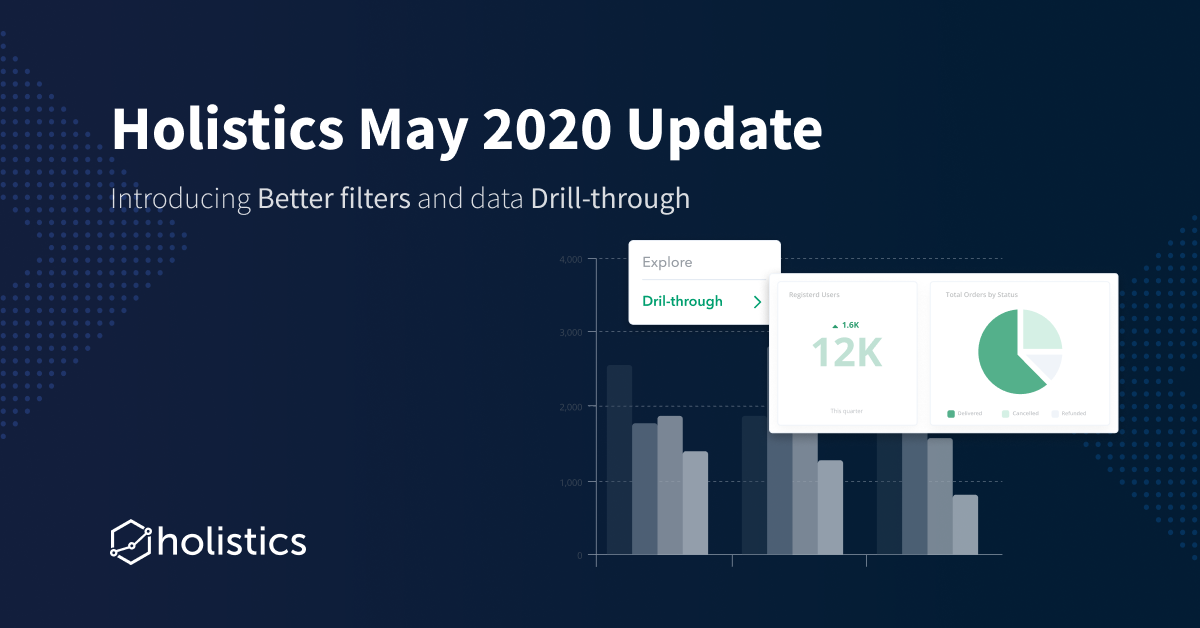
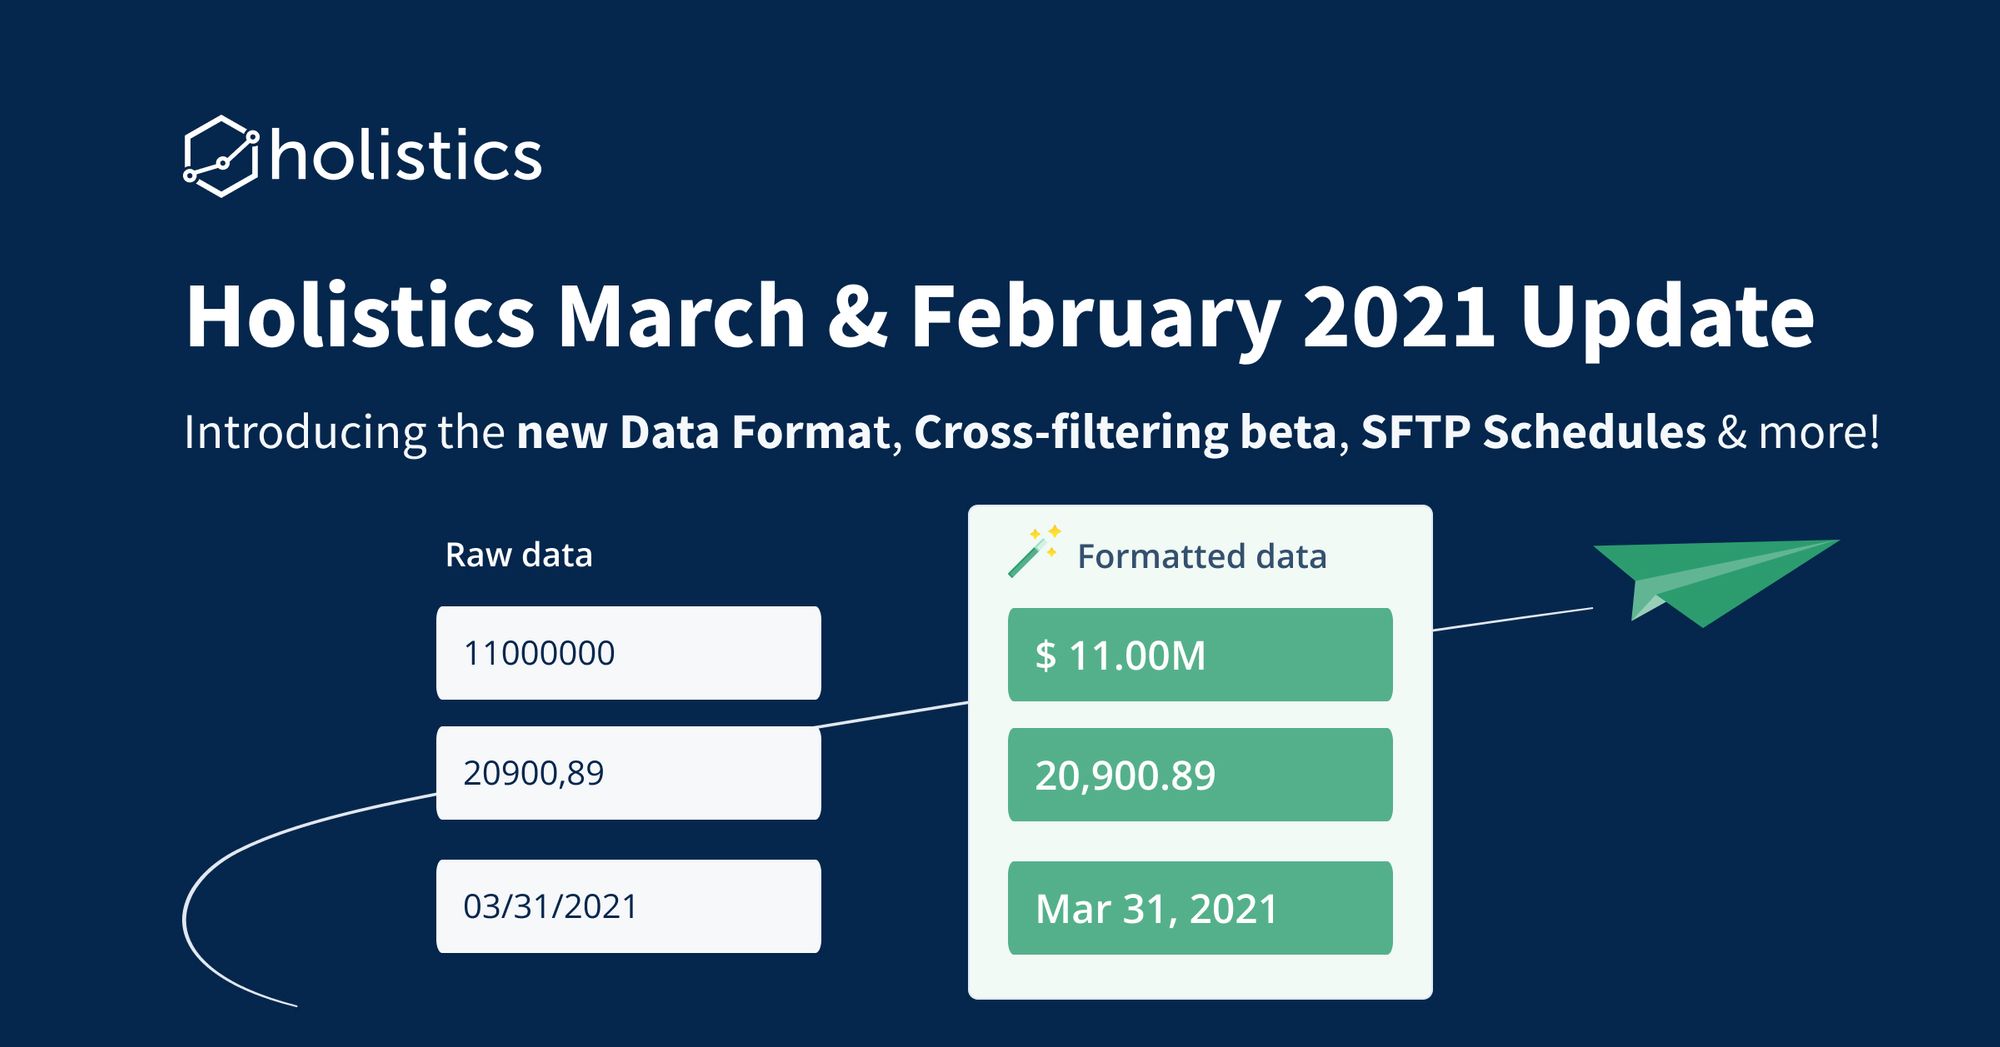
Discover our new and May-verllous features: Data drill-through, Smart date parser, Filter suggestions, and more!
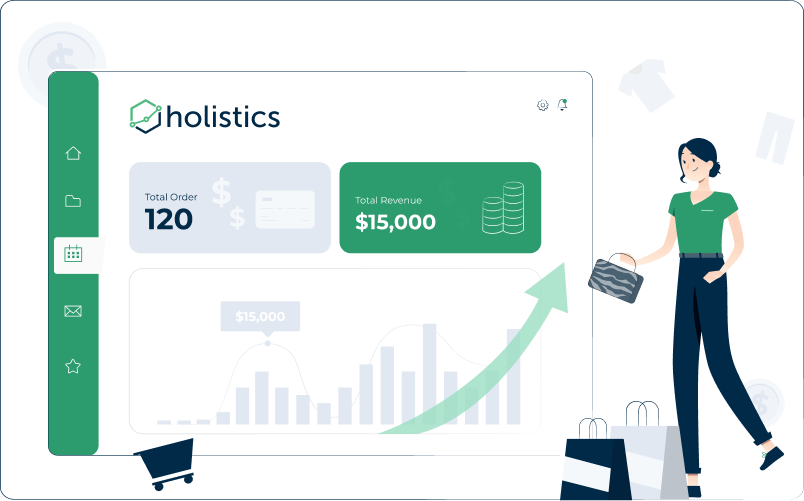
Learn how to leverage data to craft personalized messages to your customers, pinpoint your business' Achilles heel and take timely actions!

This tutorial will show you simple steps to build an interactive dashboard to visualize your Pipedrive data using Holistics.
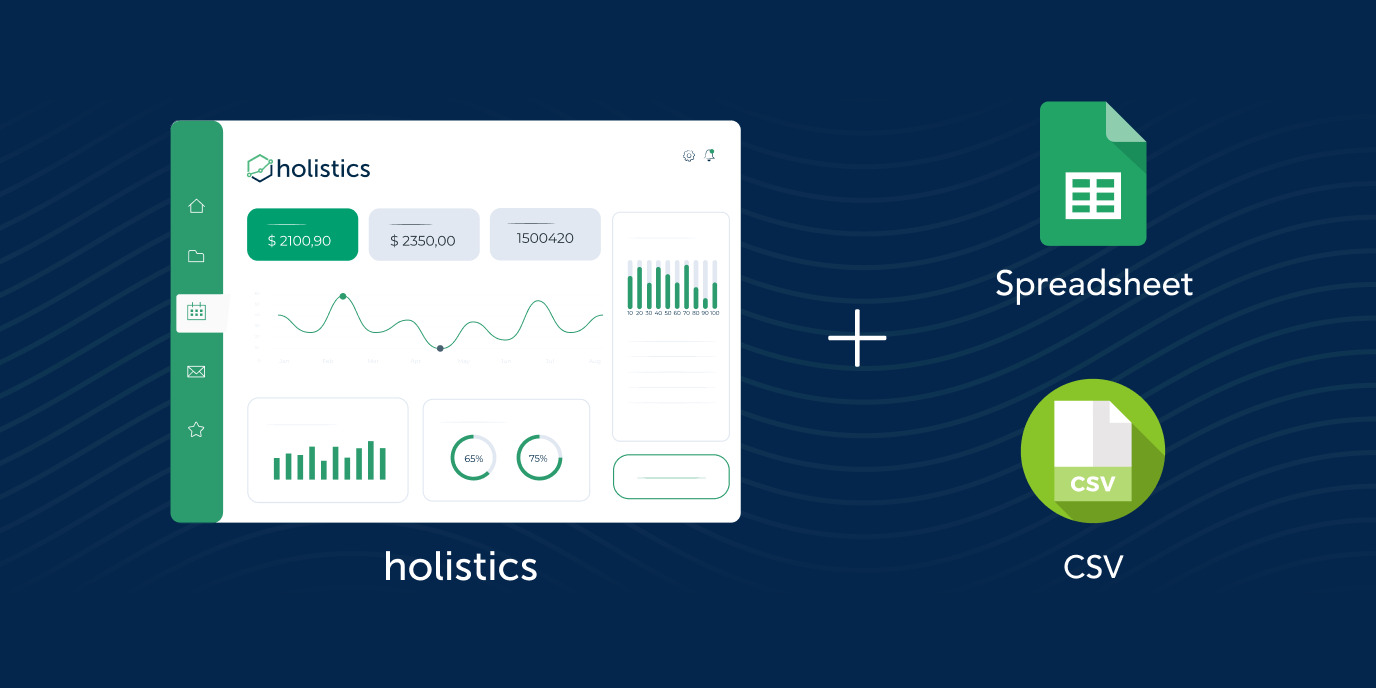
I'll show you 5 simple steps to integrate CSV / Google Sheets and build a real time dashboard by using Holistics.
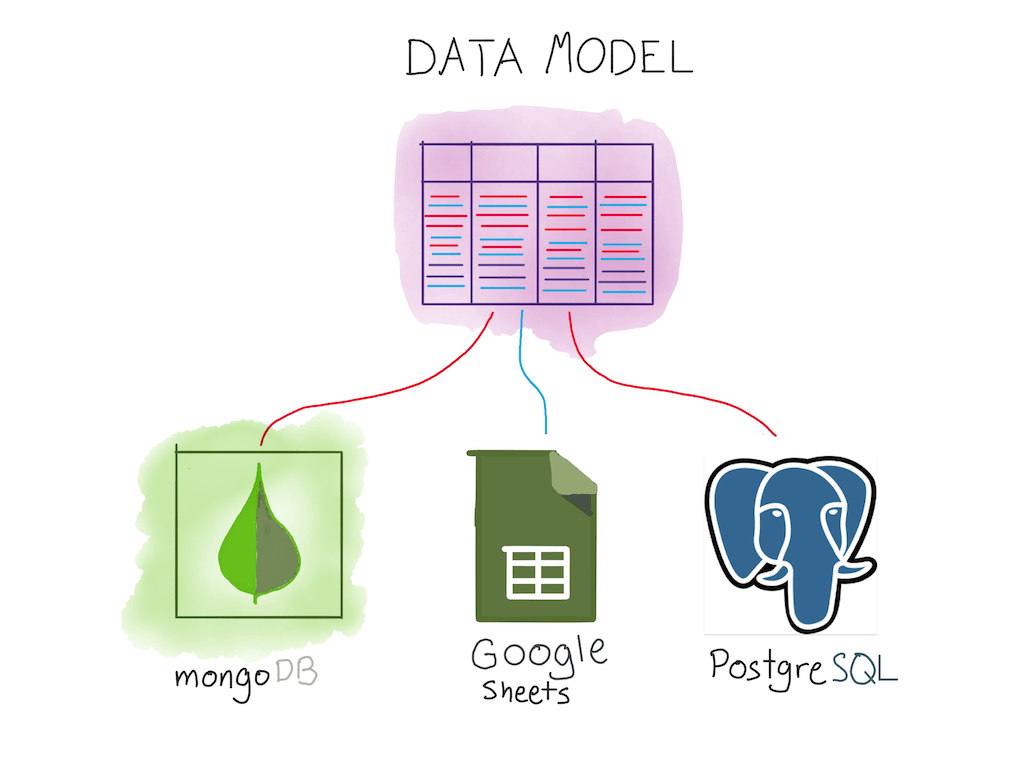
In Holistics, you are now able to create data models on top of external data sources like MongoDB and Google Sheets. Here's a video tutorial on how to do exactly that.

Using custom SQL for your Tableau workbooks is usually a really bad idea. Here's how using Holistics with Tableau makes this a non-problem.

Tableau may be the best data visualizer on the planet today, but Holistics makes Tableau more awesome, by making data prep trivially easy.
Join 30k+ people to get insights from BI practitioners around the globe. In your inbox. Every week. Learn more
No spam, ever. We respect your email privacy. Unsubscribe anytime.