Top 05 Snowflake BI & Reporting Tools: Detailed Comparison
The best business intelligence tools to use with the Snowflake data warehouse.
Snowflake Hype
With its most recent IPO that took the whole Wall Street by storm, everyone in the data market space is talking about Snowflake - a cloud-based data warehouse-as-a-service.
As companies are eagerly switching from traditional server-based data warehouses to modern server-less ones (as described in detail by Lars Kamp in his letter to his investors), it's very likely that your company is looking at adopting Snowflake and revamping the complementary data stack.
In response to this movement, as a data analyst/engineer, you set out to find the most compatible BI and reporting tools for this data source.
Although Snowflake has kindly listed out all BI tools that it can inter-operate with, it is not enough for us to simply decide which one fits our company's demand for data.
This blog will give you a detailed comparison of the top 5 Snowflake BI & reporting tools, which hopefully will give you some pointers to choosing the most suitable one for your current data stack.
The Best Snowflake BI and Data Visualization Tools
- Holistics
- PowerBI
- Looker
- Tableau
- Metabase
Holistics
Holistics is a self-service BI tool that lets data analysts model and transforms data in Snowflake and many other SQL data warehouses. Then, non-technical users can run their own analysis for insights without having to rely on analysts anymore.
Holistics is best-known for its data modeling capability, which can help analysts create a single source of truth where they can apply business logic to their own data and make sure it is accurate, maintainable, and reusable.
Holistics also achieved Select Partner Tier Status as part of the Snowflake Partner Network - which allows it to extend its full values to data teams with a Snowflake-native, self-service analytics solution leveraging the full power of Snowflake
You can learn how to connect Holistics to Snowflake in their detailed guide here.
Pros
- Allow you to query the Snowflake database using customizable SQL queries and get fast results with its cache layer
- Materialized views of query results are stored back to your own SQL database, for immediate access and fast visualizations and reports.
- Automated scheduling of reports and dashboard with the latest data in Snowflake, sent directly to your email inbox.
- Drag-and-drop interface for business users to explore data and generate reports to answer ad-hoc questions.
- Canvas-based Dashboards that allow data teams to have full customization over dashboard content, styling, and layout.
- Competitive pay-as-you-go pricing model, which only scales as your company scales.
- Git Version Control to track every change, and perform branching, and code reviews to ensure accurate analytics workflow
- Fast, flexible embedded analytics.
Cons
- There are a few minor UI difficulties, which can be off-putting for new users.
- Holistics' AQL (analytics query language) is powerful but might come with high learning curve.
PowerBI
PowerBI is quite well-known in the BI industry, especially for enterprises that adopt the Microsoft ecosystem. It supports an impressive number of data sources, giving companies the power to centralize their data in one place.
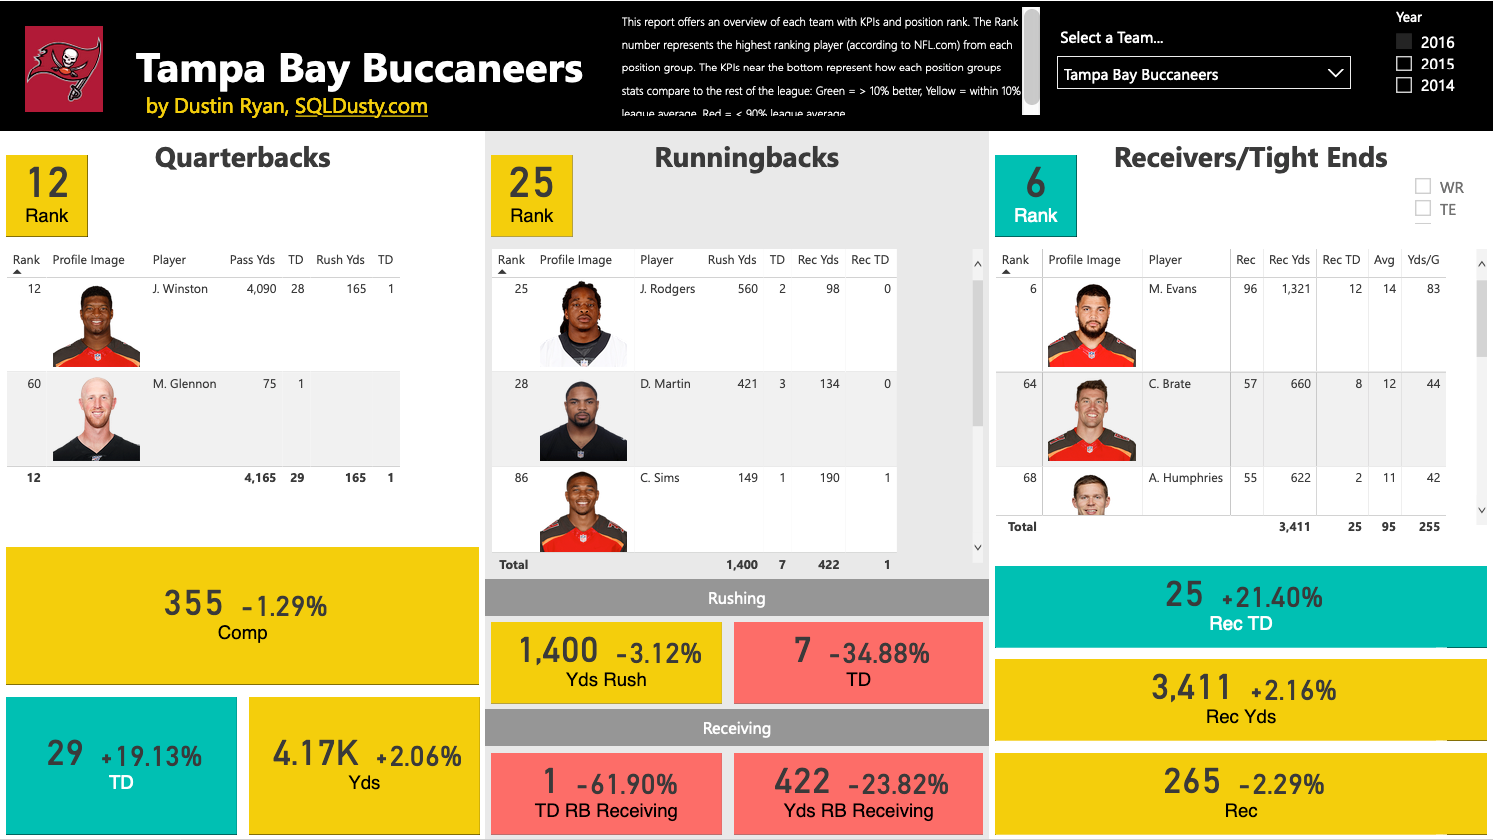
PowerBI has a user-friendly interface with amazing data visualization capabilities, ranging from simple dashboards that analyze eCommerce metrics to highly complicated ones like the NFL Football analysis one below.
Connecting PowerBI to Snowflake is fairly simple. You can follow the instructions here.
Pricing
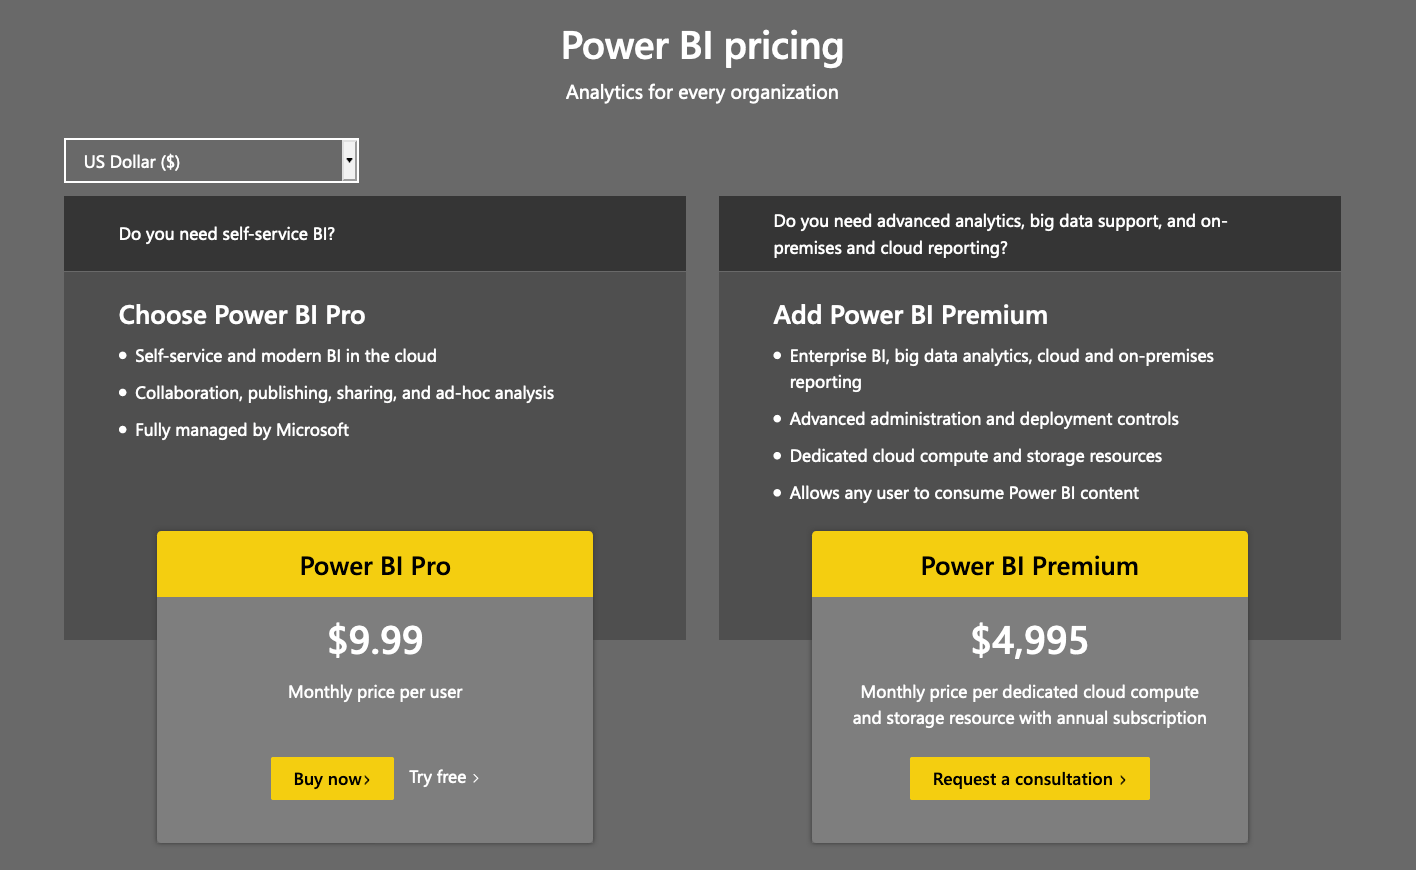
PowerBI pricing is also attractive for small-scale companies with small data teams. If you're an individual and only need PowerBI on your local computer to do analysis, then you can download the desktop version for free. However, if you want to use more Power BI services and publish your reports on the cloud, you can take the Power BI Cloud service solution for $9.99 per user per month.
Please note that if your company is concerned about security and on-premise deployment, the price goes up considerably at $4,995 per month, with an annual subscription.
Pros
- Support hundreds of data sources, from cloud services like Snowflake to offline files like Excel
- Powerful data visualization capabilities. Besides the basic visualization types, PowerBI allows advanced users to choose from a marketplace of custom visuals or create their own using well-known Javascript libraries
- Frequent updates and innovations. Follow PowerBI's blog and you will see the team is really active in pushing new features and changes.
- PowerBI has an active community of power users and employees who are willing to deep dive into your use case to help you out.
Cons
- PowerBI has a steep learning curve. Data analysts must learn DAX (Data Analysis Expression) language to fully leverage PowerBI's power, which is complicated and rigid sometimes.
- Limited data delivery capability. If you want to view a PowerBI report, you must have PowerBI desktop installed or have PowerBI Report Server already set. This is difficult for Mac users since PowerBI can only be installed on Windows devices.
For more detailed BI tool list and analysis, check out:
Looker
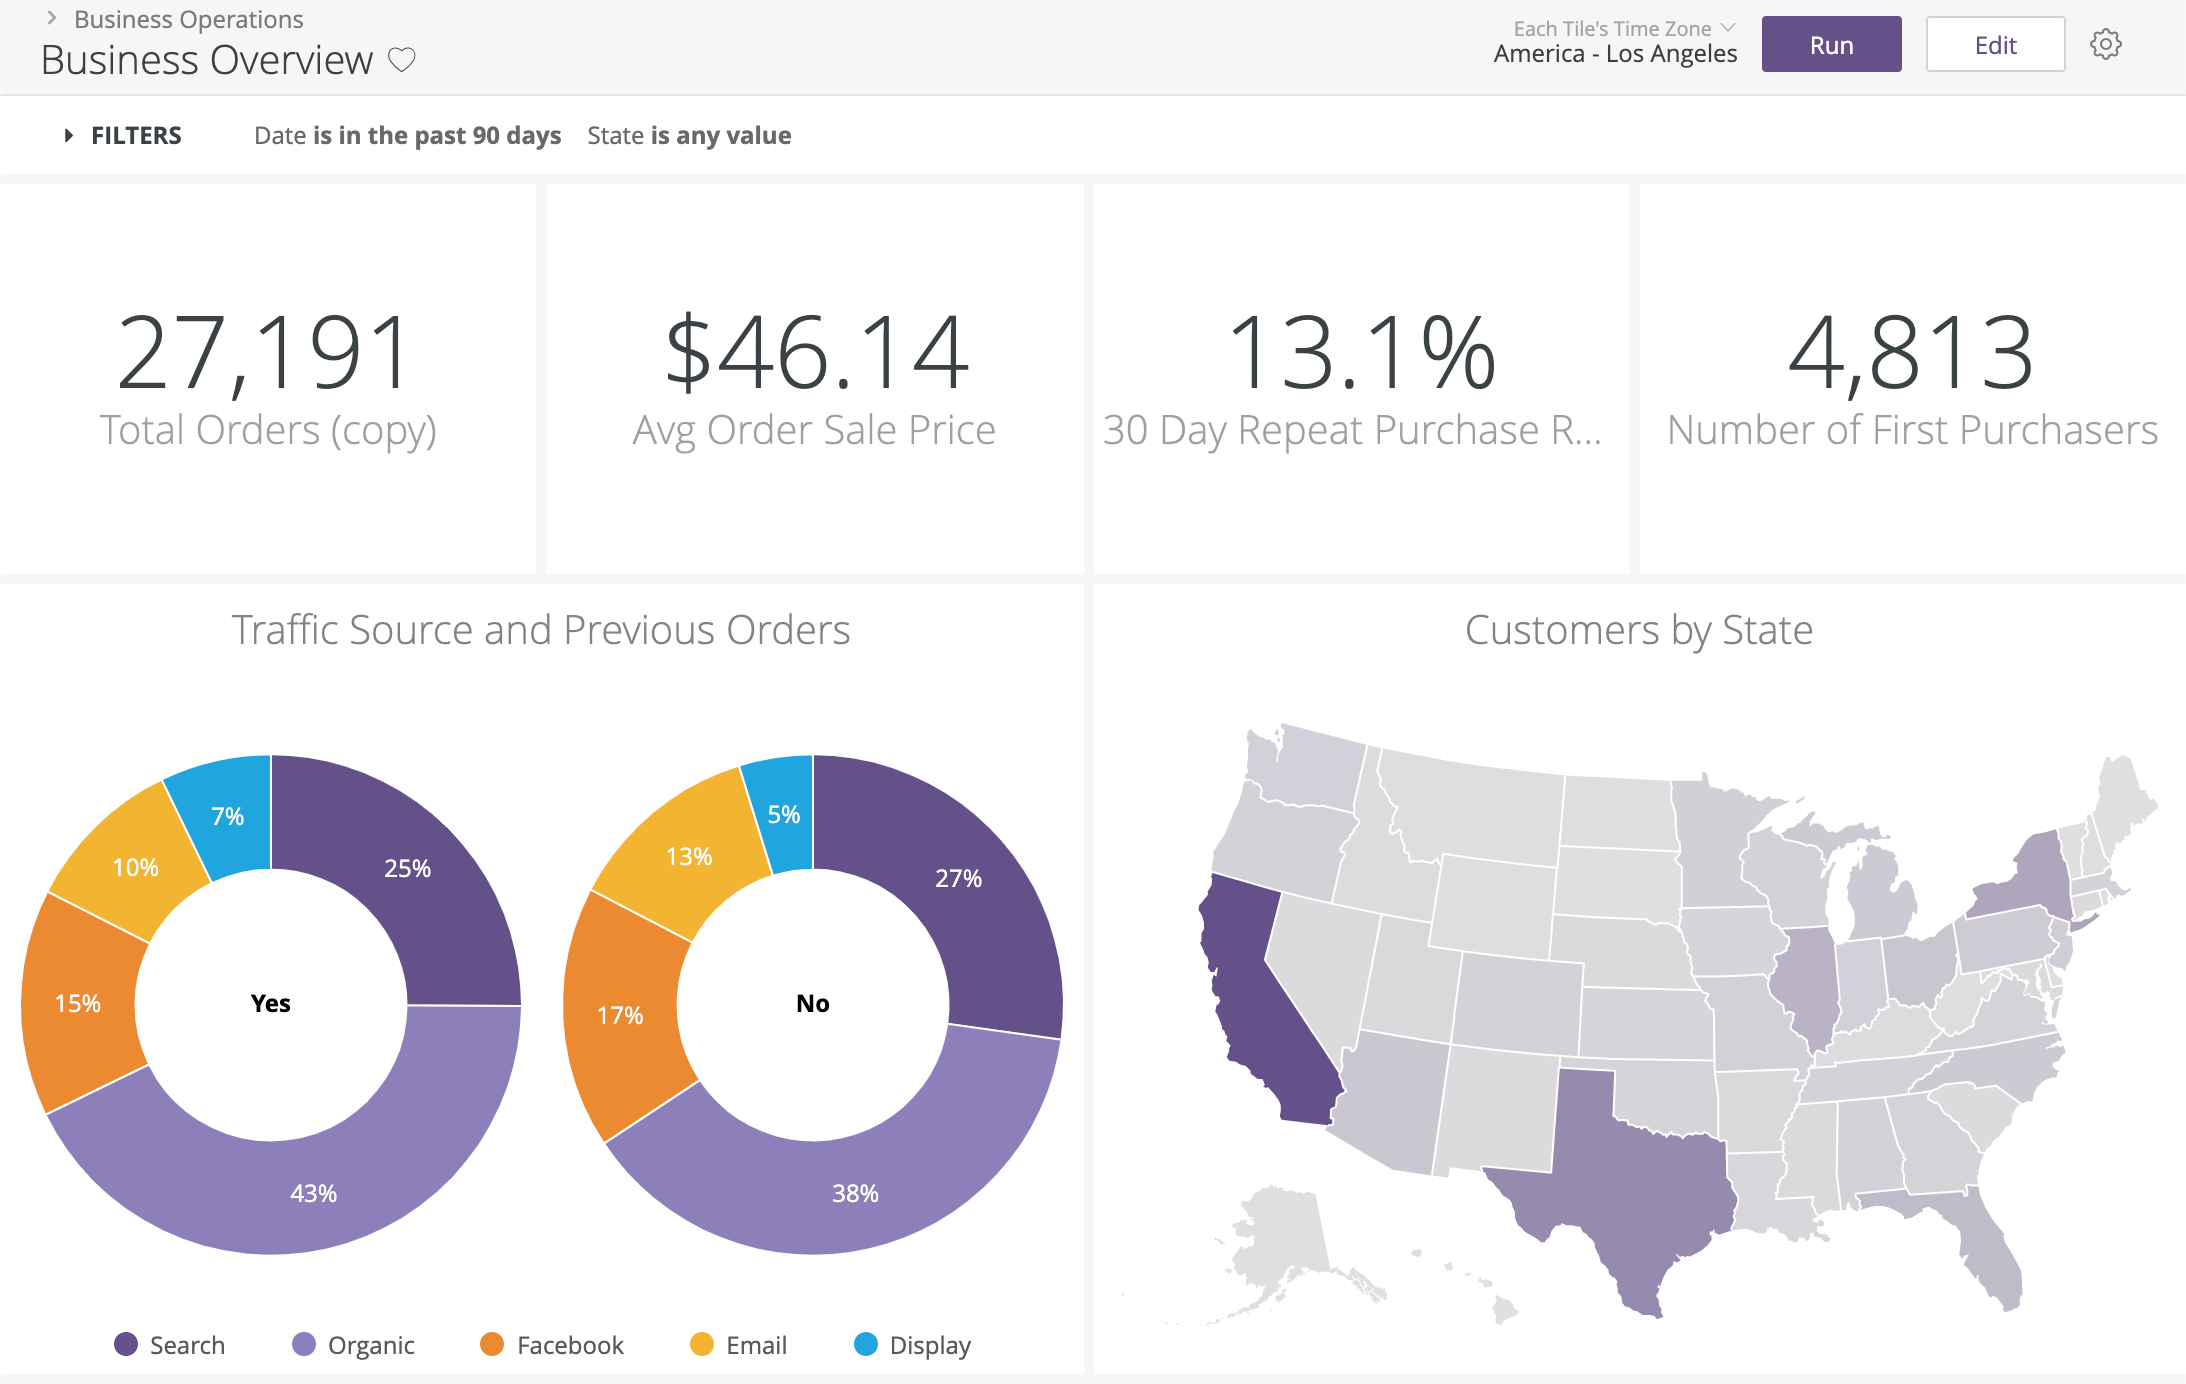
Recently joined as a part of Google Cloud Platform, Looker is a powerful BI tool that provides an innovative approach for real-time data exploration and analytics.
Looker has powerful dashboard capabilities that can cover most data discovery use cases. However, unlike Power BI, it requires a full semantic model for storing all your business logic and metrics without having to add multiple versions of a slightly different metric to your database tables. That means you cannot just take Looker, point it at a database, and get your visualizations in minutes. It requires an upfront definition using their own language LookML, which will take a considerable amount of time to master.
To connect Looker to Snowflake, follow the instructions here.
Pricing
Looker does not publicly release its pricing information because it will be customized for each company. From my conversations with a few Looker usersand , the price could range from $3000 - $10000 per month for 10 users with an annual subscription. As I mentioned above, Looker is designed for companies with mature and dedicated data teams that are willing to adopt a completely new modeling language and spend time setting up Looker to fit their whole data stack.
Pros
- Looker runs entirely in-browser, so there’s no need for a desktop installation and it's better for collaboration and data delivery between internal and external users
- Looker operates entirely on the data in your database. That means that you’re operating directly on your full dataset and getting all the horsepower of your database, whether that be an MPP like Vertica, Redshift, Bigquery; a SQL-on-Hadoop setup like Impala or Spark; or a standard RDBMS like MySQL or Postgres
- Automated reporting - Looker allows you to schedule emails for daily/weekly/monthly reports or send alerts if there are anomalies in data.
- Looker has GitHub integration, so you can see every change made to the modeling layer and combine the work of multiple developers seamlessly
Cons
- Looker has a steep learning curve when it comes to adopting a new language (LookML) & the model-view approach for the end-users. You definitely need to have an internal team that is dedicated to just setting it up and getting the rest of the people on board.
- Being locked in the platform. LookML takes over most of the work of preparing tables for visualization. Moving from Looker to another visualization tool will require additional work to migrate everything that has been defined by LookML.
- Although Looker provides a large library of custom charts, it can be very difficult to customize the visualizations to your exact needs.
Tableau
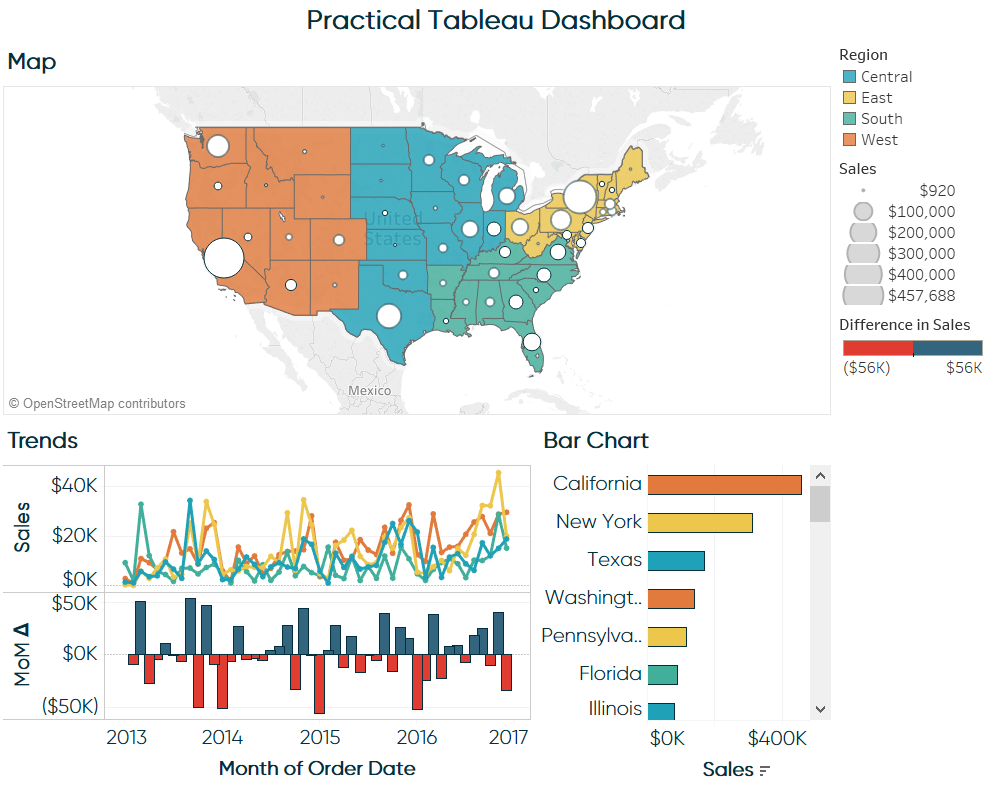
Tableau is most famous for its unparalleled capabilities of visualizing information. The application’s data visualizing quality is superior to what Tableau software competitors offer. If you want to create complicated dashboards with seamless interactivity, Tableau is definitely the must-have tool.
To connect Tableau to Snowflake, read more here.
Pricing
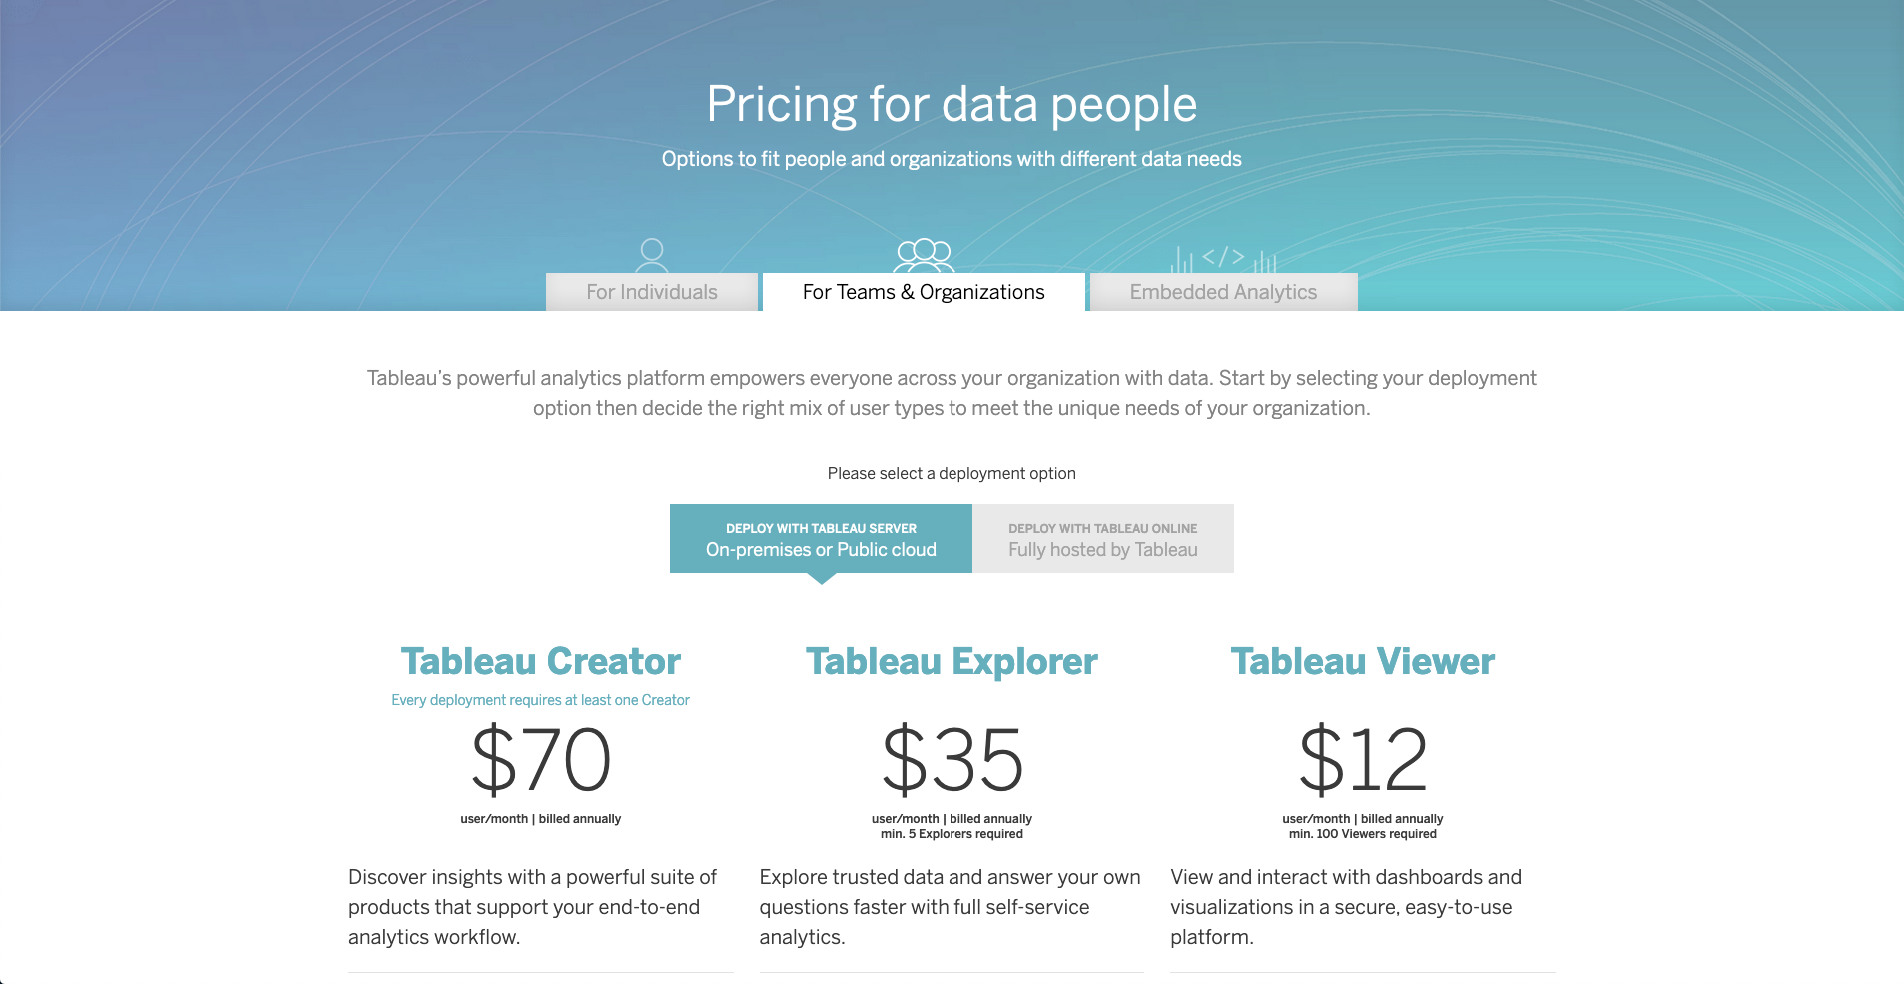
Tableau pricing is fairly complicated and is charged both based on your use case and the number of team members. Moreover, Tableau also charges based on the roles of users, with a Creator costing $70/month, an Explorer $35, and a Viewer $12. Since this number is dependent on your business, you really should plan ahead and prepare for an upsurge of additional costs if you decide to purchase Tableau.
Pros
- Great visualization capabilities: a large library of charts and highly interactive dashboards
- Tableau's friendly interface allows data analysts of all experience levels to quickly begin producing compelling and useful analysis and visualizations.
- Tableau handily deals with millions of rows of data, from various data sources, including spreadsheets and SQL databases. This allows users to integrate disparate data sources that may have been difficult to connect otherwise.
Cons
- Like PowerBI, Tableau cannot handle too big a dataset. It will get very slow. If you import data from multiple sources and the data is huge, it sometimes tends to lag and crash.
- Lack of BI capabilities. Tableau lacks the functionality required for a full-fledged business intelligence tool, such as large-scale reporting, the building of data tables, and static layouts.
- Tableau Desktop lacks the basic functionality of cleaning and prepping the data to be imported in Tableau Desktop. This is one of the major features which it lacks, you need additional support from Tableau to get these things added.
Metabase
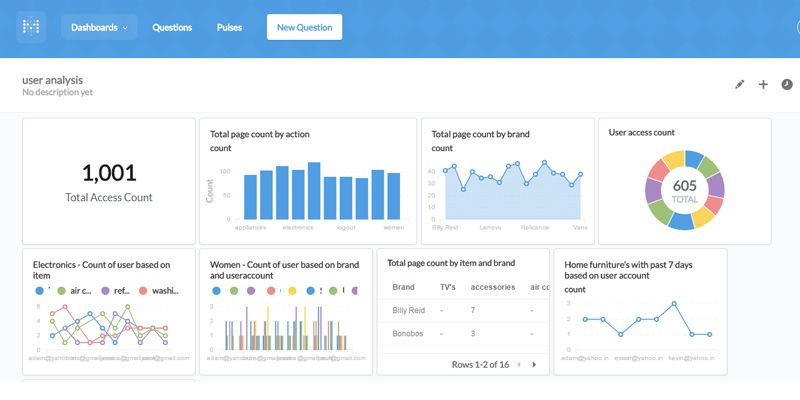
Not as equally popular as Holistics, PowerBI, or Tableau, Metabase is an open-source tool designed for non-technical users to provide big data insights and visualizations.
Metabase is best for businesses of all sizes that want to deploy either cloud-based or on-premise versions. You can use Metabase for KPI monitoring, database management, bug tracking, record filtering, debugging, and query builder.
Metabase does support connecting to Snowflake, but you might want to take into consideration a few things.
Pricing
Free
Pros
- Metabase is free and open-source. Metabase is licensed under GPLv3 with source code available on GitHub, which you can use to deploy on your own server and maintain on your own.
- Metabase is lightweight to install.
- The UI is simple and friendly so it takes little training to use the tool effectively.
Cons
- Metabase only works well with a single SQL data source. If you have data from multiple sources, chance is you might want to find another tool because it does not allow you to join table data.
- Despite having the desktop version, Metabase sometimes gets very buggy and slow to render the results.
- Contrary to Tableau, Metabase has limitations regarding customizing how the charts look.
- Because it is self-hosted, companies must handle the administration issues and app updates on their own, which might take a lot of time and effort.
Conclusion
Any of the five tools mentioned above will work well with Snowflake, but not all of them are suitable for your company.
Sometimes, the most powerful, feature-rich tool might not be the best choice, as it comes with too high a price or too steep a learning curve.
Therefore, if you're an analyst tasked with finding such tool, a good advice is to involve a lot of your colleagues and end-users to use the product intensively during the free trials. You will then understand the real bottlenecks of each tool and make the wisest choice.
If you need a little more pointer to choose the right tool, you might want to check out Chapter 4 in The Analytics Setup Guidebook which will discuss in detail how you can navigate the Business Intelligence tool space.
What's happening in the BI world?
Join 30k+ people to get insights from BI practitioners around the globe. In your inbox. Every week. Learn more
No spam, ever. We respect your email privacy. Unsubscribe anytime.
