Explore With Dataset
A grasp of these concepts will help you understand this documentation better:
Introduction
In Holistics, exploring data from a dataset is the starting point toward building a dashboard. Using datasets prepared by data analysts, business users can slice and dice your data with a drag-and-drop interface, as well as combining different data models to answer complex questions.
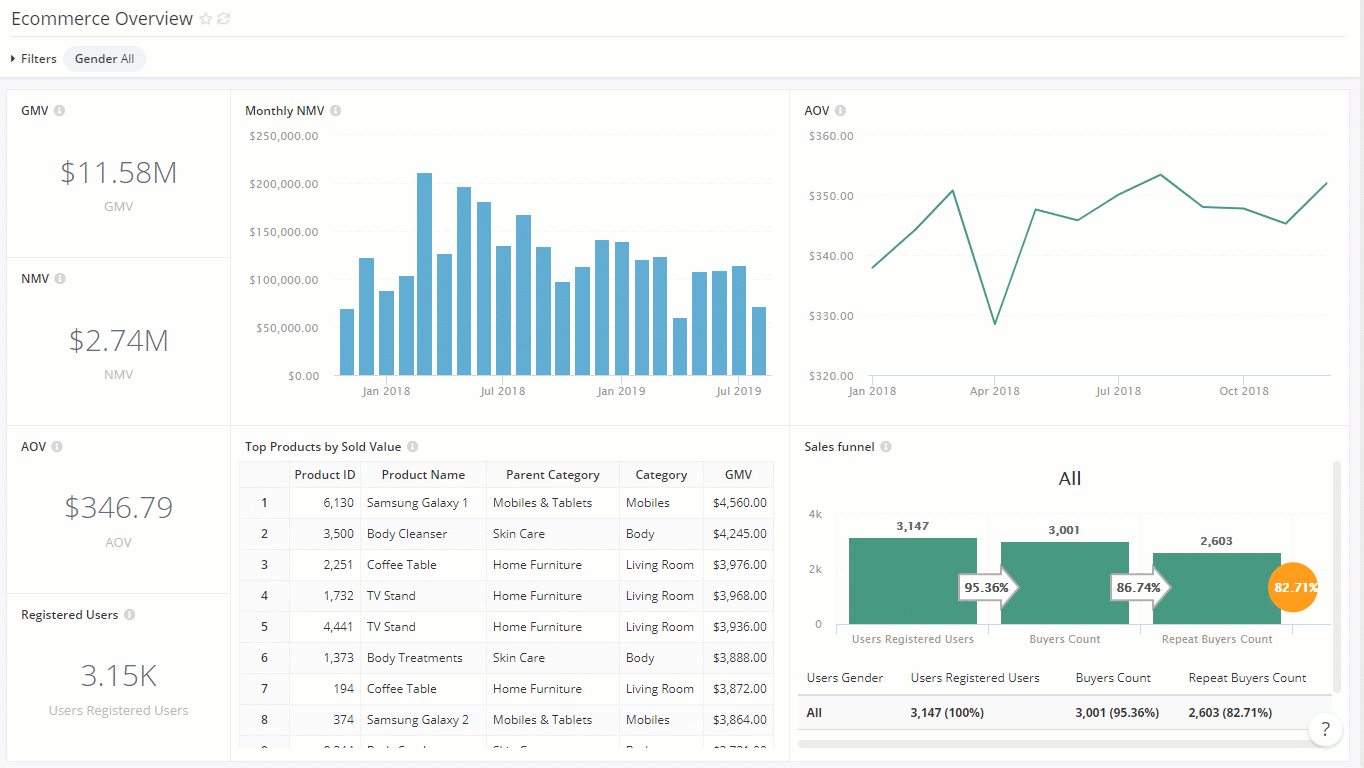
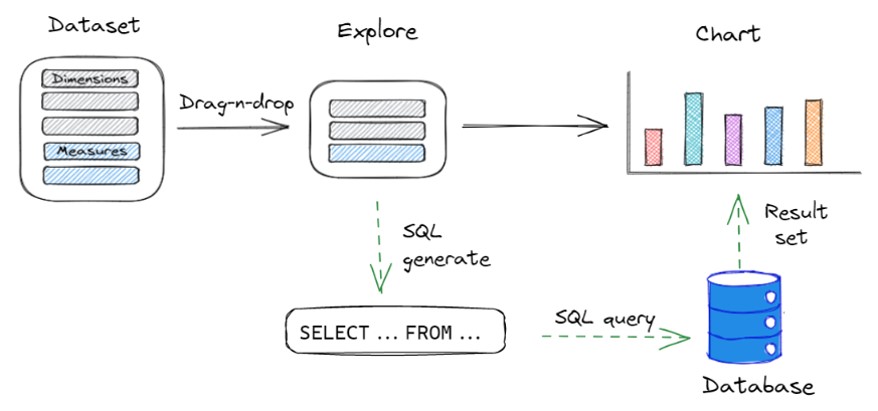
Behind the scene, Holistics generates queries from user's interactions, and then runs thenm against the database. When the result set is returned from the database, Holistics combines it with the visualization settings to render the result to your browser.
In the following sections, we will walk through some basic concepts to get started with data exploration.
Field Types: Dimensions, Measures
The basic structure for every report consists of dimension and measure fields. Holistics offers two types of fields for data exploration and chart creation:
- Dimensions are non-aggregated data fields displayed in black. Dimensions can be of any data type.
- Measures are aggregated data fields (counting, summing, averaging, etc.). Measures always return a numerical result and are displayed in blue along with a sigma icon.
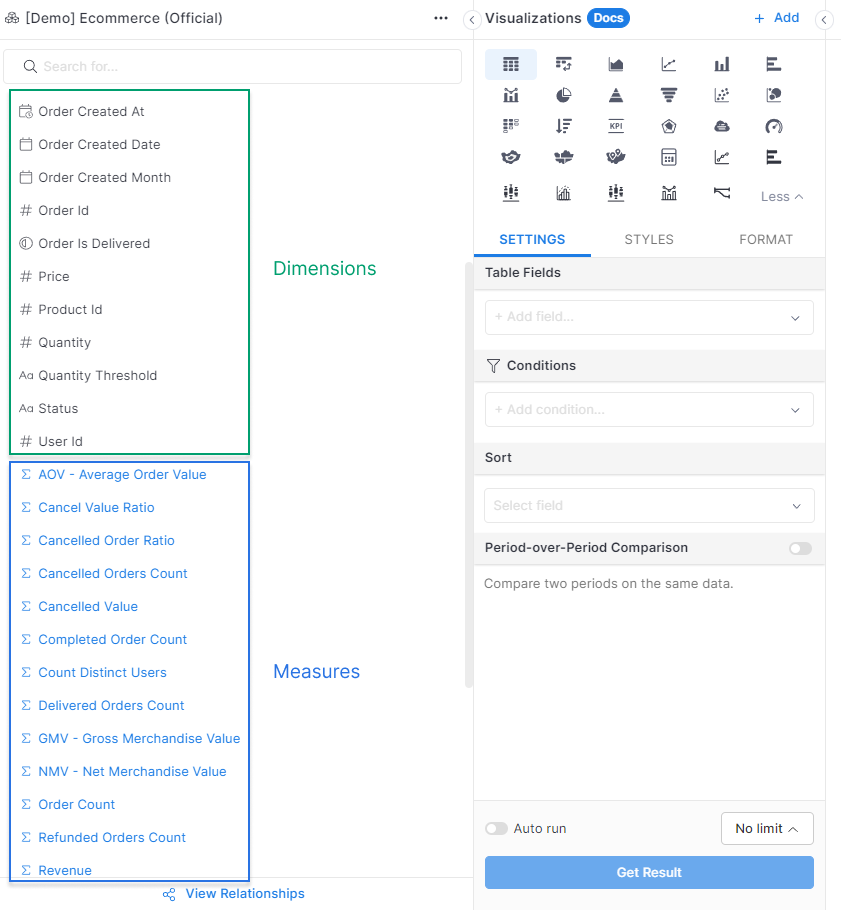
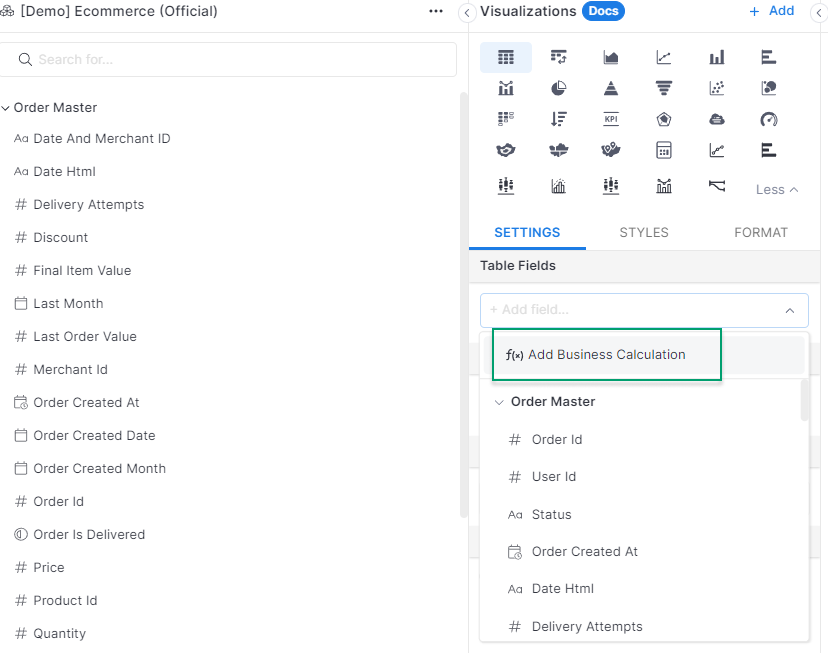
Additionally, you can also Add Business Calculation to create custom fields from the available dimensions and measures.
For more information,, please refer to the Business Calculation page.
Filtering & Limiting Data
Filtering Data
To filter your data while exploring, drag a field into the Conditions area, select a comparison operator, and specify the value to apply.
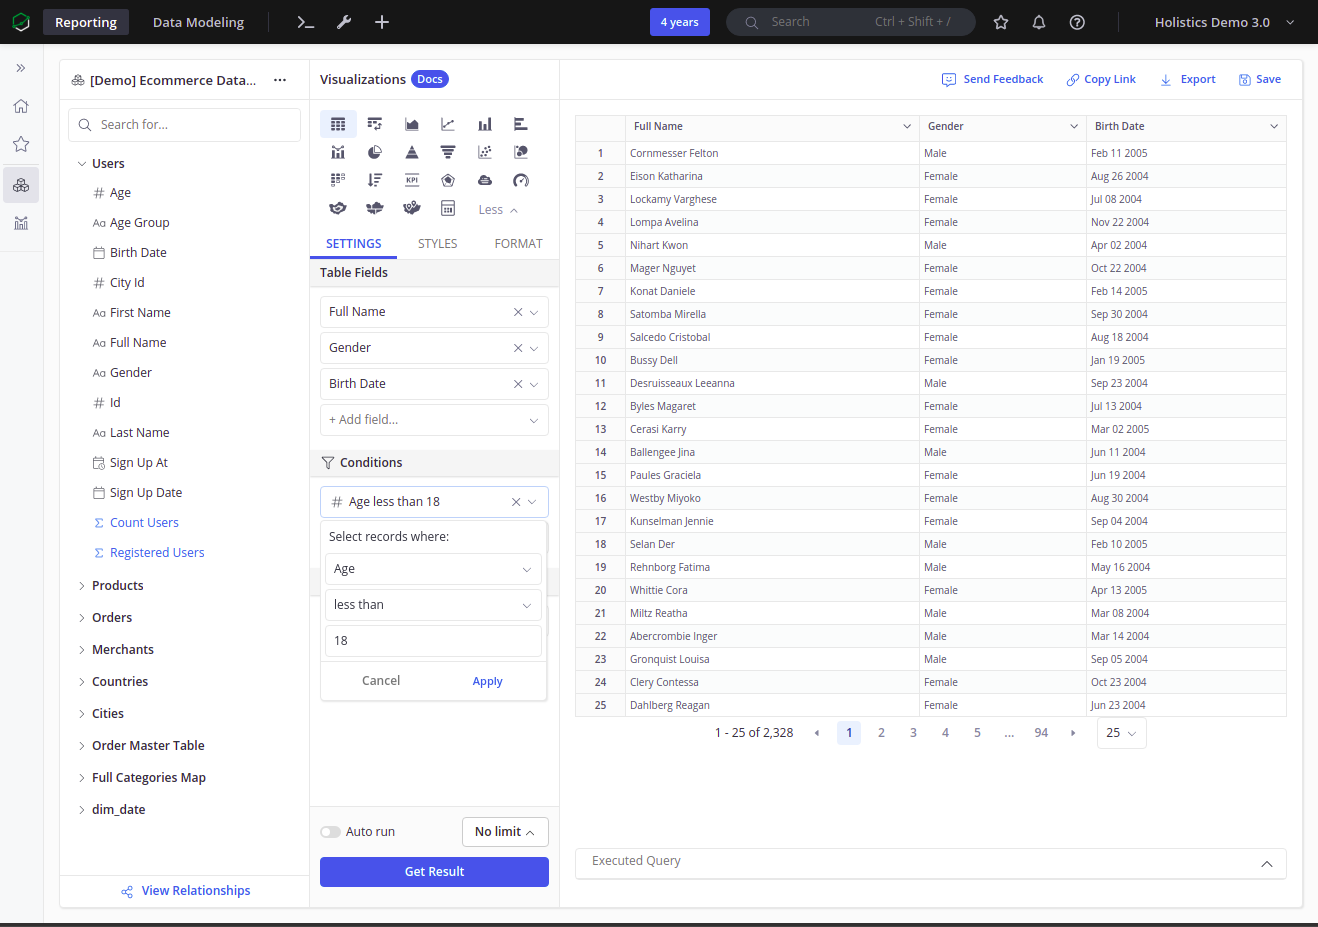
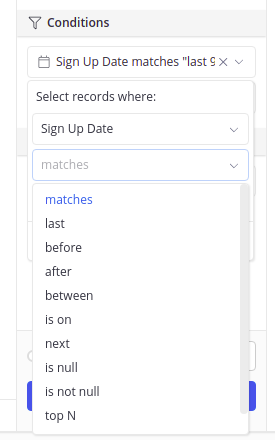
Different field types will have different sets of operators, for example, conditions using a Date field will have operators that are specific for date comparison:
For more on basic filtering operations in Holistics, visit the Filters documentation page
You can also check out the following for more advanced filter features:
Limiting data
Sometimes, to speed up the process of exploring data, you only want to see a subset of your complete results from your query. You can do this in Holistics by using our Row Limit feature:
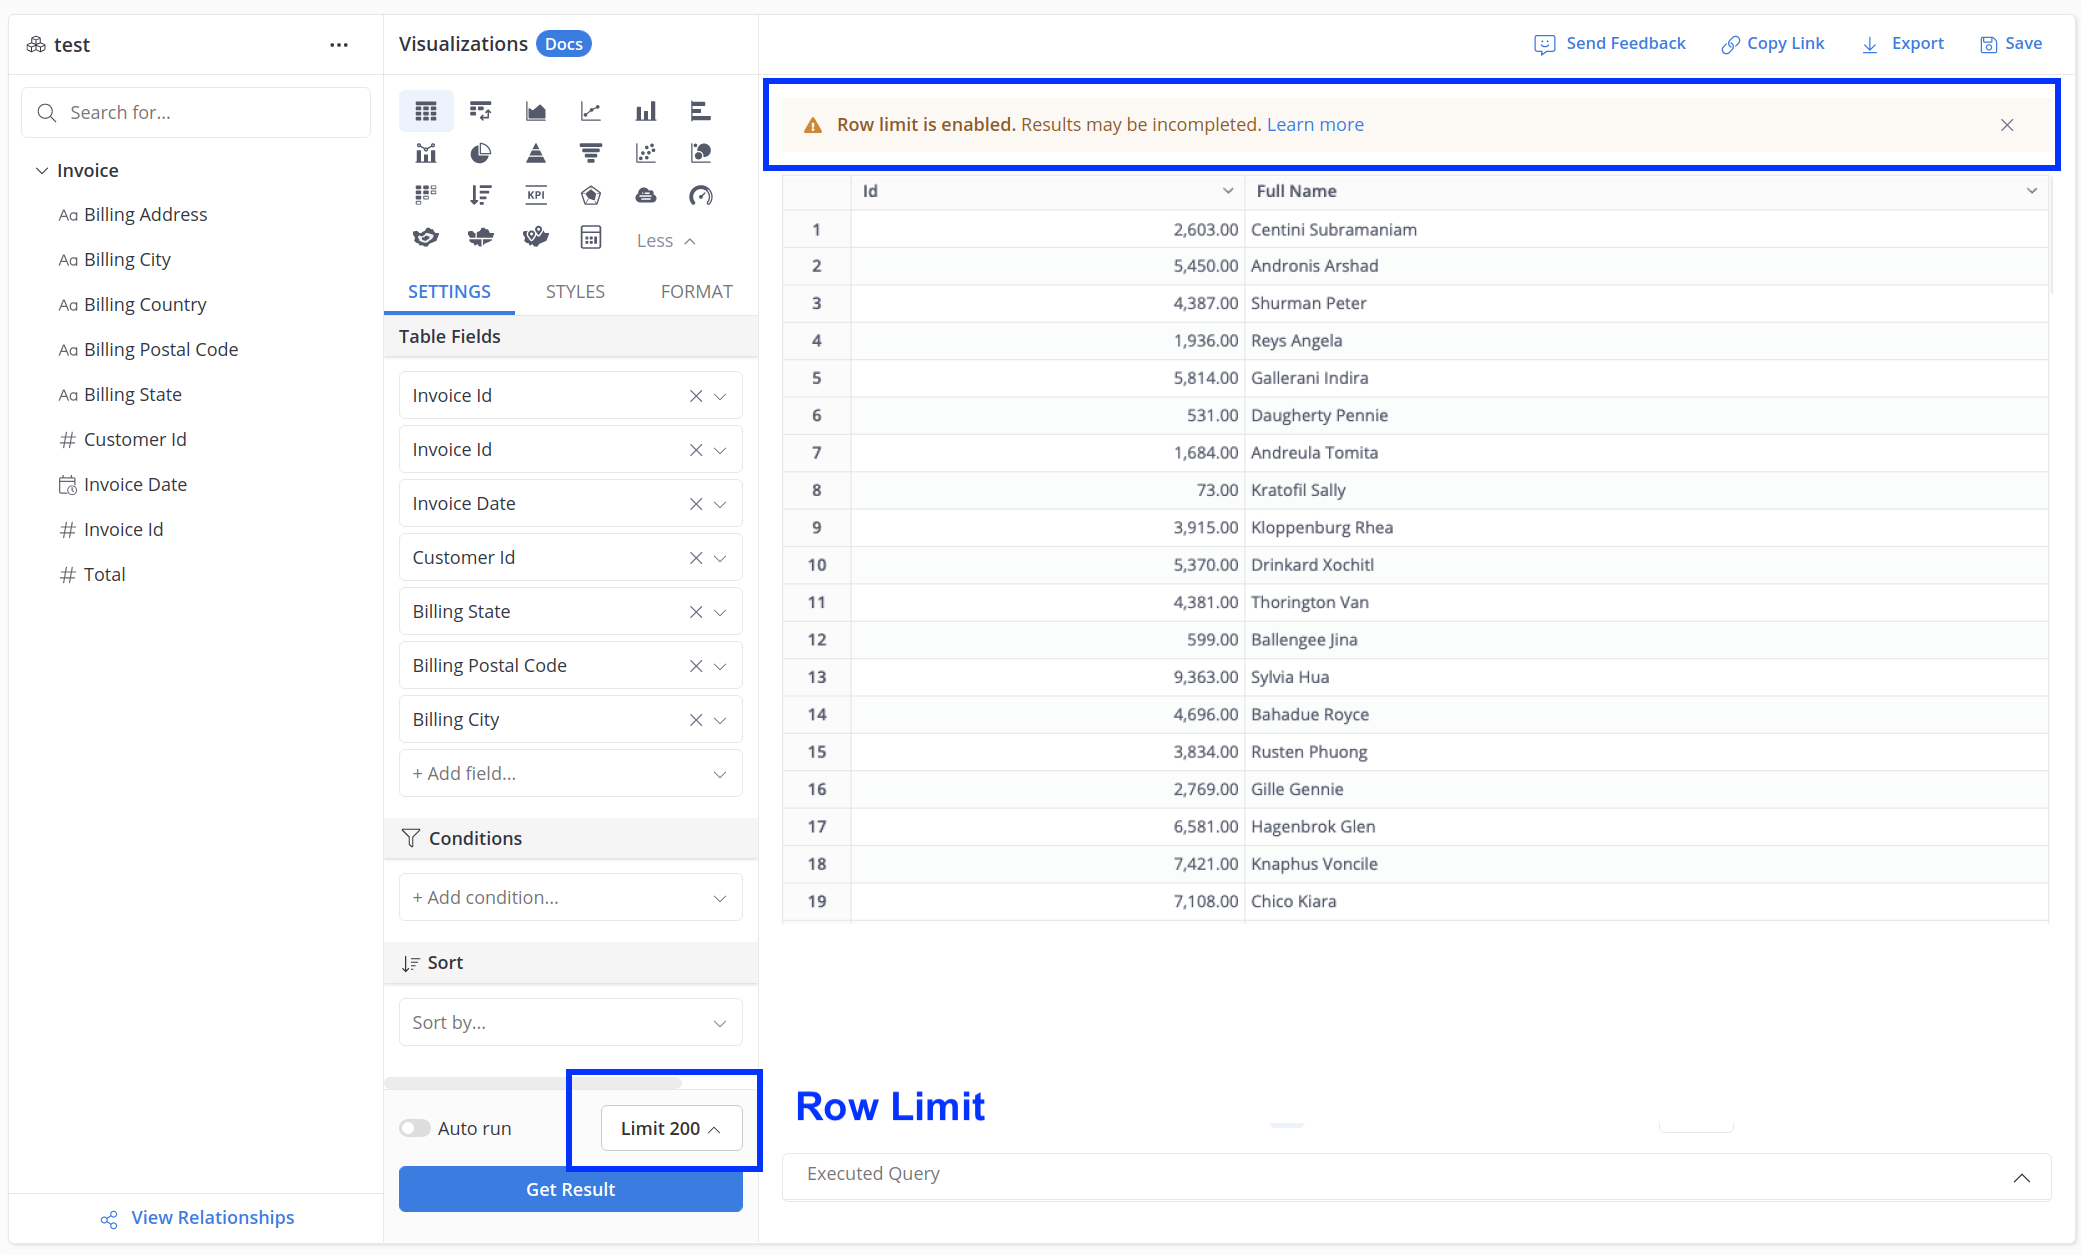
Without a set row limit, Holistics supports up to 1,000,000 rows for Data Exploration / Report Creation and 100,000 rows for Data Modeling Preview. When you apply a row limit, Holistics displays the specified number of rows, notifying you of incomplete results.
- The Row Limit is directly applied on your query.
- Our sort order is important in these situations: Holistics will first applies the limit, and then applies the sort. For more detail, please refer Sorting data page.
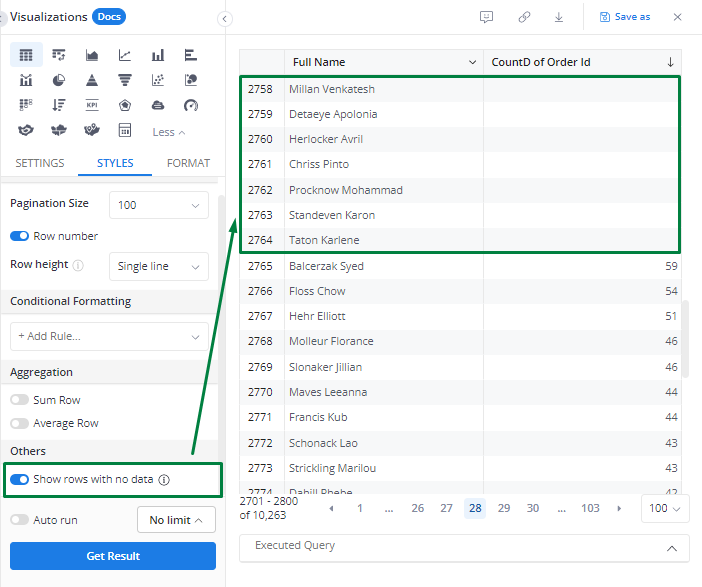
Show Items with No Data
By default, Holistics will not present items with no data when exploring the dataset.
For example, you have 2 models users and orders, the relationship between them is 1 to many. If you want to understand how many orders each user has, you will add in 2 fields: users.name and count(orders.id). However, we will exclude users that have not made any purchases.
The Show rows with no data feature let you include data rows and columns that don't contain measure data (blank measure values).
How to set up?
In order to include items with no data, you can toggle on the option Show rows with no data
under STYLE > Others in our Visualization Settings. Please refer to the video below:
You might also want to check out how to show rows with no data when applying filter. Please refer to this documentation.