
The Goldilocks Rule of Getting Data Driven
Have you ever played table tennis? Imagine you’re a recreational table tennis player. You’re not great, but you’re not …

Have you ever played table tennis? Imagine you’re a recreational table tennis player. You’re not great, but you’re not …
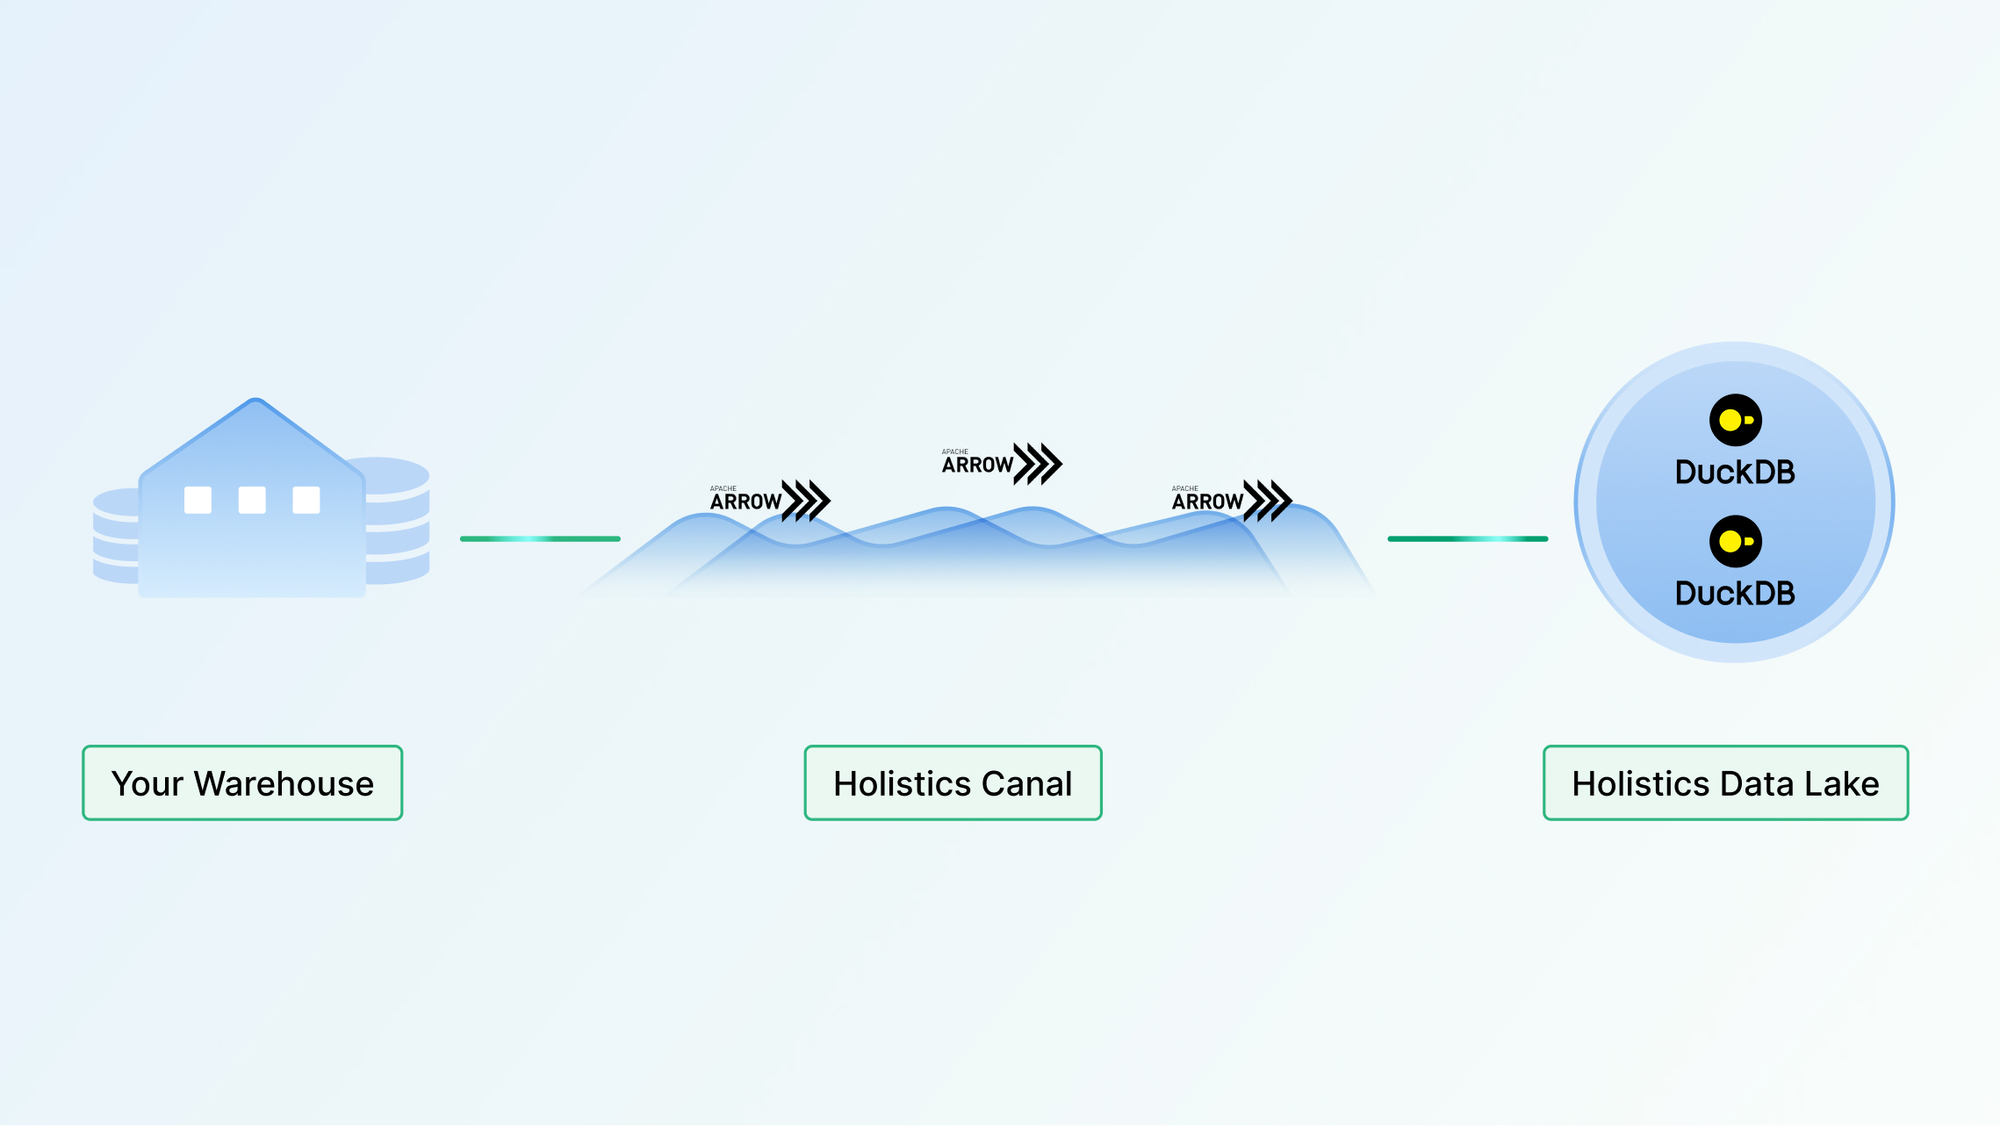
Canal aims to provide much better performance, maintainability, and scalability throughout Holistics querying operations.
Numbers aren't all created equal; they fall into four distinct categories known as data scales. Understanding this, you'll learn how to handle each type correctly to make your data work for you.
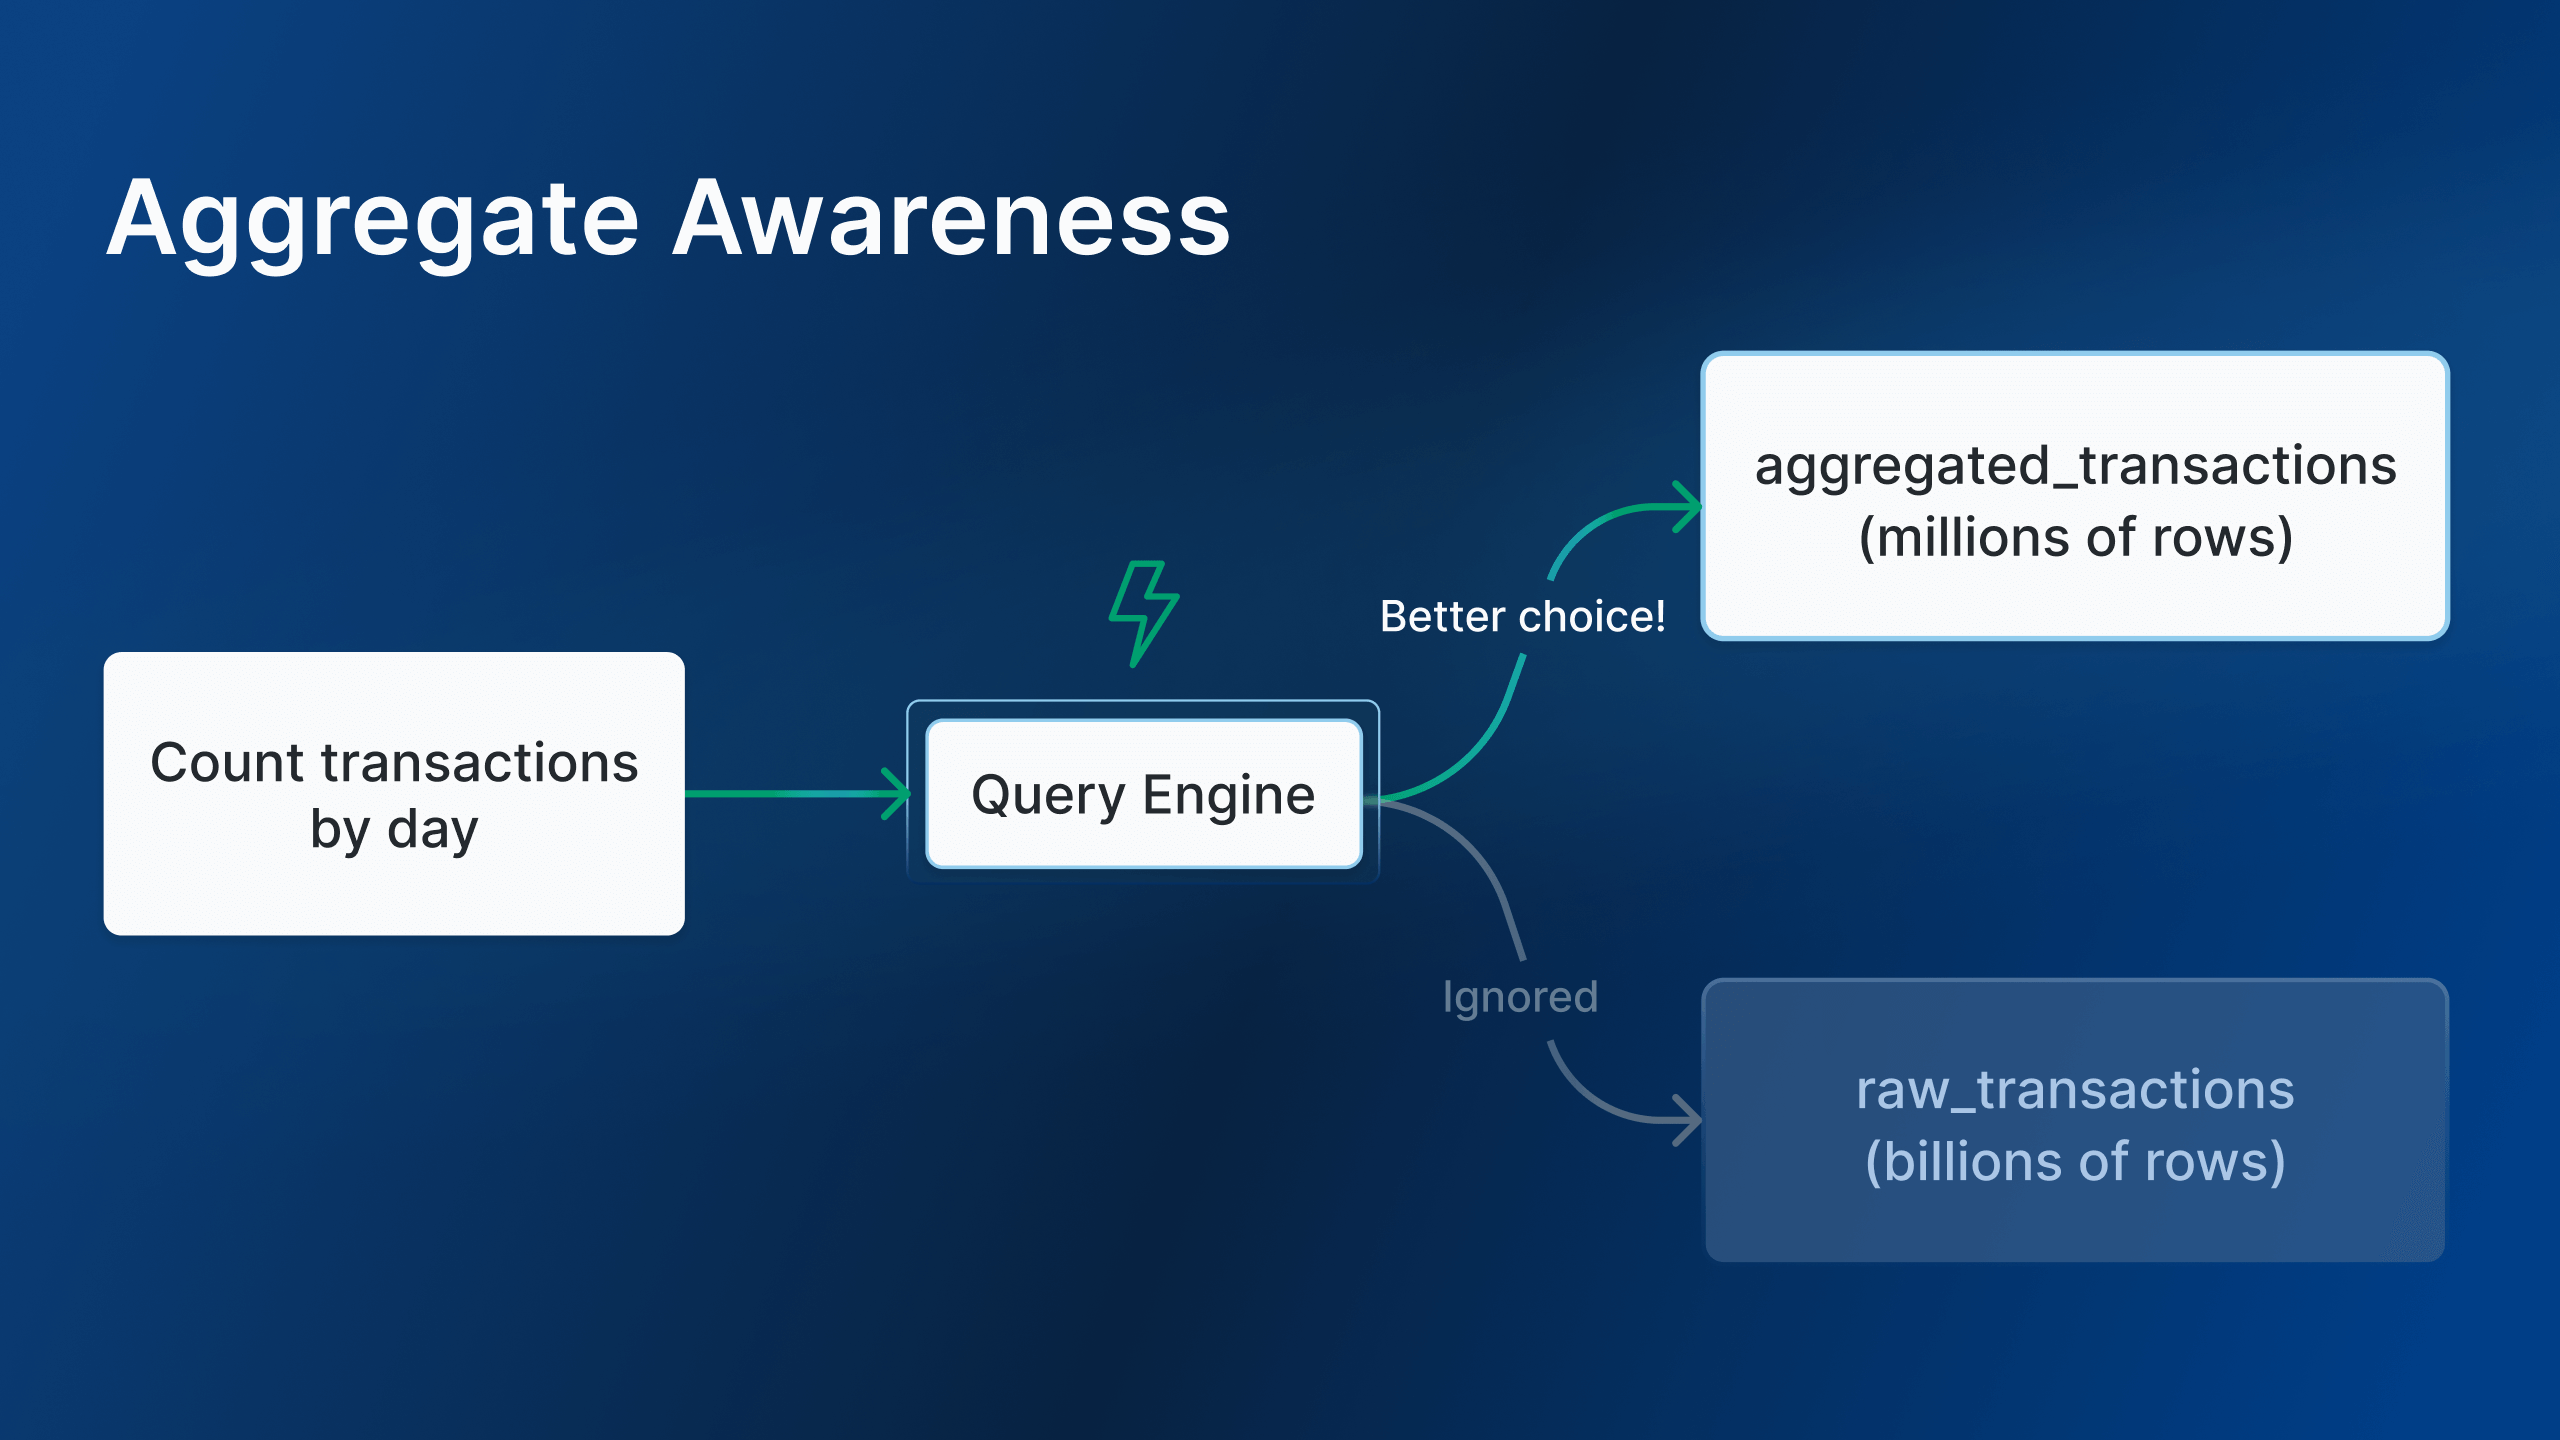
Automatically pick the most optimal aggregated tables per each query for maximal query performance.
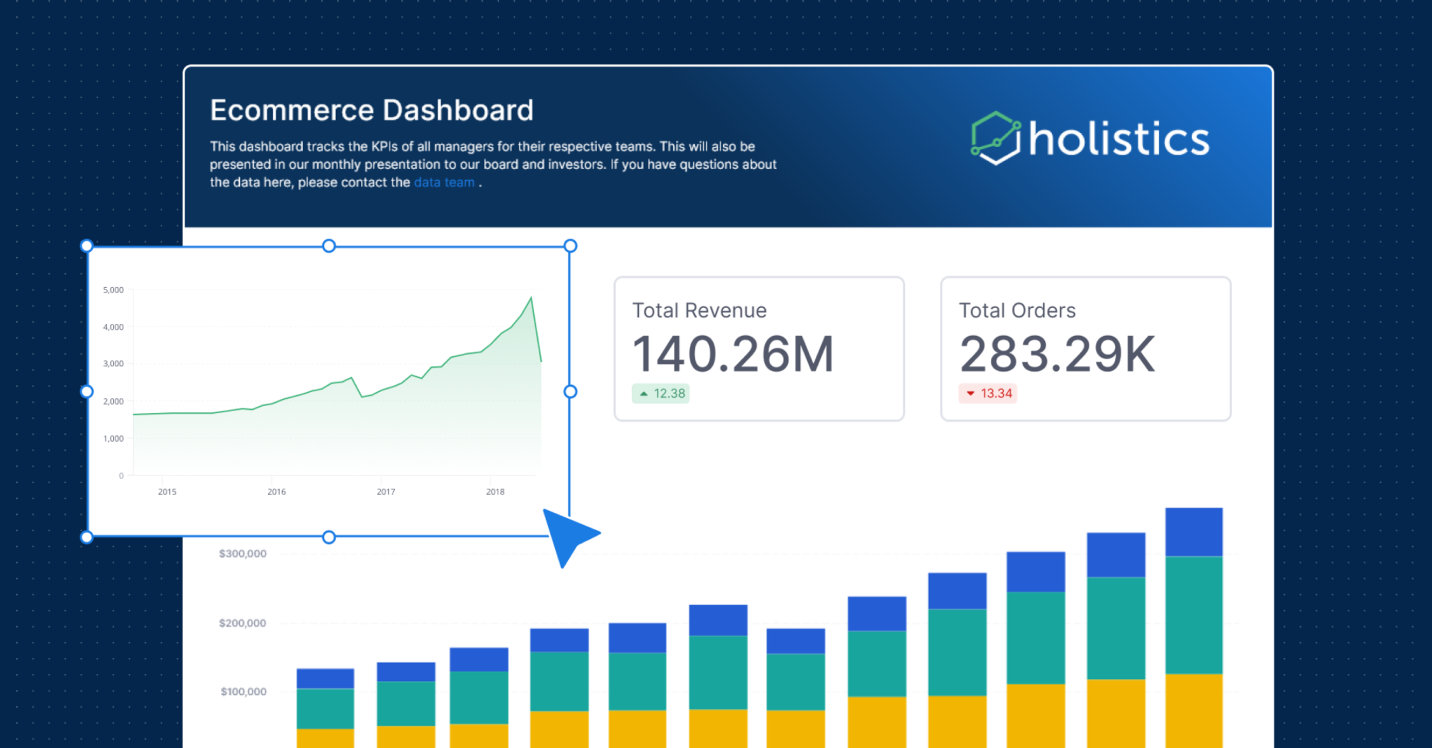
Turn rigid dashboards into living documents, rich with interactivity, business context, and storytelling.
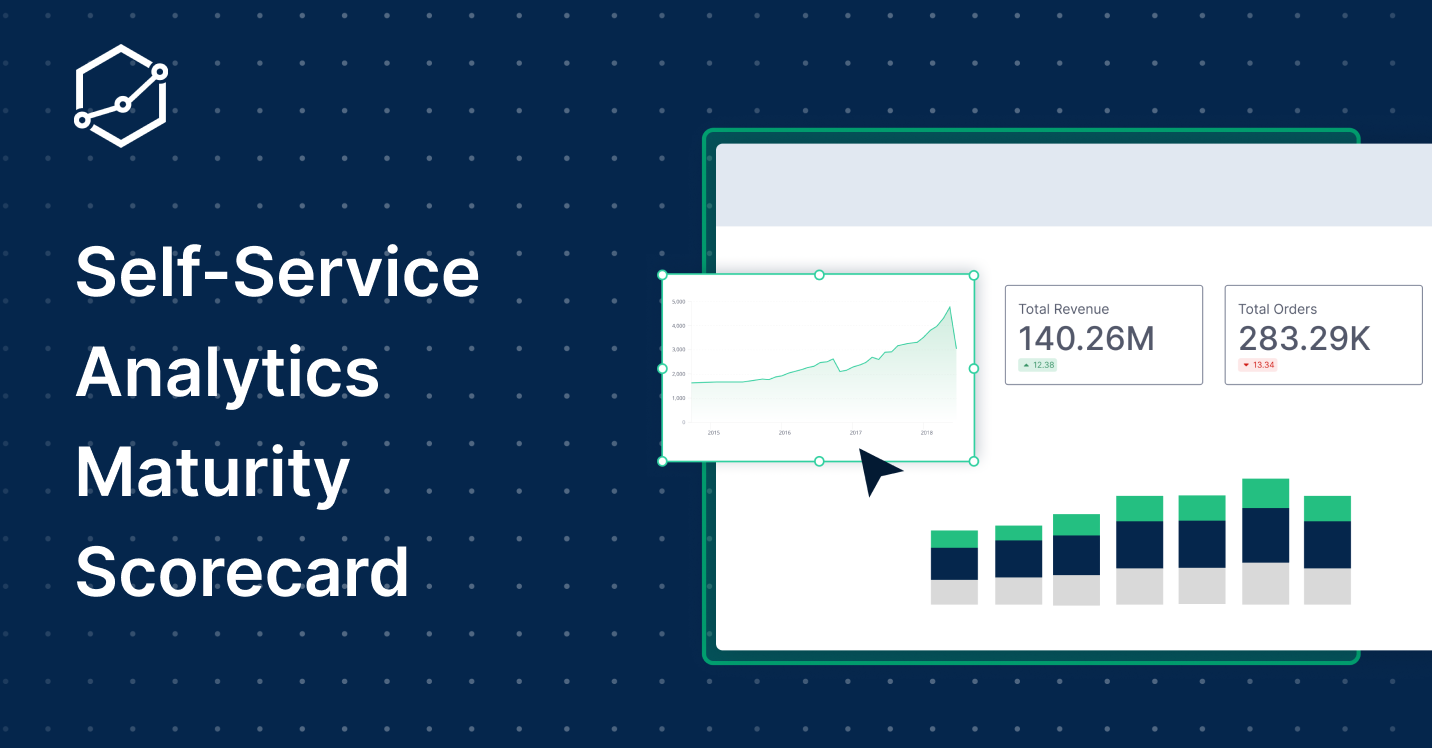
The industry seems split on what "self-service analytics means". Benn Stancil suggests it's more of a "feeling, …
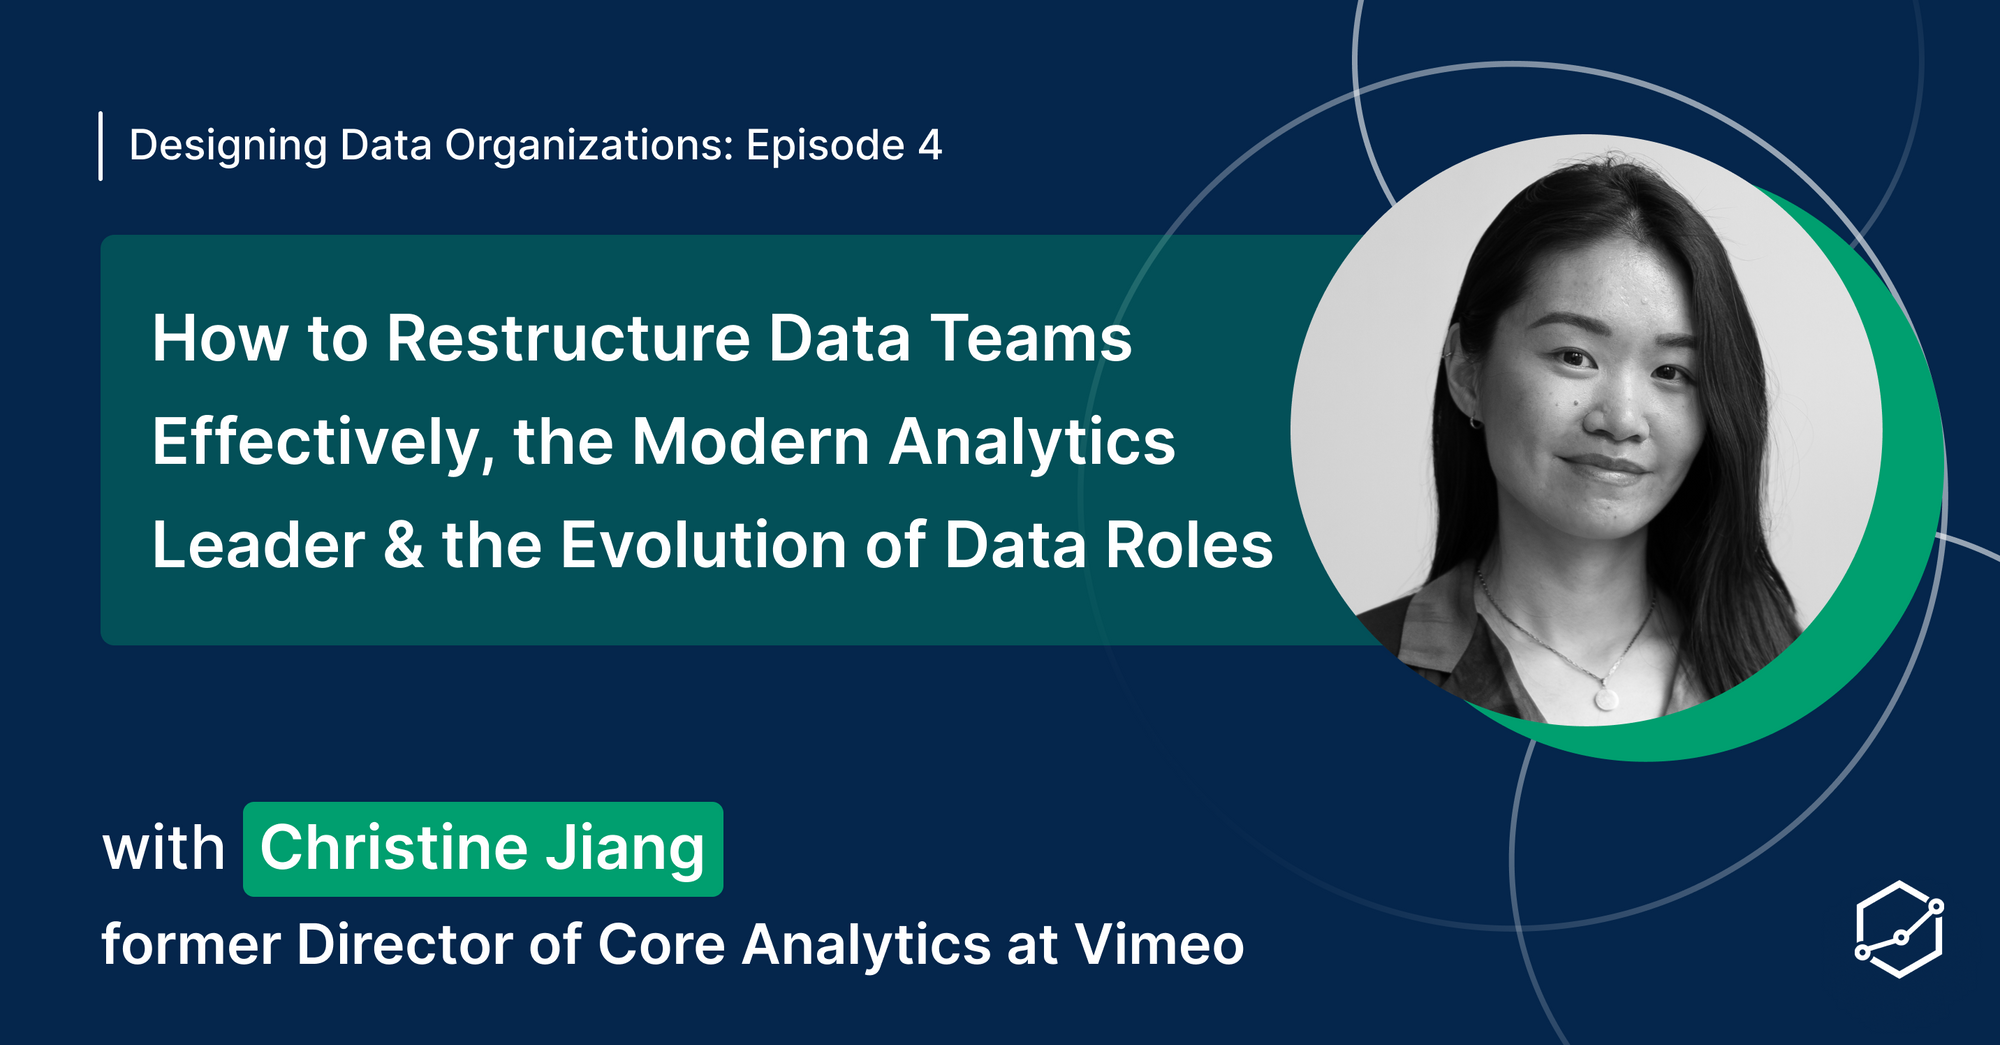
For this week’s episode of Designing Data Organizations, we spoke with Christine Jiang, former Director of Core Analytics at Vimeo, who was with the organization between 2020 and 2024.
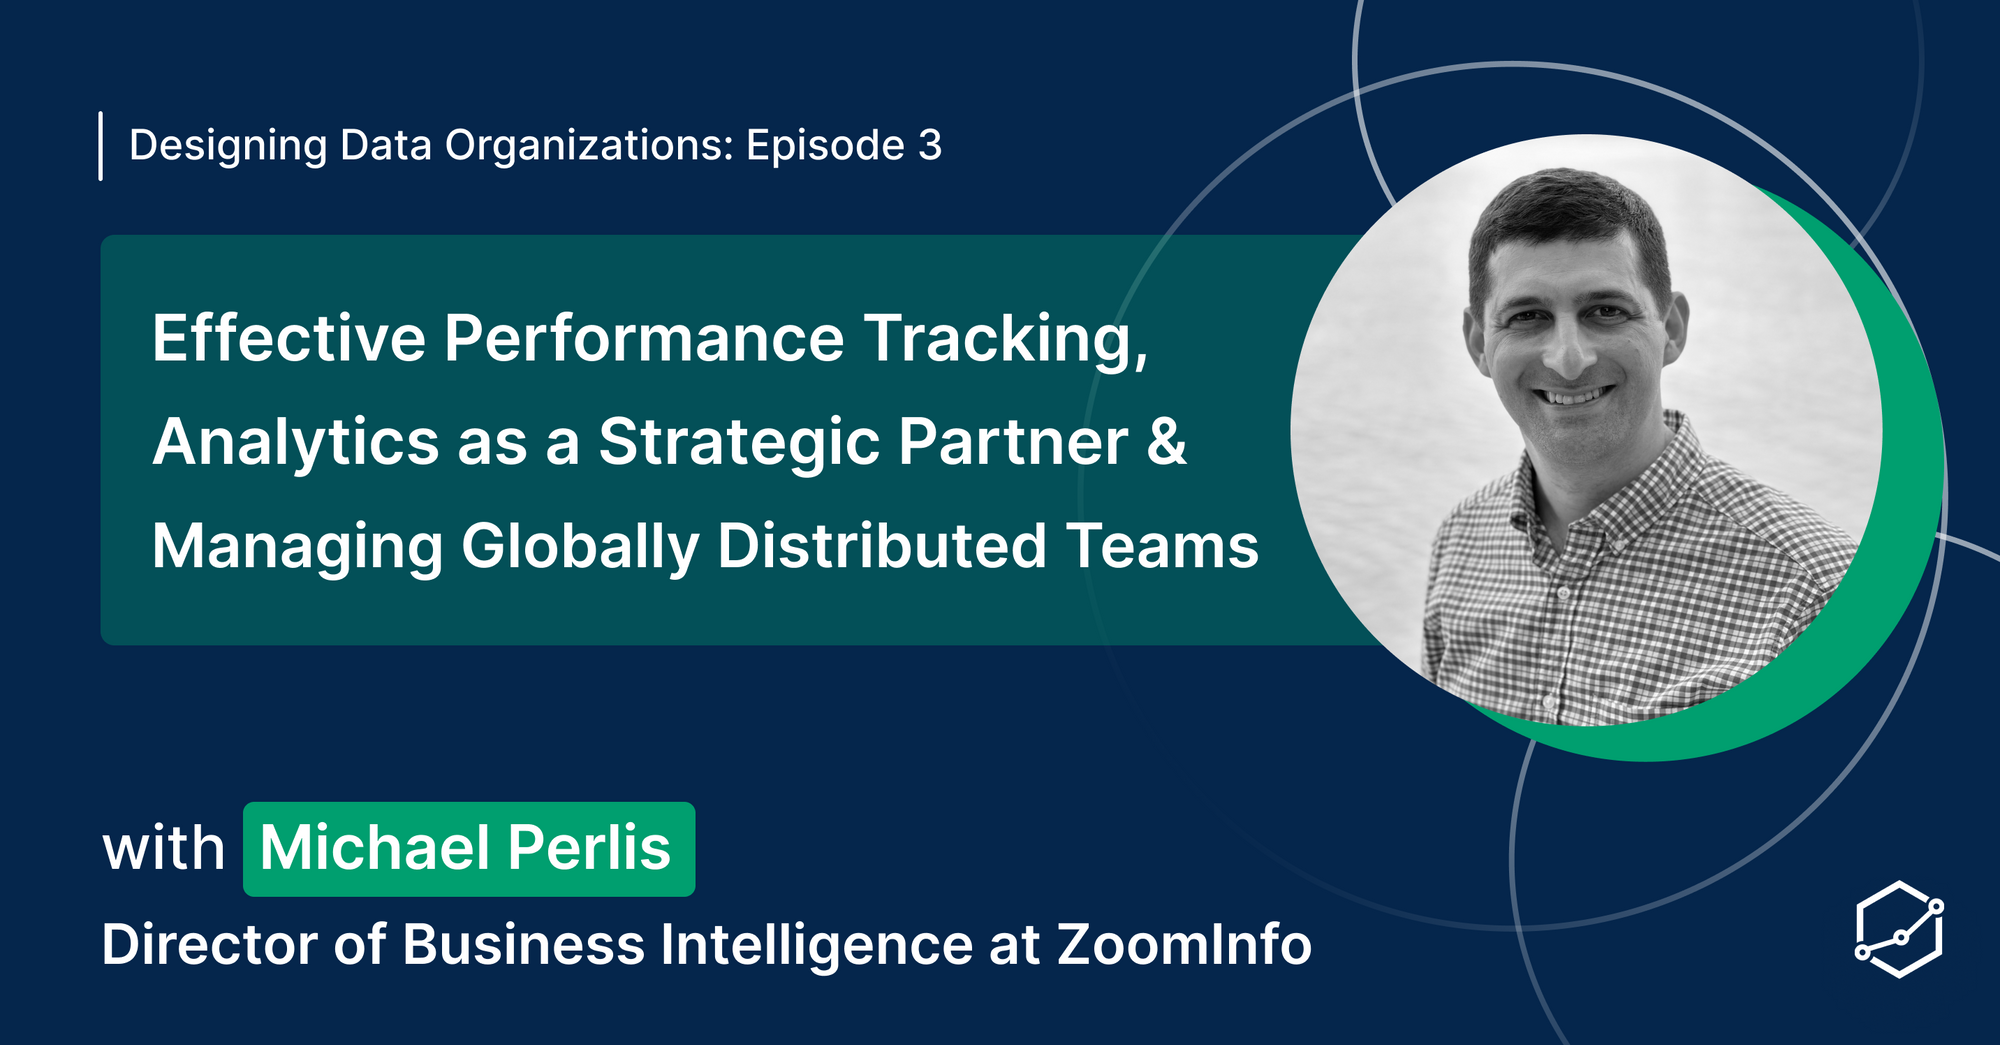
Designing Data Organizations is brought to you by Holistics, where we delve into the intricate process of creating and optimizing data teams within organizations.
If you have dabbled in the Software Engineering world, you may think this post is about the catchphrase: “Composition over Inheritance” and …
A concise tour of one of the basic components of Kimball dimensional data modeling. We explore the three types of fact tables, and then analyze why they have lasted the test of time.
Designing Data Organizations is brought to you by Holistics, where we delve into the intricate process of creating and optimizing data teams within organizations.
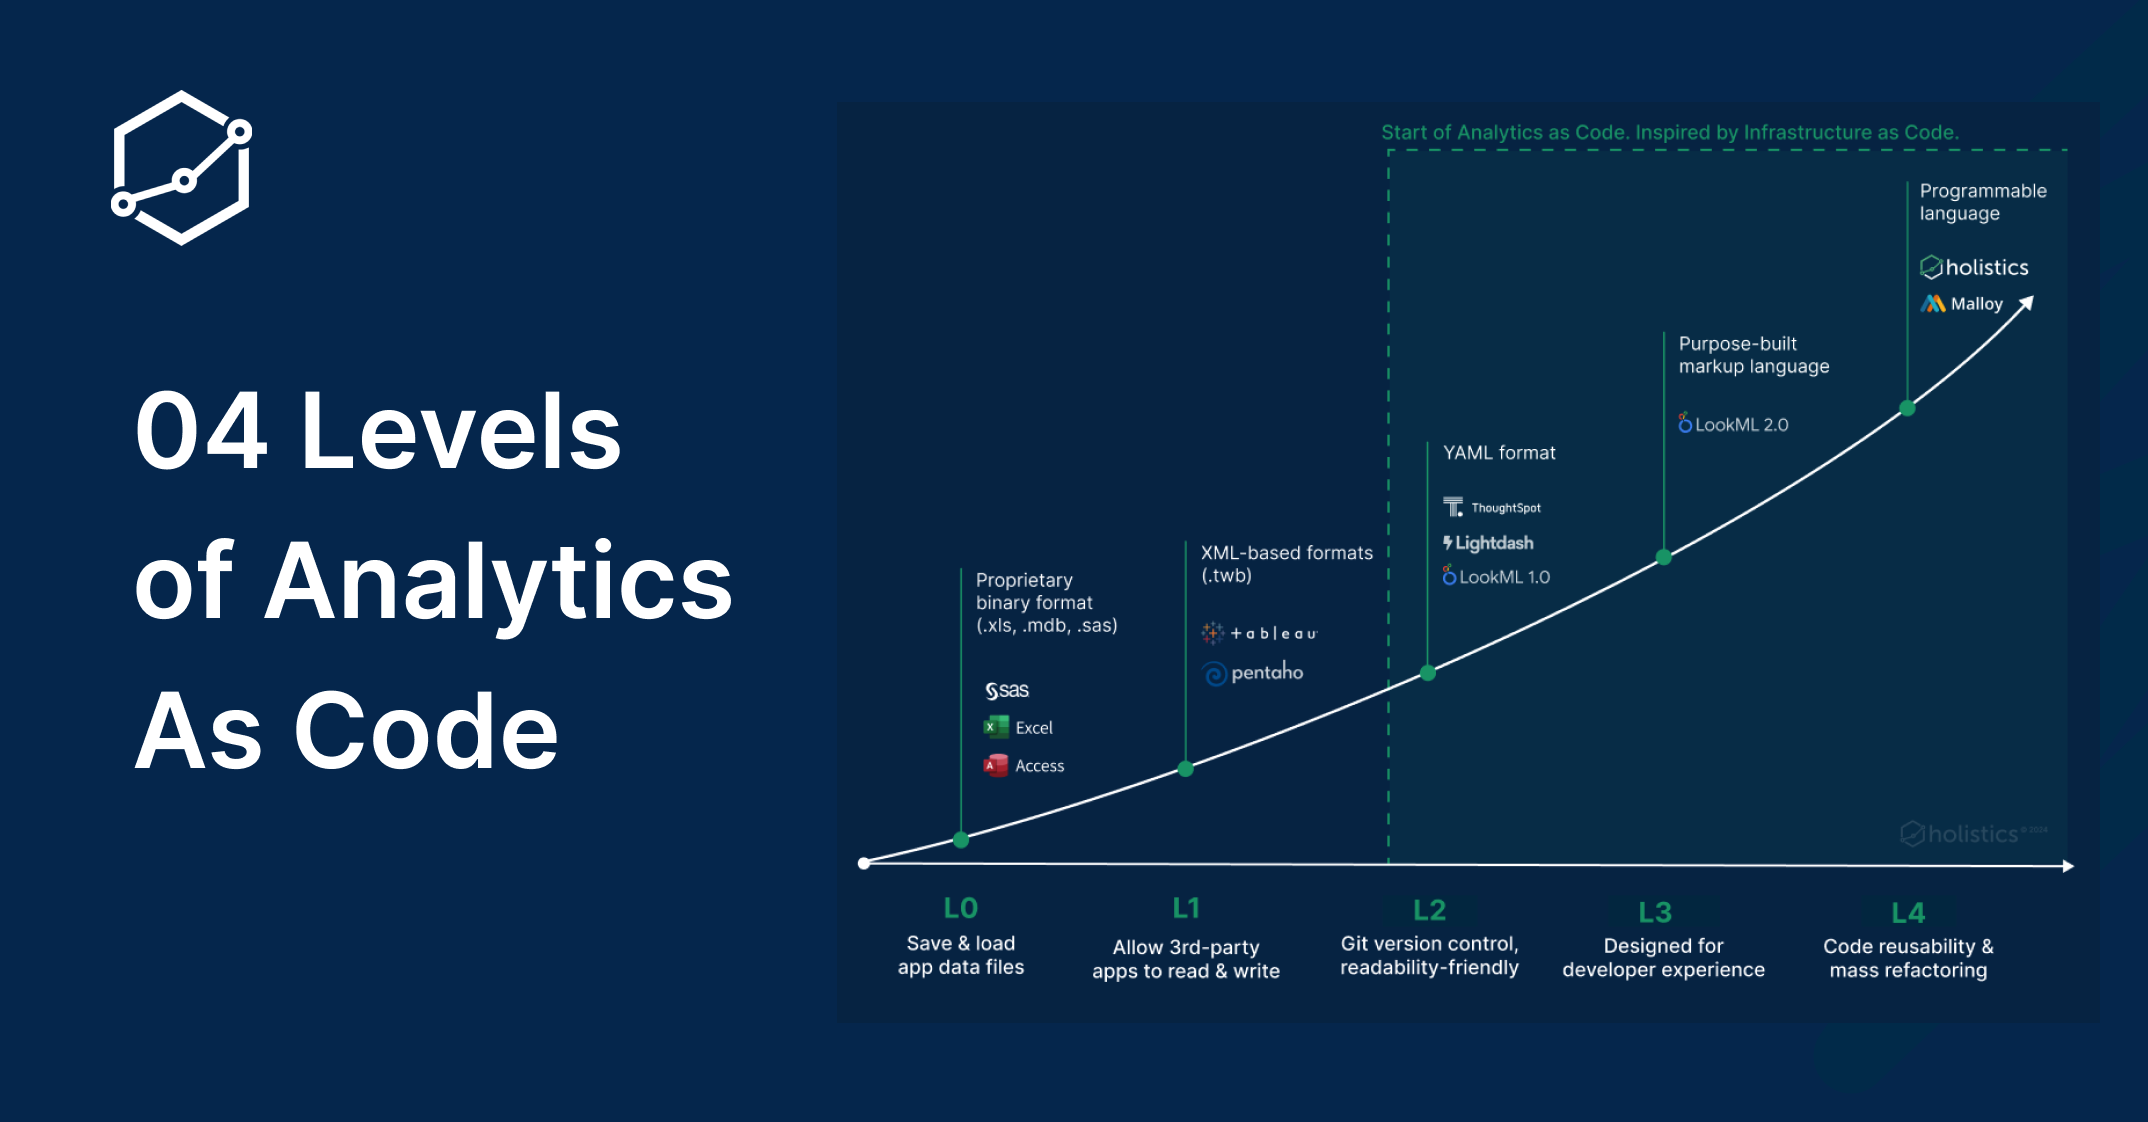
How did Analytics-as-Code evolve? We explain the history behind the movement, and present the 4 levels of analytics as code over the years.
Designing Data Organizations is brought to you by Holistics, where we delve into the intricate process of creating and optimizing data teams within organizations.
As of this article’s publication, over 15,000 data and analytics professionals have been laid off since January 2022.* The job …
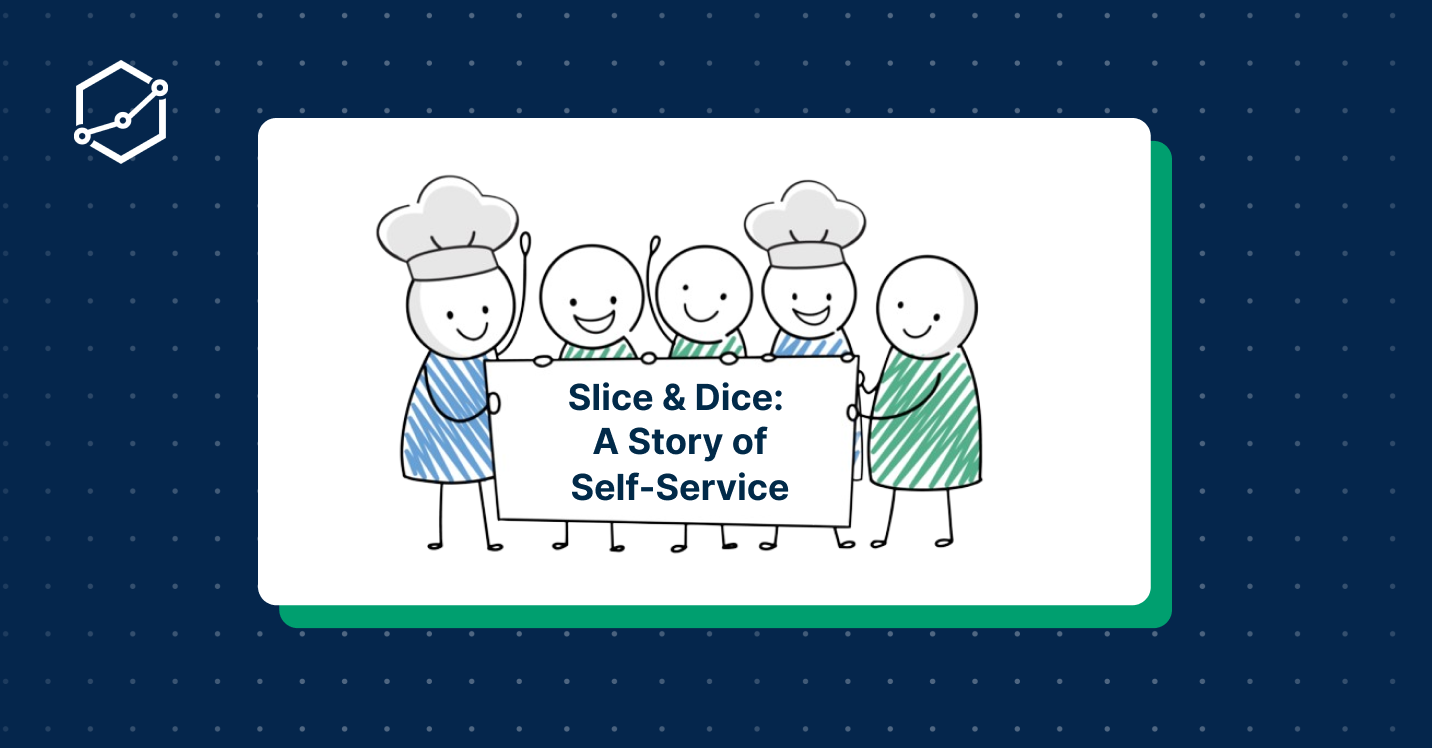
What self-service analytics is, and why it is important. Explained using a story of a pizza restaurant. If you enjoyed this comic …
Are dashboards really 'dead'? A response to a vendor trend that seems rather premature.
Treating your dashboards like a product means thinking about ALL of your user's needs — rational or otherwise.
10 practical tips/strategies I extracted myself when doing analytics case study as part of job interview process.
In actual business conversations, the metric's form is sometimes ignored and implicitly understood. Understanding this concept gives you much better clarity in dealing with metrics.
What does the future of self-service business intelligence look like?
Why are so few data analysts get good at business problem-solving?

Building a career in data often means building a career in a business cost center. This isn't necessarily bad. Here's how to think about it.
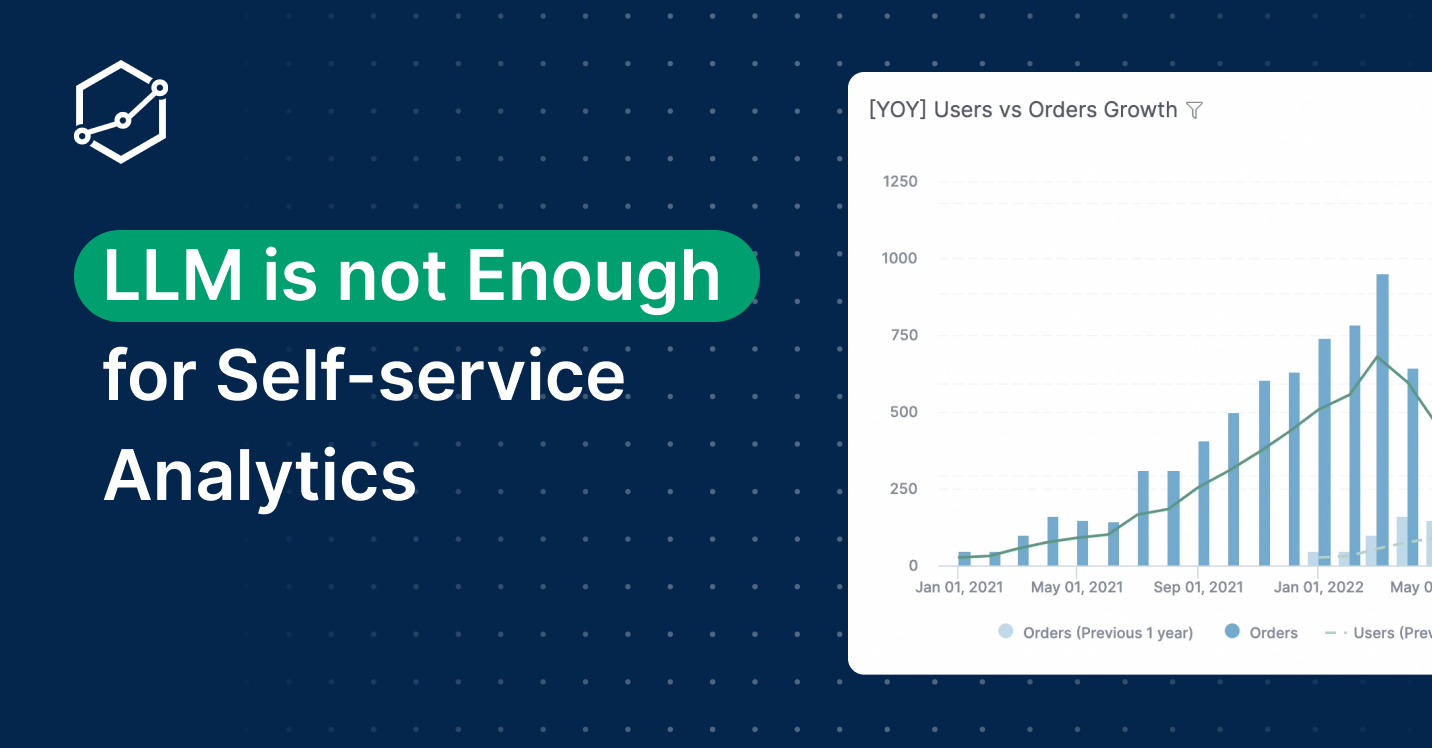
Introduction A few weeks ago, Microsoft announced a new data analytics product called Fabric. One of Fabric’s most exciting features is …

Holistics.io the self-service BI platform, announced that it has achieved Select Tier partner status as part of the Snowflake Partner Network
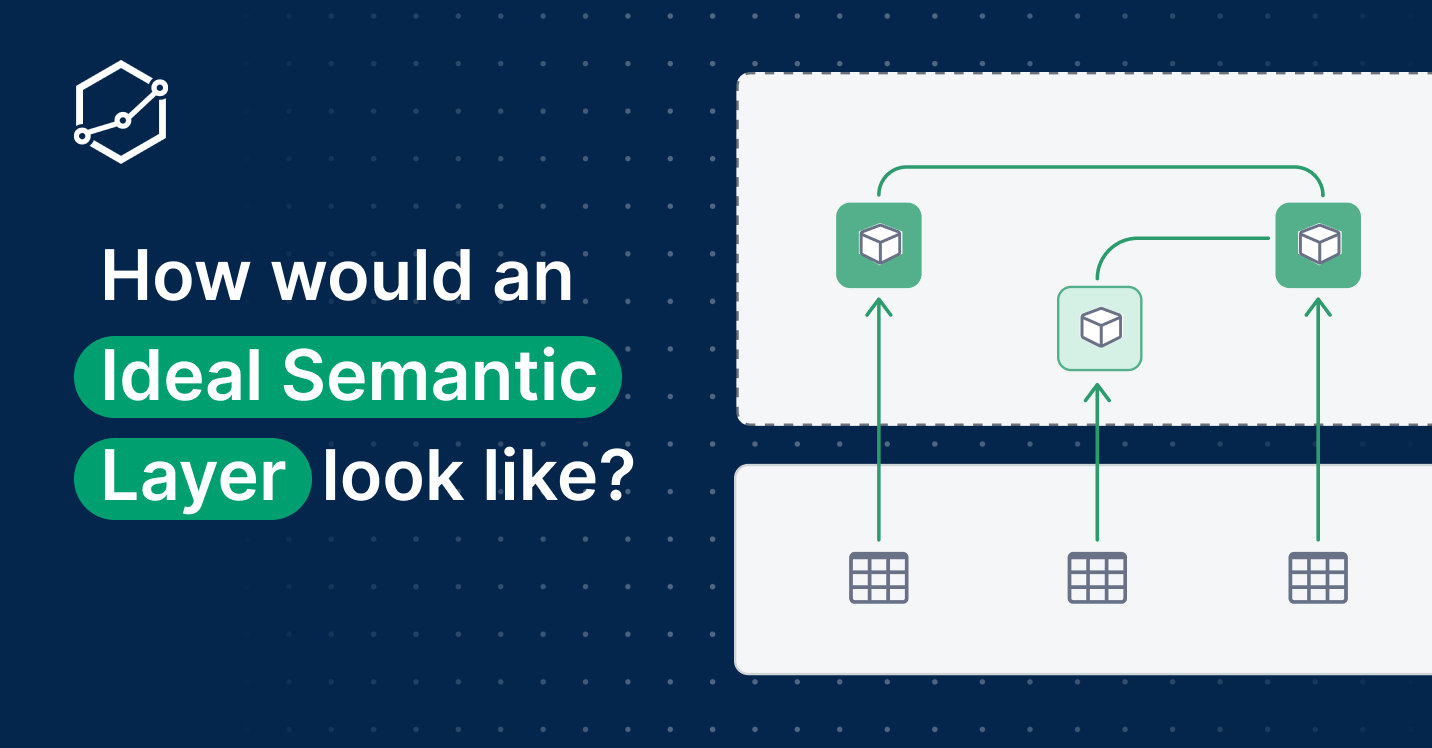
Most data practitioners I talked to agree on two things. * We need an abstraction layer to define metrics consistently and rigorously. * We …

As a provider of business intelligence software, we understand the importance of maintaining the highest standards of security and trust. Our customers …
Data clinic is one of many ways you create value and drive your organization toward better data literacy. Here's how.
As data analysts, we often do lots of work — writing SQL, modeling data, drawing charts, and building data presentations. We spent hours …
Investment analyst is an entry-level investment position. So is data analyst an entry-level data position, too?
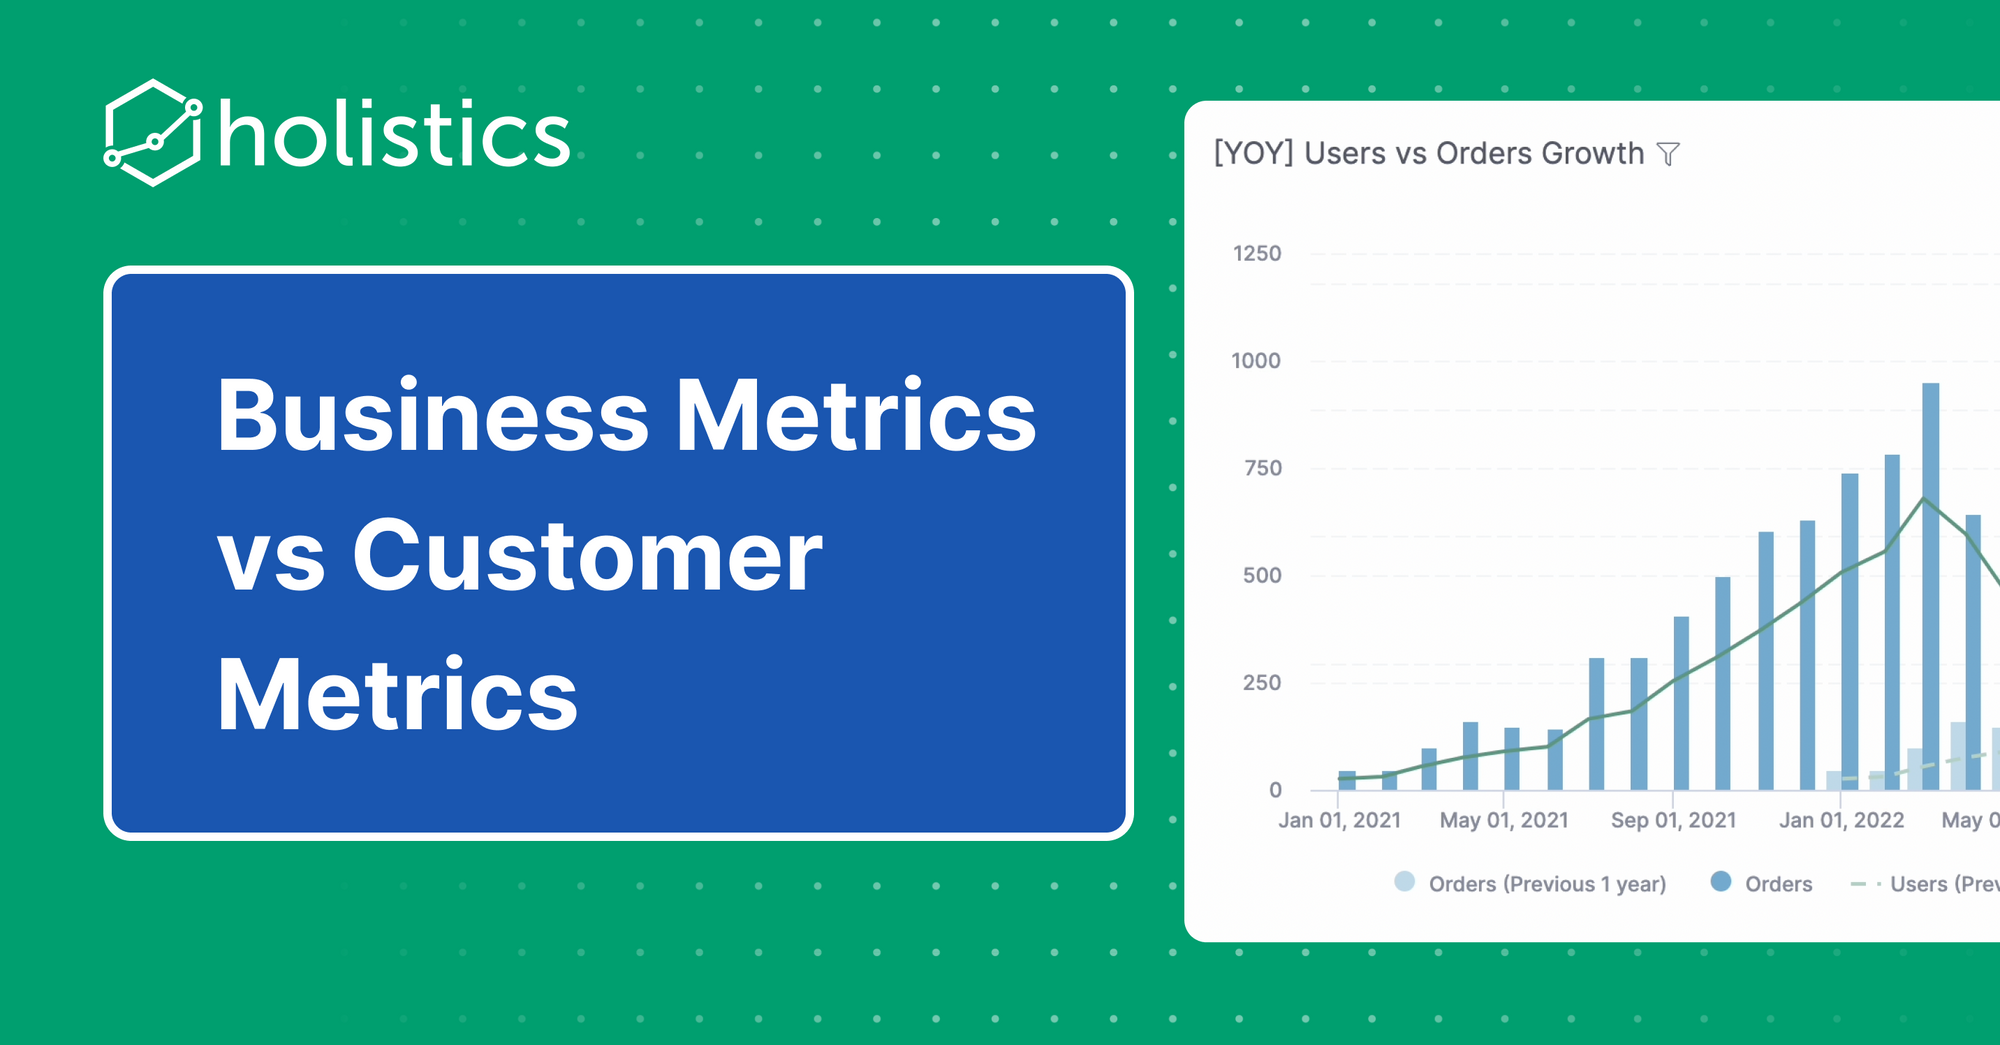
What are the typical metrics that you’d normally look at weekly? If you're like me (a startup founder), you …

This is part two of the “Silos of Data Organization” series. Part one was sent out last week. For this one, let’ …
As a Data Analyst, you usually work with two types of stakeholders: the clients (business users) who ask for data, and the …
A short story about my history with programmatic configuration (or lack thereof) and how it's related to analytics.
We understand that things are getting tougher and tougher during this pandemic but we will not wave the white flag right now. …

The definitive explainer for OLAP cubes, where we cover every single possible definition for the phrase.
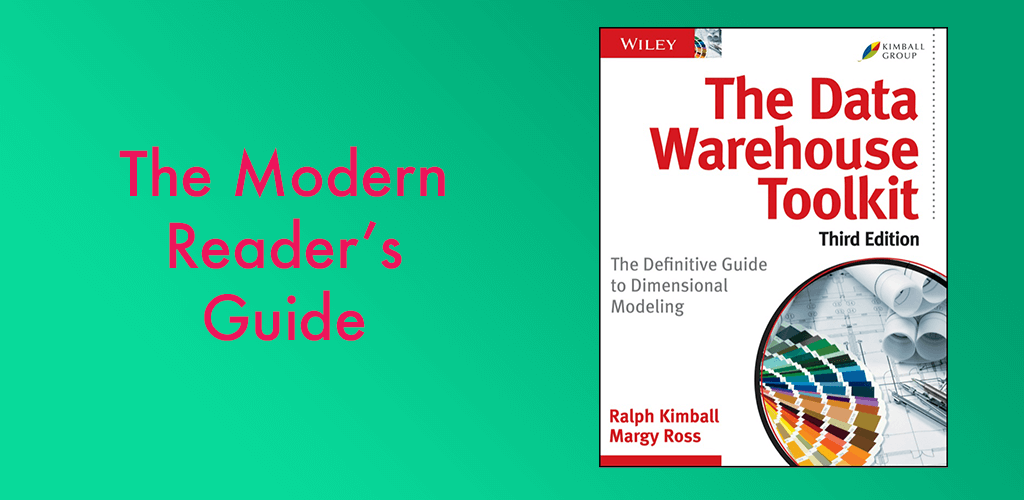
Ralph Kimball's classic book The Data Warehouse Toolkit introduce the world to the practice of data modeling. Here's how to read it in 2022.
A hack for when you don't understand data jargon.
We take a look at an exhaustive list of reasons people give when they want to ignore anomalous data.
How a data person might fit into your company's learning cadence, and what that means for company performance.

The origins and intuition behind a famous SaaS business metric.
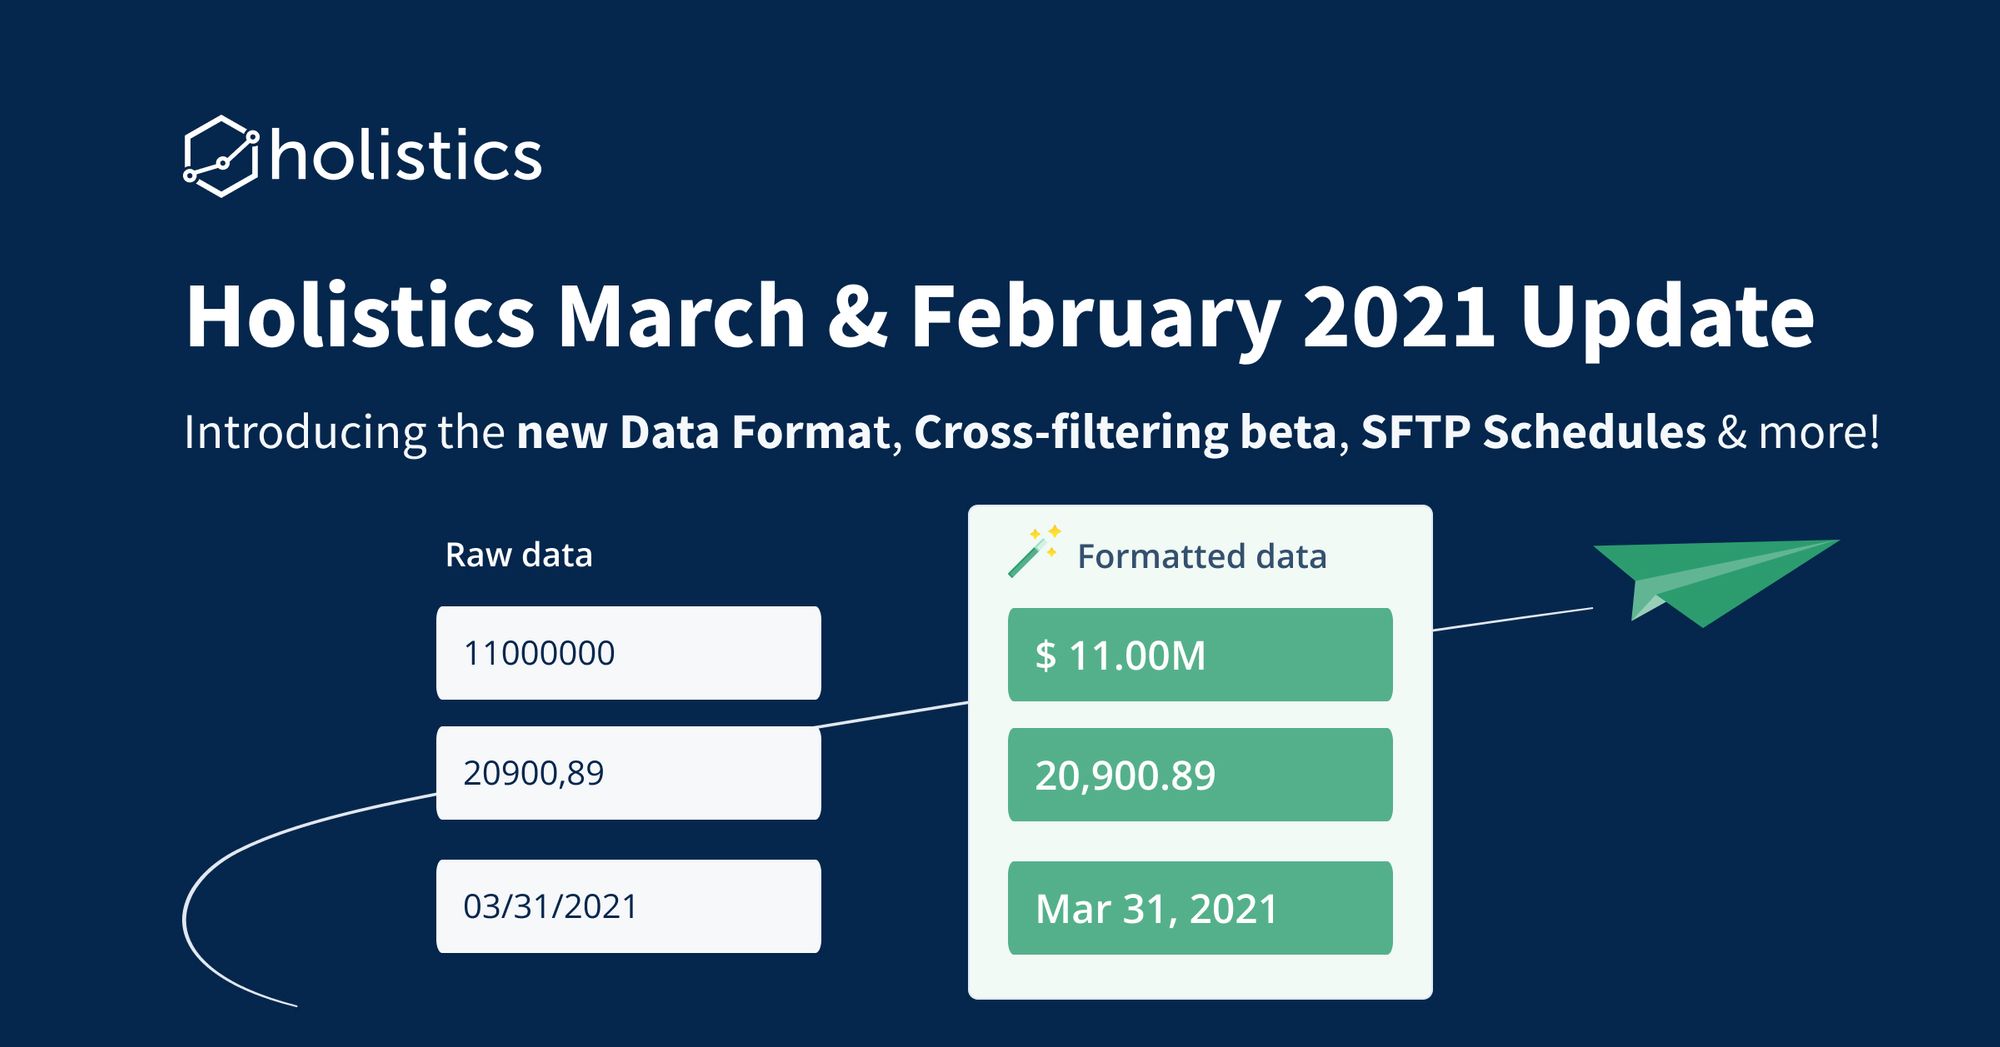
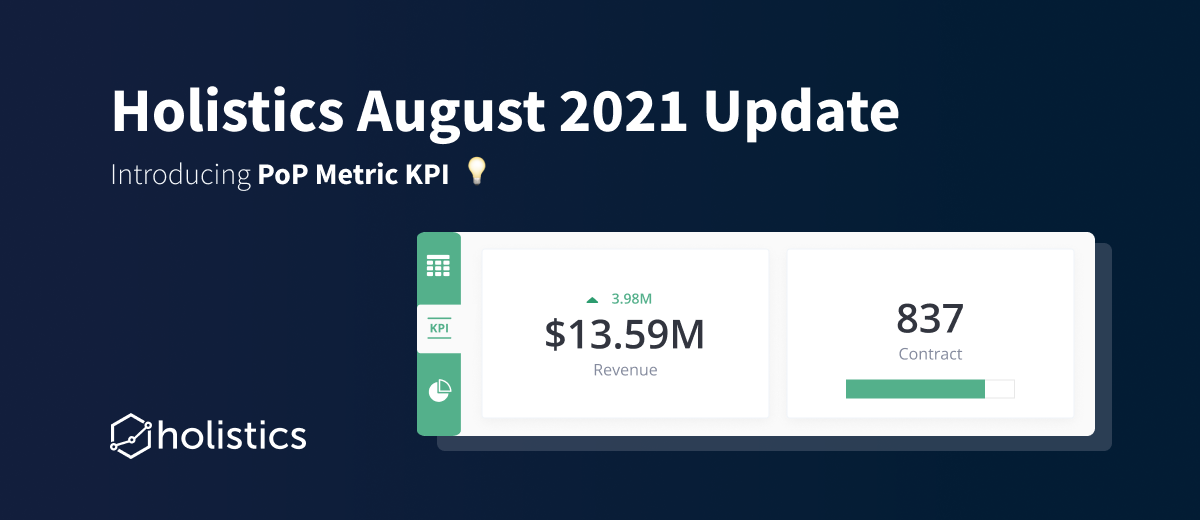
For the past two months, we've been shipping some great features to improve your experience and interactivity inside Holistics.
Why Amazon's notion of measuring controllable input metrics is a lot more profound than you might think.
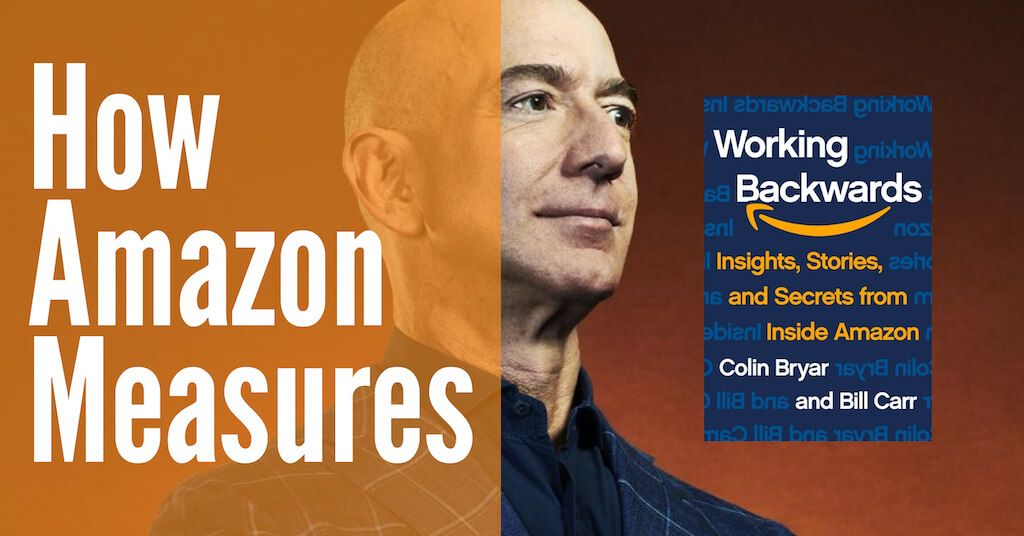
How Amazon uses metrics. A summary of chapter 6 of Working Backwards, the first book to explain how Amazon really works.
Simple data people tricks, a hierarchy of feature stores, and Shreyas Doshi on product metrics.
How Amazon uses input metrics, a data pipeline is a materialized view, and the case against self-service data and analytics.
A quick look at what Snowflake's been up to re: the Data Lakehouse, an inside look at Amazon's data-driven decision making, and how Airbnb customized Superset to fit their needs.

We've shipped 2 new features in January 2021: Bulk actions and Top/Bottom N filters.
The data lakehouse is a thing, Superset is also a thing, and how to make dashboards using a product thinking approach.

Looking for an analytics engineering job in your locale? Read this.

Everything we know and don't yet know about the emerging role of analytics engineering.
Three changes in the data landscape we're investigating over the next few months.
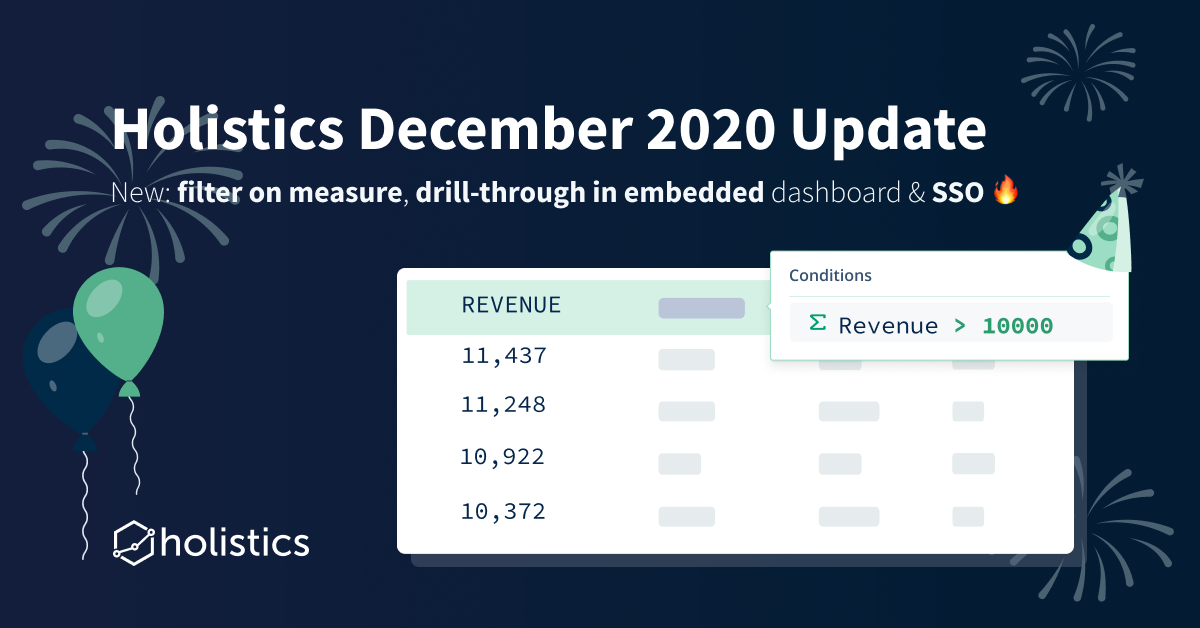
2020 has been a really tough period for people around the world due to COVID-19. Regardless, Here at Holistics, we continue to …

Five quick things we know to be true, written for the end of the year.
Every cool data project has some schlep up front. Here's why it's a good idea to keep that in mind.
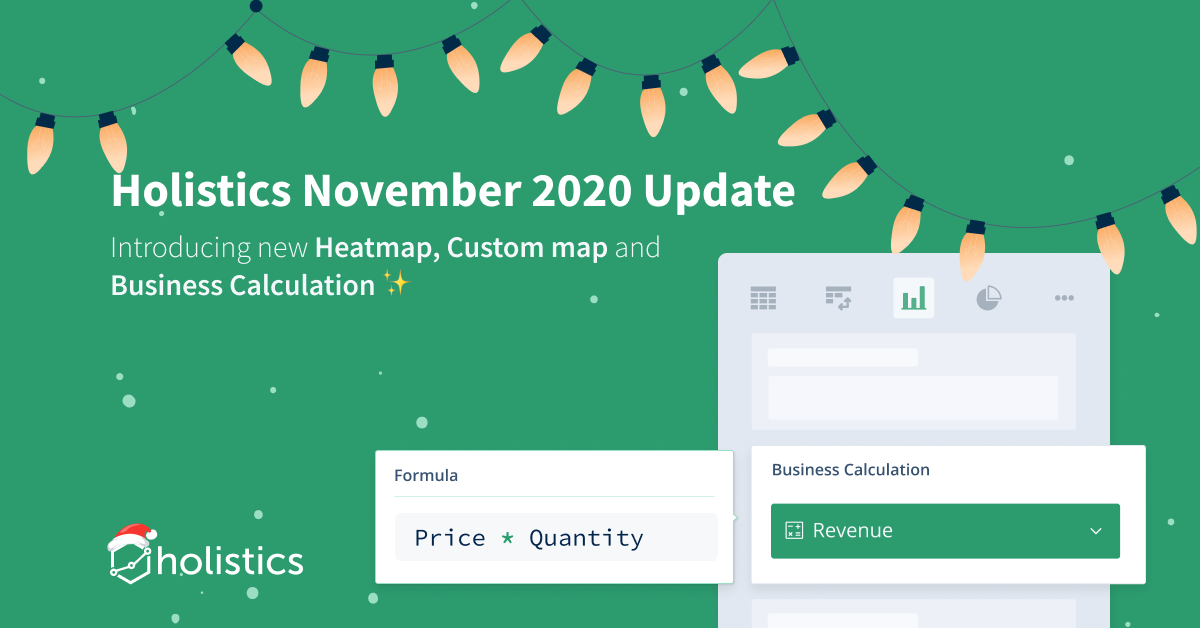
Another festive season is coming! If you haven’t got any plan for the upcoming holidays, here’s our little suggestion: Explore Holistics’ newest features and improvements.
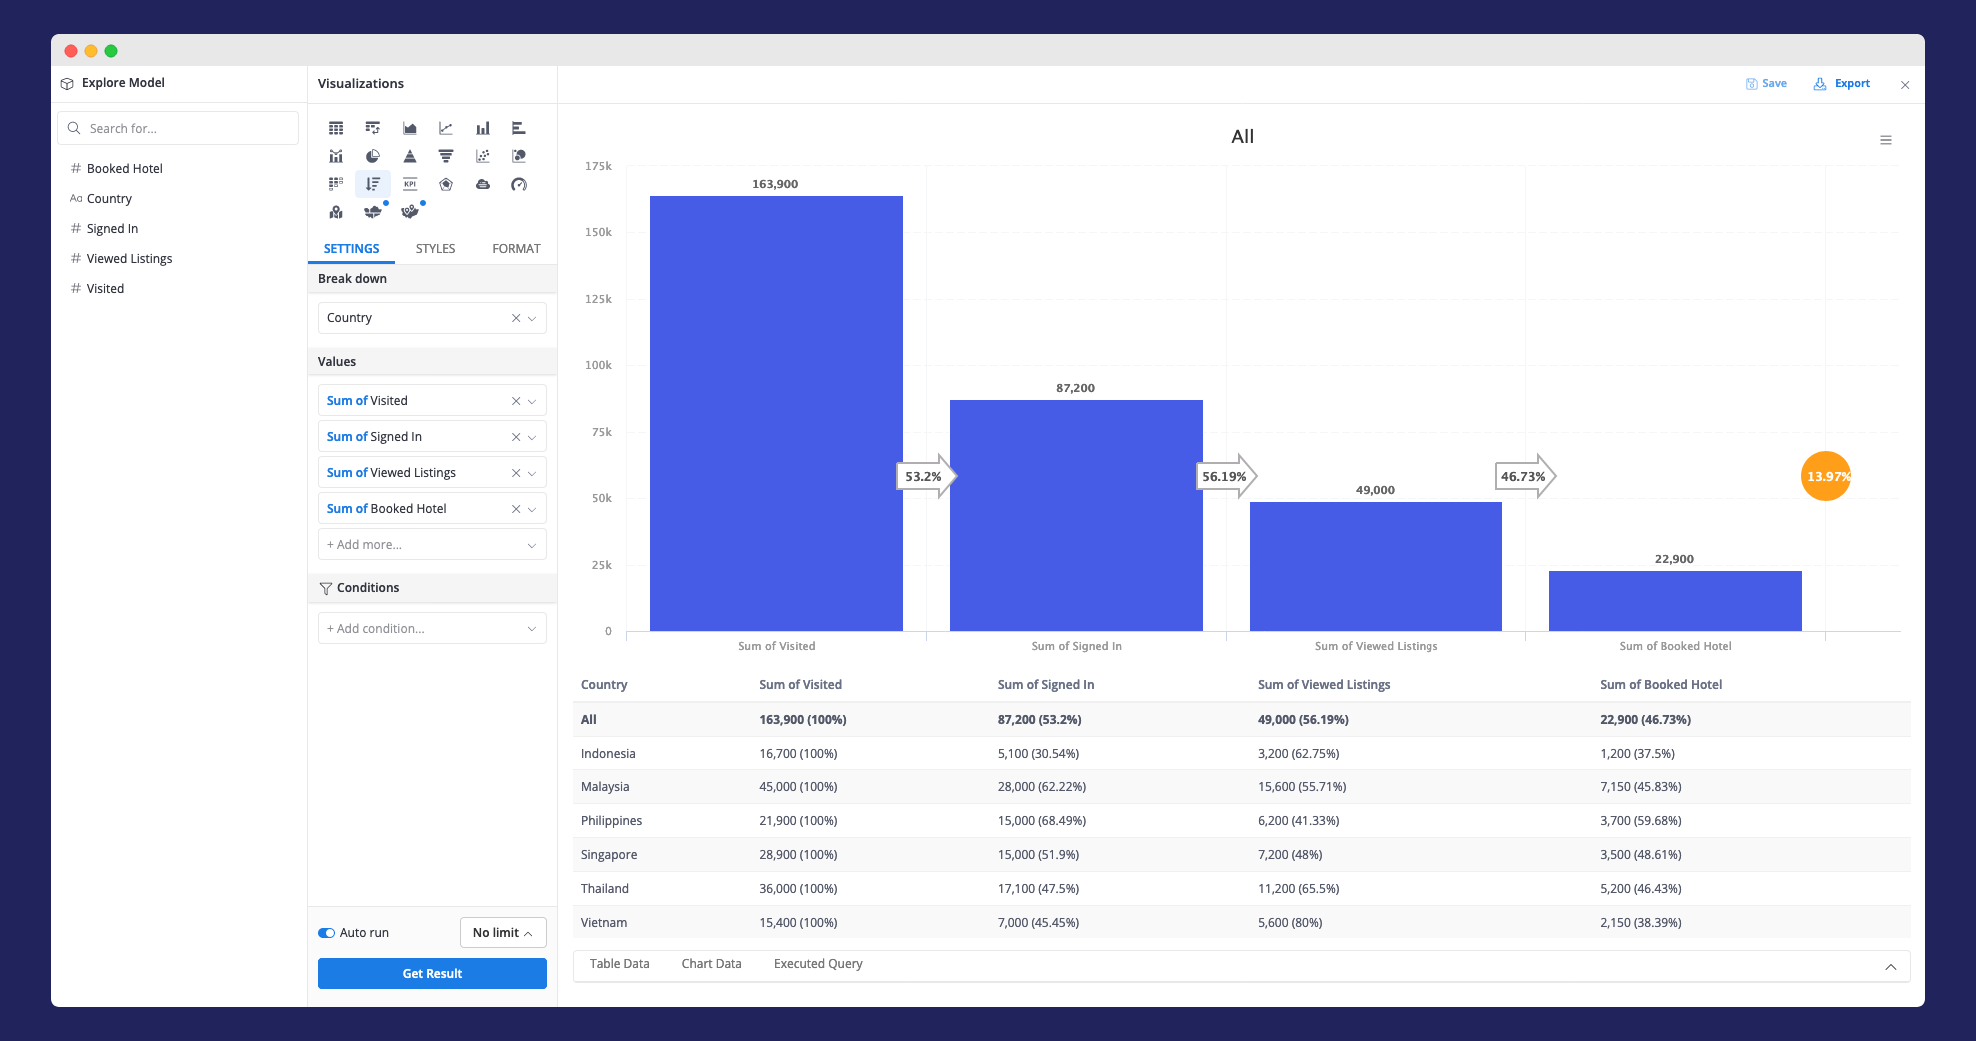
Conversion Funnel has been with Holistics since the first day, but it never got the attention that matches its importance. That' …
In our third and final part on Agile Data Warehouse, we take a look at the origins of the Agile Manifesto, from which Corr and Stagnitto took inspiration.
The second part of our series on Agile Data Warehouse Design, a 2011 attempt at applying the principles of agile to the practice of data modeling.
Agile Data Warehouse Design is a 2011 attempt at applying the principles of agile to the practice of data modeling. This is the first post in a series on the ideas from the book.

We've shipped 3 new features this month: Metric Sheet, Point Map and Adhoc Export.

Goodhart's law says that 'when a measure becomes a target, it fails to become a good measure. Here are four ways that occurs.
A short story about SQL's better rival: Michael Stonebraker's storied query language, QUEL.

Stuck at home during the pandemic? We give you Holistics's top five data books to read in 2020.

Why does data analytics and business intelligence lag behind the best practices and tooling of software? Two anecdotes and a theory.
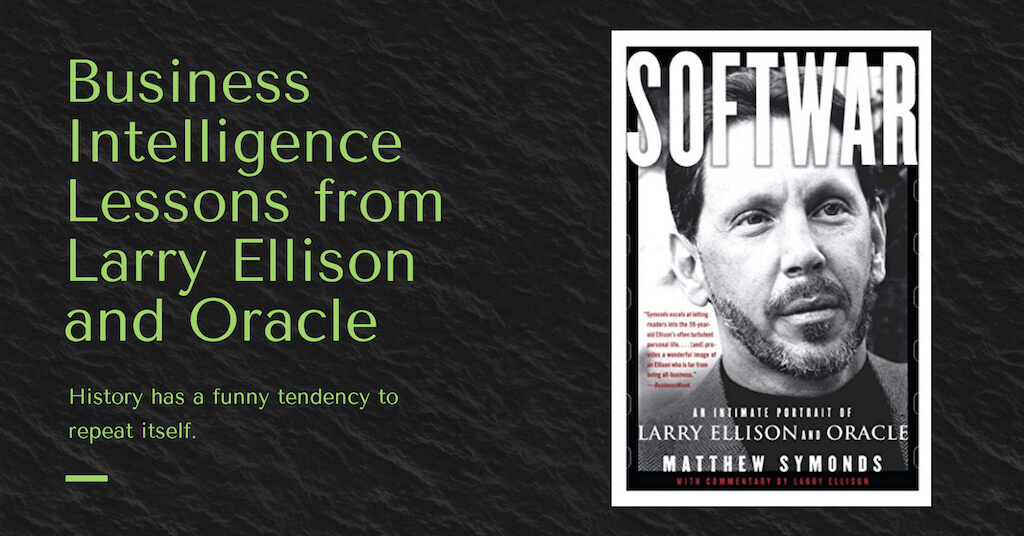
What we can learn from Softwar, a book about Larry Ellison's attempt to take over the enterprise software world.
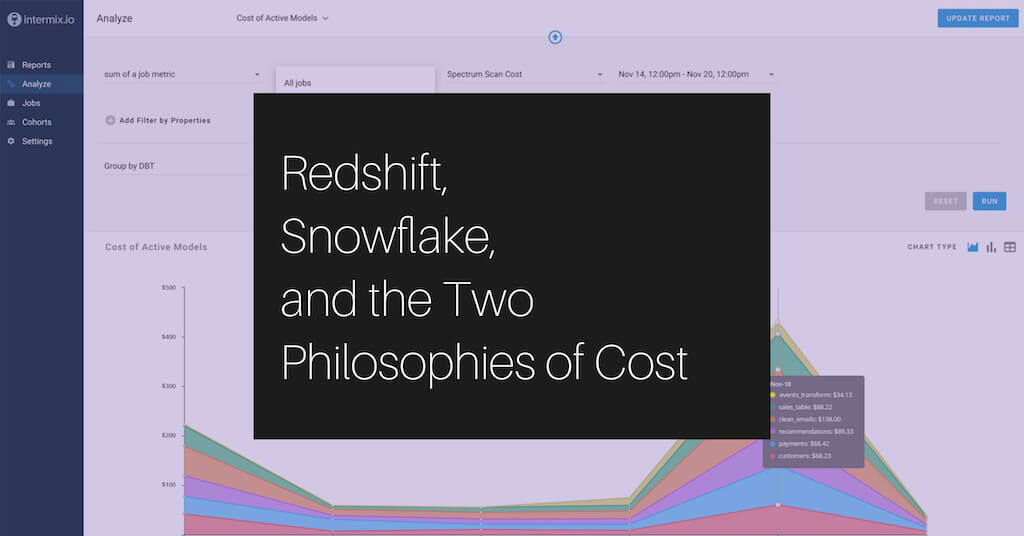
What intermix.io's forced acquisition tells us about the two philosophies of cost in data analytics.
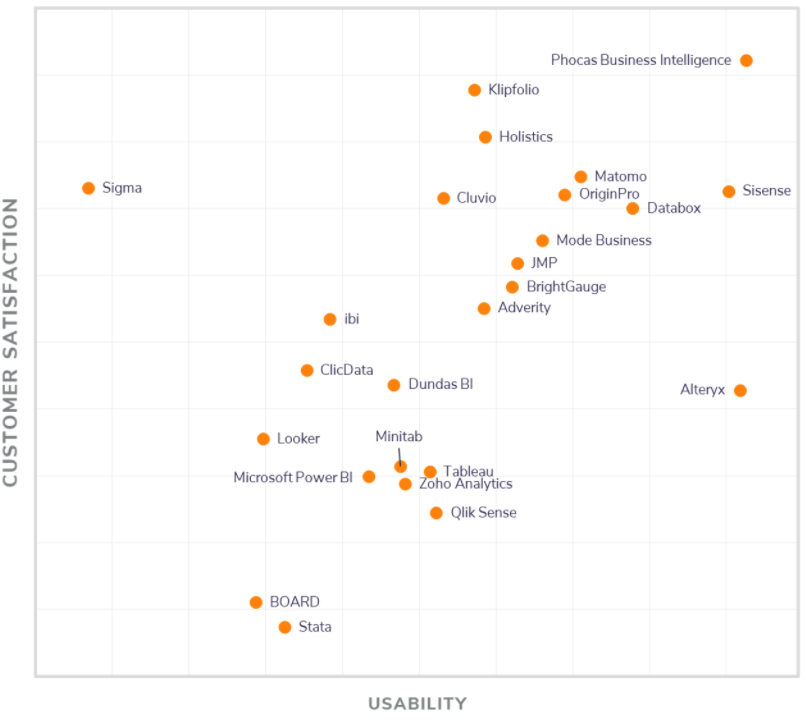
Holistics was ranked one of the top 3 data analysis tools globally by Gartner's FrontRunners 2020 report, in terms of Customer Satisfaction. Only 20 out of 176 software products considered were selected for this list.
A look into metadata hubs, which might just be the hottest category of data tools of the past two years.
We take a look at the business fundamentals of the operations stage — the last of three stages in a company's life.
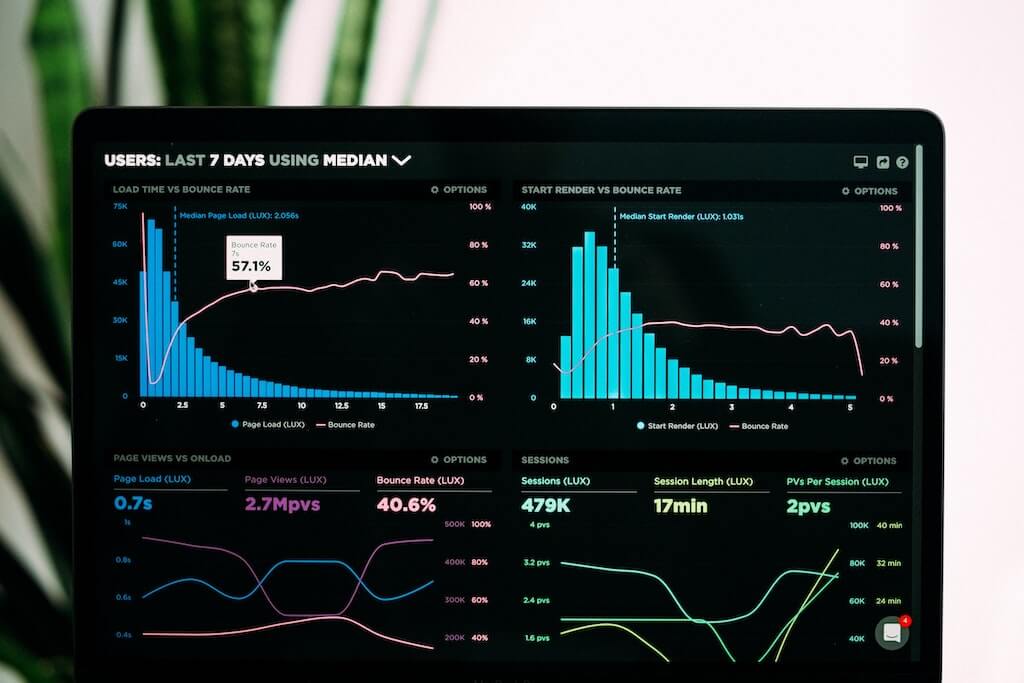
The scale stage is the second of three stages in a startup's life. In this post, we discuss what product-market fit means, and then we look at healthy growth (the kind that leads to winning) and unhealthy growth (the kind that leads to company death).

This is one of the #lifeatholistics stories written by our Intern graduate.
Redash is a good, popular open-source SQL-based BI tool that can be installed easily on local environment to get a simple SQL-to-chart functionality going. Yet as your analytics needs grow, you might face some pain points when using Redash
In this article, we will demonstrate how to use the JSON_EXTRACT and JSON_TABLE functions in MySQL8.0 to convert JSON table into tabular data for analysis and reports, and also how to utilise it in Holistics for drag-and-drop reports.
A startup's first job is to create a customer. We take a closer look at how that affects the metrics you measure at the product stage of a startup's lifecycle.

When your company grows, the metrics that matter changes along with it. Here's a look at the three growth stages of every company, along with the metrics that matter most at each stage.

One way to get better at business communication is to learn the fundamentals of business. We explain Return on Invested Capital from first principles, written with the data analyst in mind.

Working with nested JSON data in BigQuery analytics database might be confusing for people new to BigQuery. Yet if done well, nested …

If you work in data analytics, communicating complex information is just part of your job. Here's how to use the Ladder of Inference to get better at it.
We've shipped 3 new features this month: AWS for Holistics 3.0, New Navigation Bar, Better Relationship Display
We're releasing The Analytics Setup Guidebook, a first-principles approach to data analytics. Get it free today!
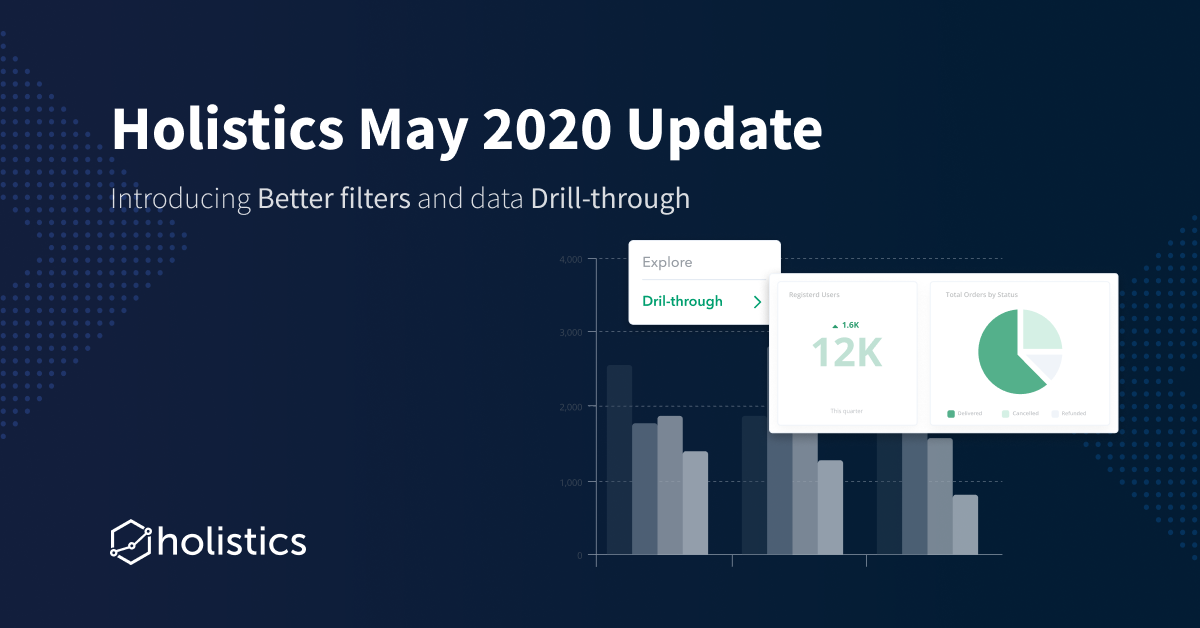
Discover our new and May-verllous features: Data drill-through, Smart date parser, Filter suggestions, and more!
Learn how to leverage data to craft personalized messages to your customers, pinpoint your business' Achilles heel and take timely actions!

Why data quality is an ongoing, people, process, and tools problem, and how to think about getting better at it.
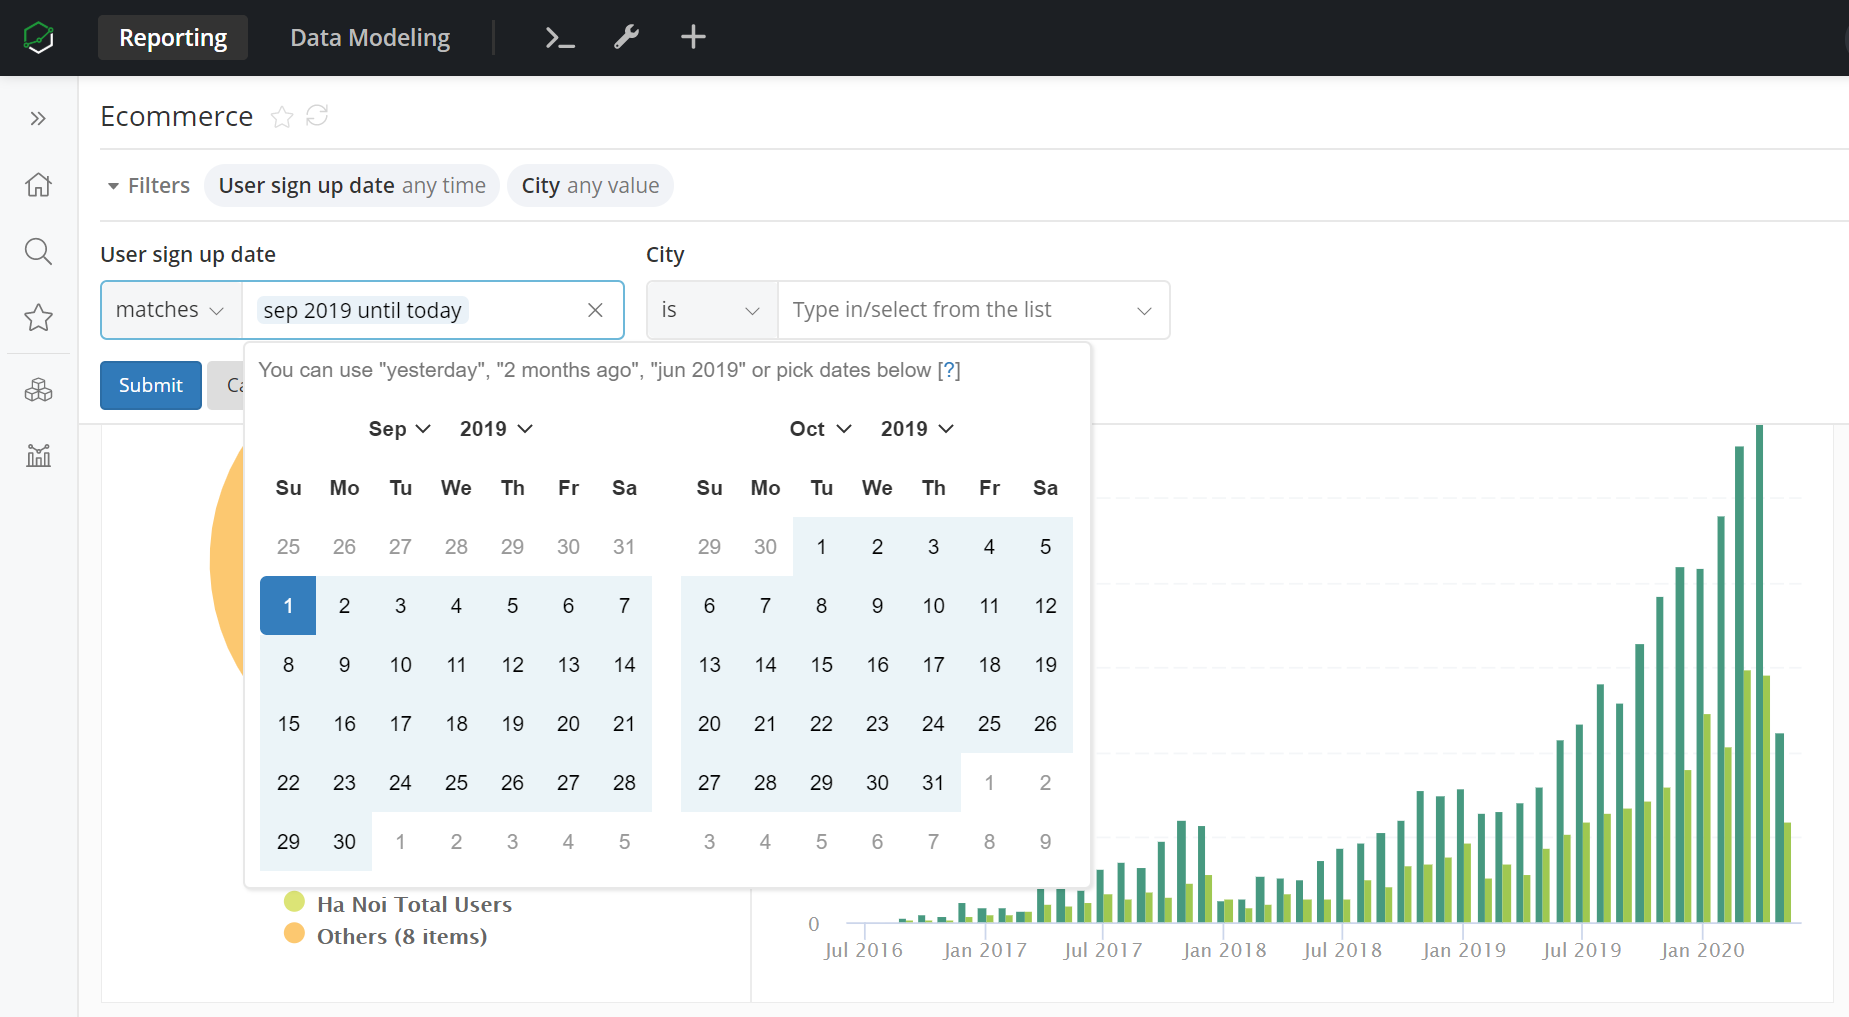
Smart Date Parser allows users to input date/time expressions that are more natural/closer to your day-to-day language, and output date/time values that adhere to programming language's standards.

This tutorial will show you simple steps to build an interactive dashboard to visualize your Pipedrive data using Holistics.
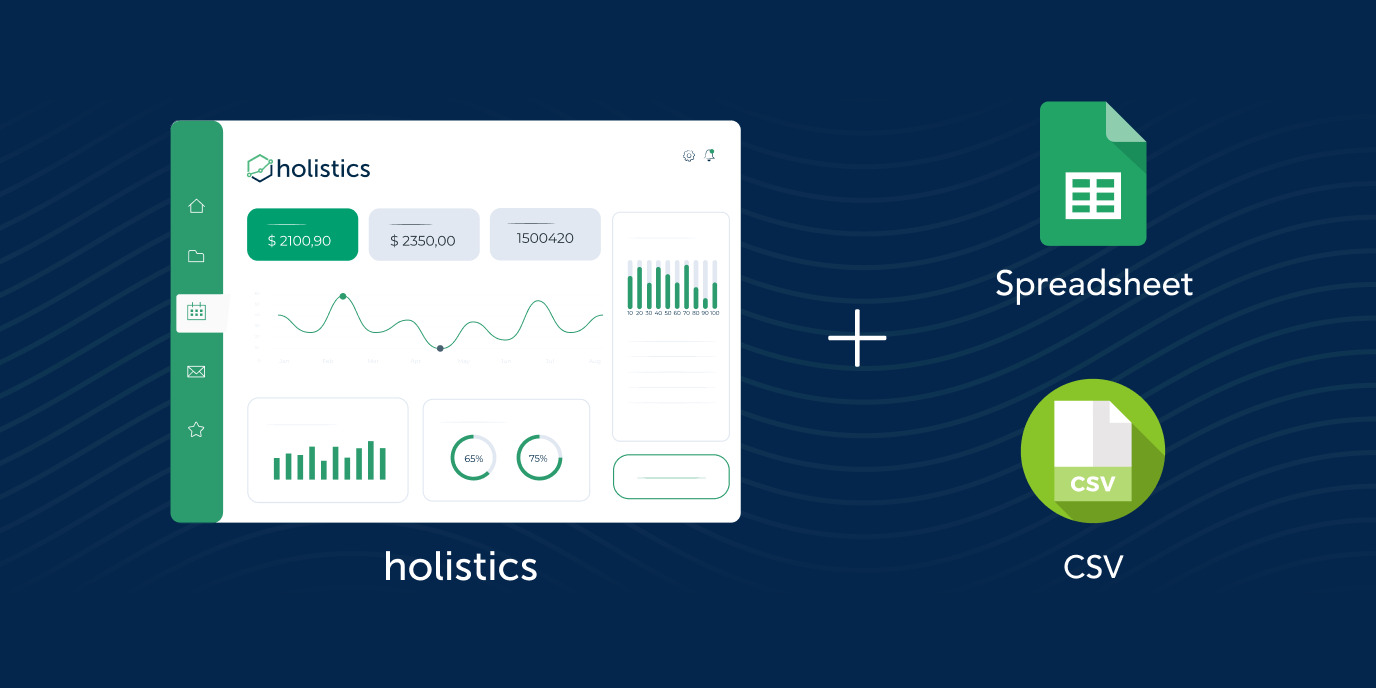
I'll show you 5 simple steps to integrate CSV / Google Sheets and build a real time dashboard by using Holistics.

What a new approach to slowly changing dimensions tell us about the future of dimensional data modeling.

Why maturity models can be a bad idea, and why using a capability model is a better idea for digital transformation.

Tracking the performance of your software development team is really, really difficult. The 2018 book Accelerate: The Science of Lean Software and DevOps gives us a fantastic way to measure just that. Here's how.

Why your CEO is so obsessed with cash flow metrics, and what you can do to help as an analytics person in your company.

This is one of the #lifeatholistics stories written by our Intern graduate.

There appears to be two philosophies today when it comes to managing costs in a modern data stack. We explore what they are.

Creative designer intern Teo shares his experiences working at Holistics Indonesia.

An explanation of the SaaS Quick Ratio that focuses on the intuition behind the metric. Written with the data analyst in mind.

There's a tendency for people to conflate OLAP with OLAP cube. We take a quick look at how this happens, why it shouldn't, and why it matters if you're a data practitioner.

A definitive history of the rise of the OLAP cube, how it's affected our industry, and what comes after.
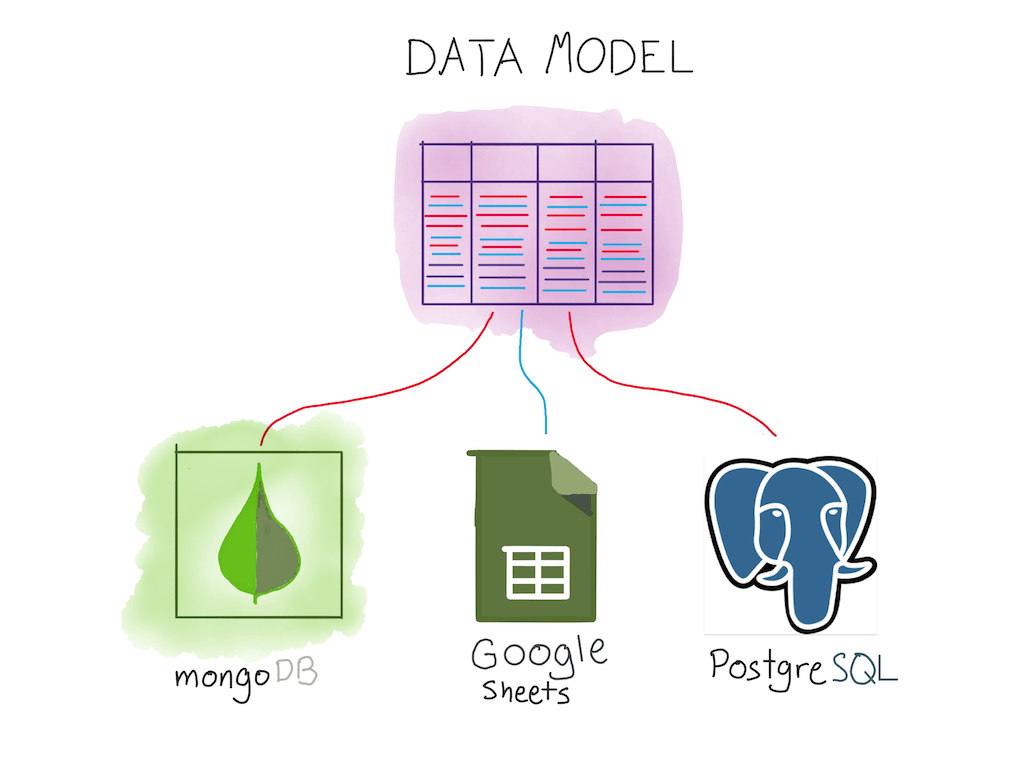
In Holistics, you are now able to create data models on top of external data sources like MongoDB and Google Sheets. Here's a video tutorial on how to do exactly that.

Good data teams combine data from different sources in order to do their jobs well. Here's what we've learnt while putting this into practice at Holistics.

Data team careers are different from equivalent careers in software engineering, product management, or UI design. Here's how to evaluate prospective employers as part of your data career.

Google Analytics is an incredible tool to have in your toolbox. But it only offers aggregated data, which limits your ability to track visitor behavior. In this post, we discuss a simple, affordable alternative to GA that we've implemented at Holistics.

The resurgence of SQL-based data modeling is a something we should all be interested in. Here's why it's important.

“There is nothing so terrible as activity without insight.” Insight has become an essential need for every company in order to understand what the company is experiencing, why it happens, and what might come in handy in the future.
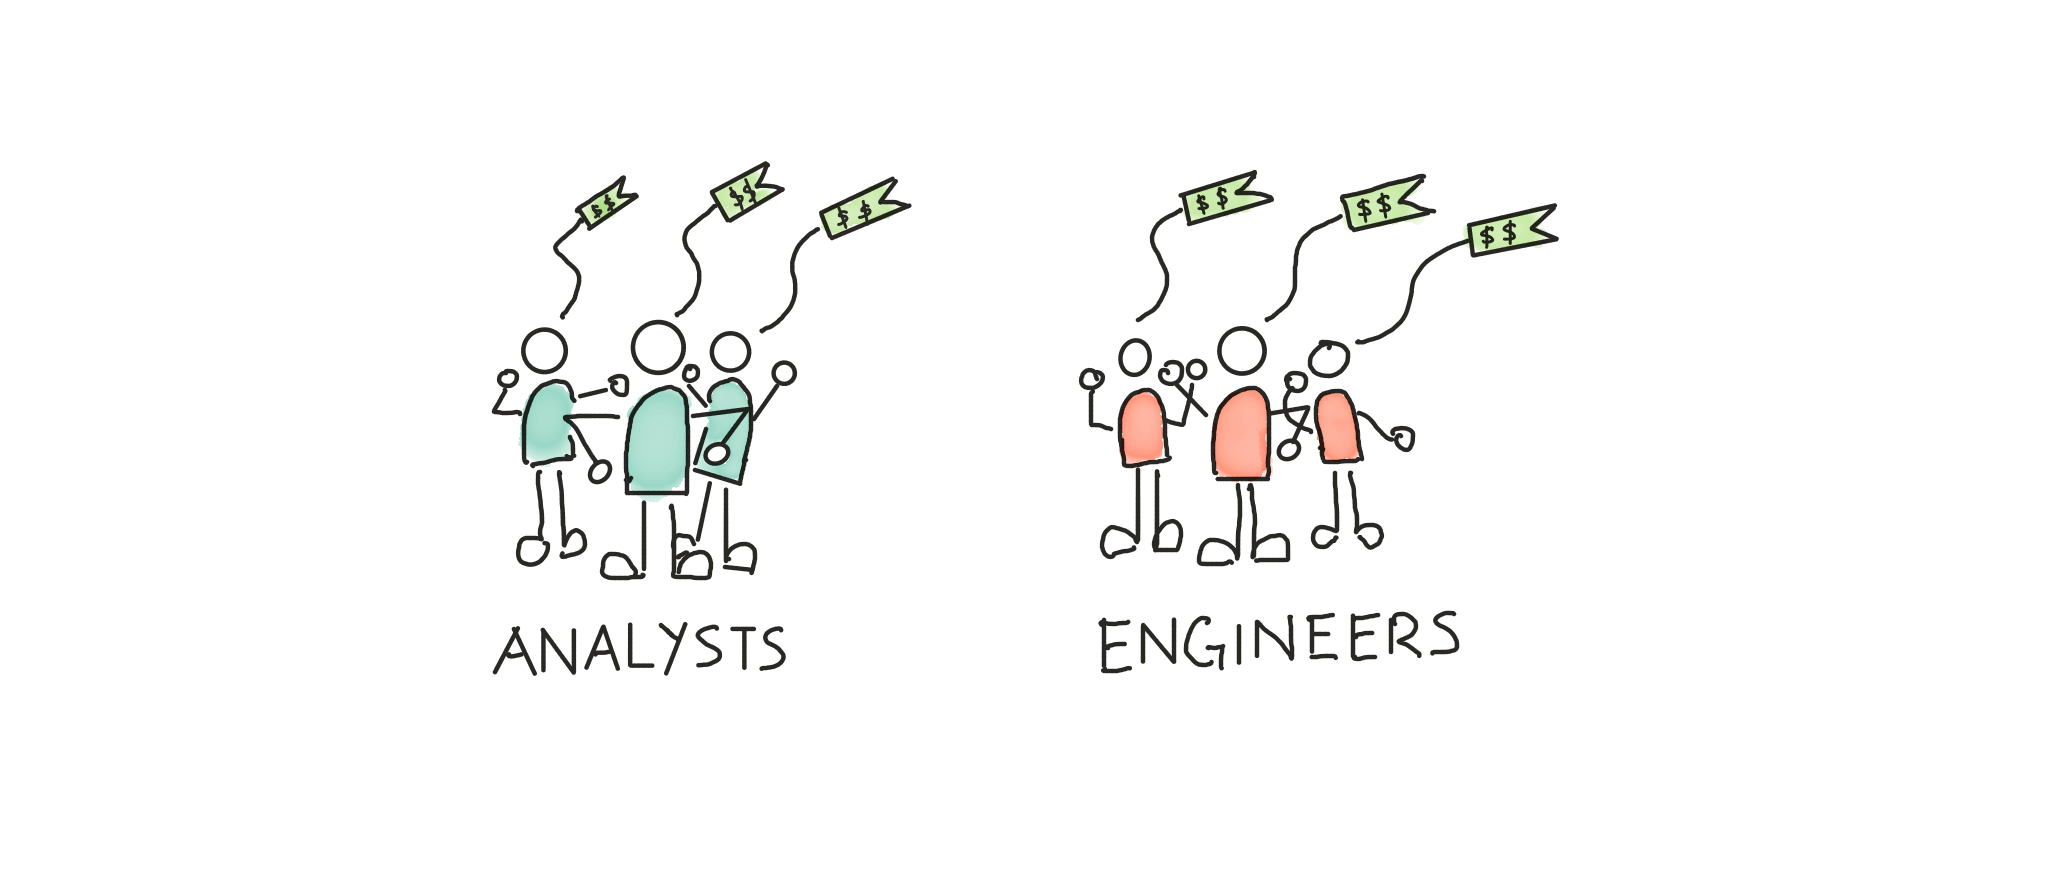
In the past, setting up an analytics department meant hiring data engineers first. But in a cloud-first world, you can and should hire data analysts first. Here's why.
Using custom SQL for your Tableau workbooks is usually a really bad idea. Here's how using Holistics with Tableau makes this a non-problem.

Tableau may be the best data visualizer on the planet today, but Holistics makes Tableau more awesome, by making data prep trivially easy.
We live in the age of apps — and therefore, the age of data. This presents us with an unparalleled opportunity for data analytics, as well as an unparalleled challenge! Here's how to not get left behind.

Occasionally, we get asked “when should we consider getting a data warehouse?”. The answer is a lot simpler than you think!

Looker is among the most popular data analytics platforms on the market today. It has a unique approach to data modeling that …
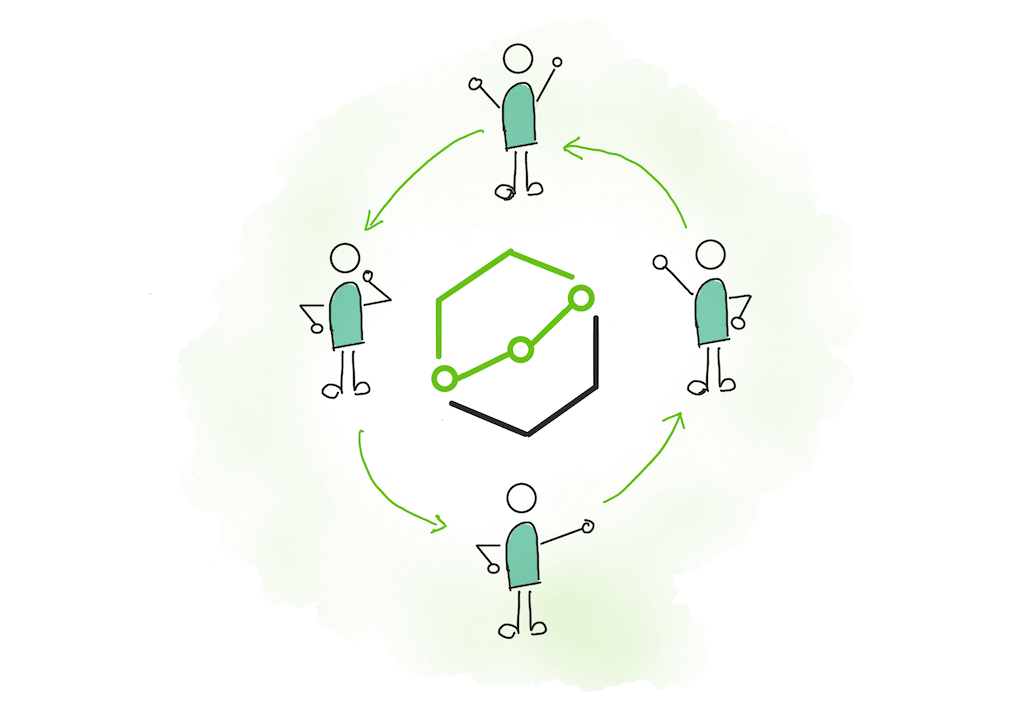
Holistics's data modeling layer allows data teams to radically increase their productivity. No repeated queries. Self-serve reports and dashboards. Here's how it works.
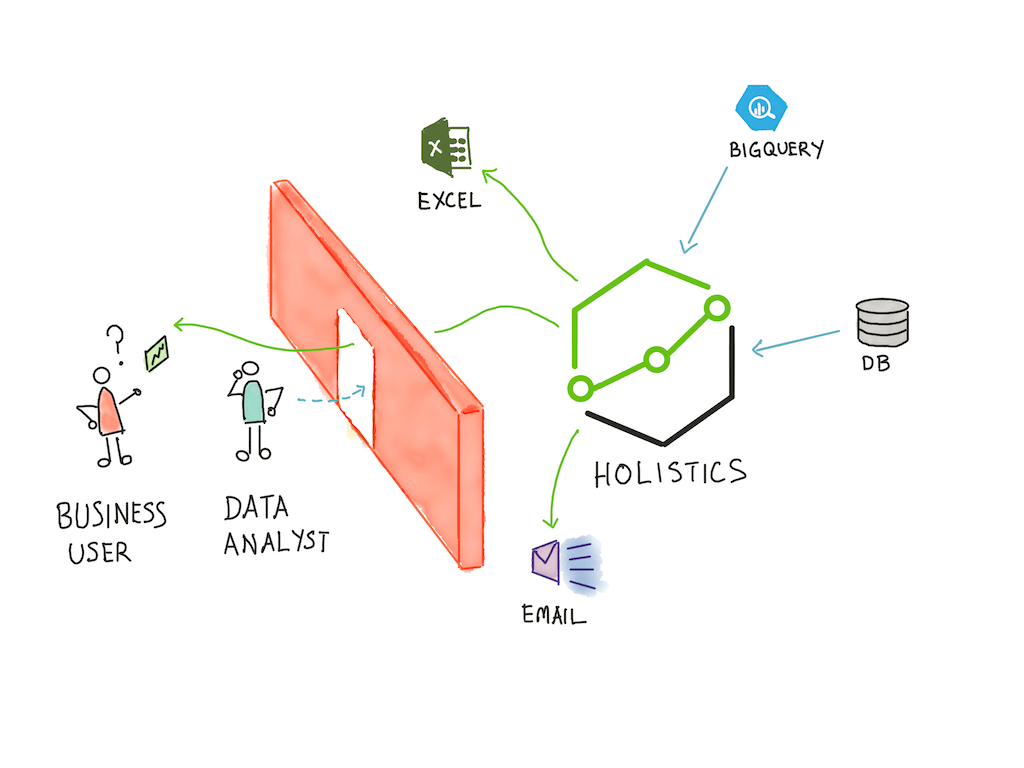
The new version of Holistics is designed from the ground up to increase the productivity of your data team. Here's how that works.

One of the most useful ideas from the 2013 book Lean Analytics is the notion of 'lines in the sand' — concrete values that tell you how well you're doing on a metric that matters.
In Part 2 of our summary of Lean Analytics, we cover the five stages of a data driven startup, and the book's tips for creating a data-driven culture in your company.
In the first part of our comprehensive summary of Lean Analytics, we examine the basics of analytical thinking, explore six startup business models, and examine the metrics that matter the most to each.
In operational analytics, you're either looking at a leading indicator, or you're looking at a lagging trend indicator. Here's why this particular categorisation is so useful.
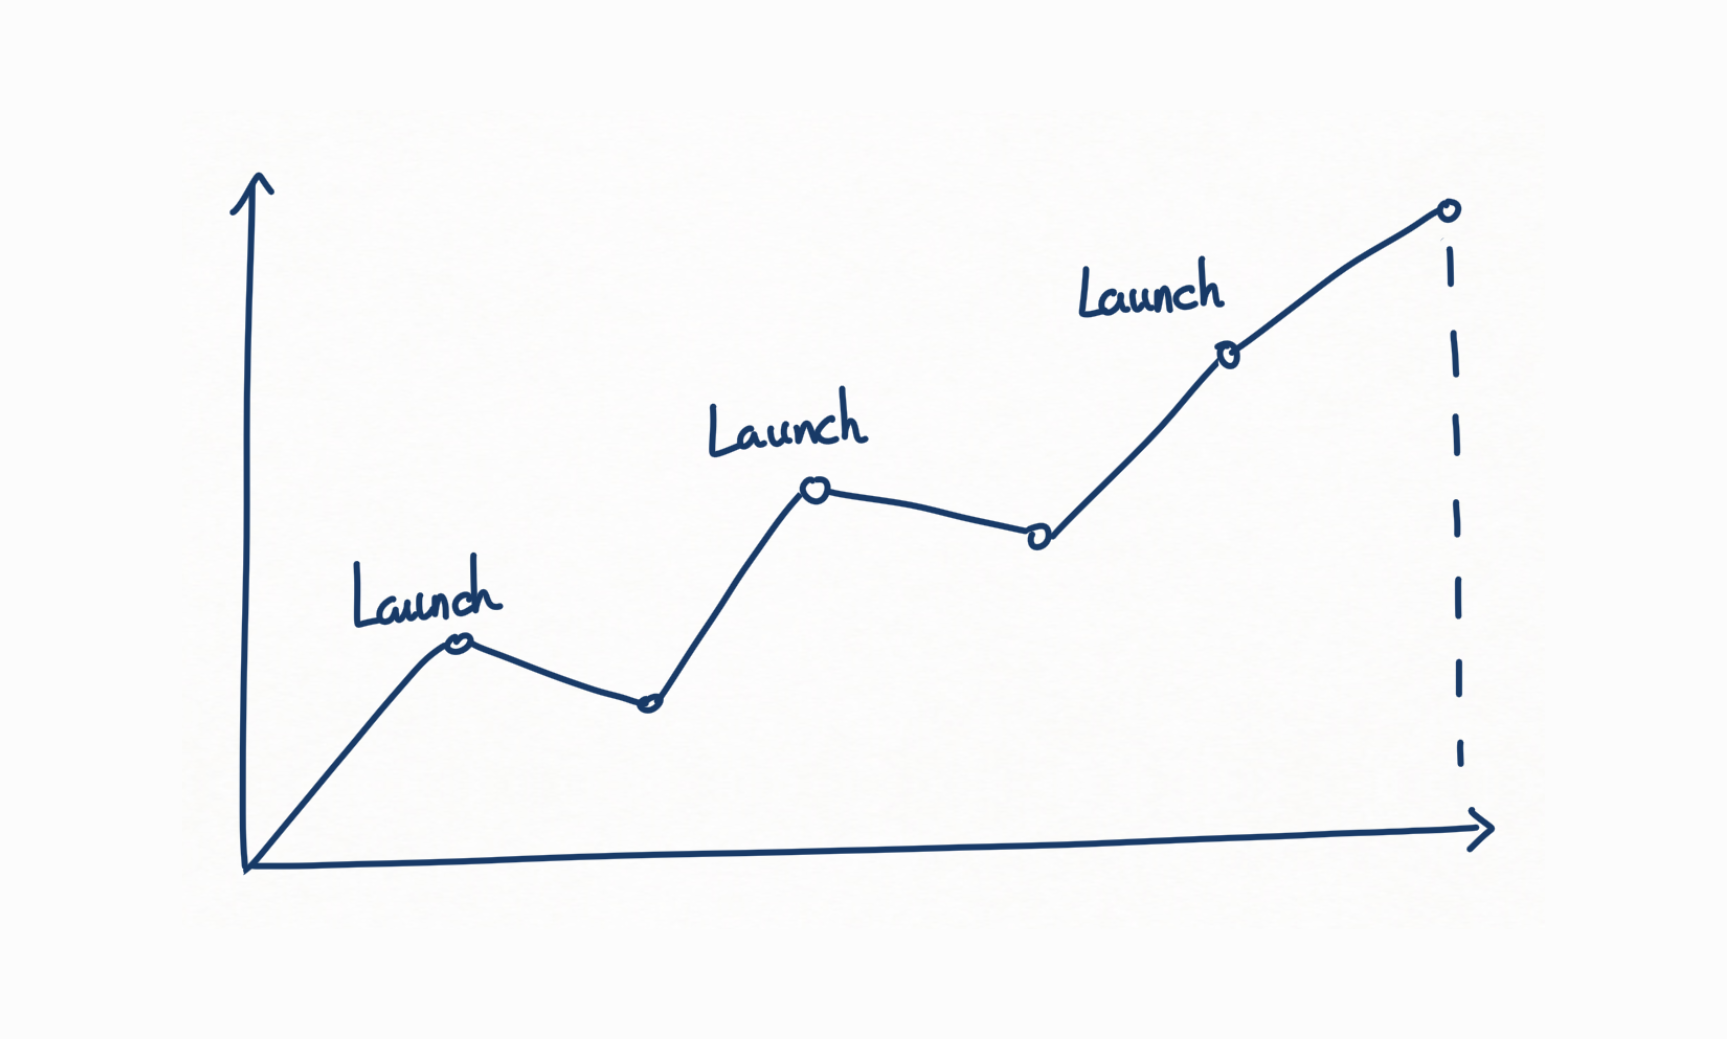
How we managed to launch a database designer to more than 100,000 users around the world without a budget.

When you're implementing company-wide analytics, it's easy to fall into the trap of measuring only one metric. Don't. The principle of pairing indicators is why.

A data dictionary is a document that assists you in navigating your team's mountain of data. We show you how to create a spreadsheet-based data dictionary with Excel and dbdiagram.io.
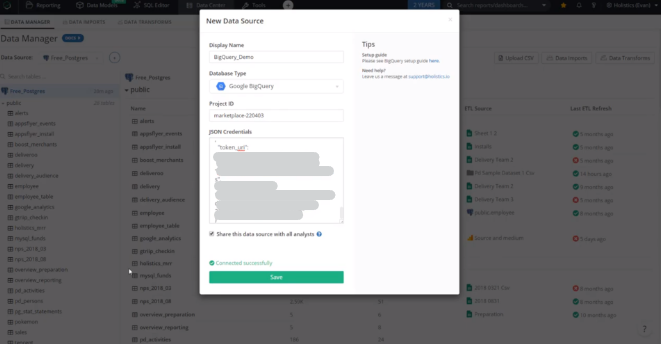
With cloud services today like Google Cloud Platform (GCP) and Holistics, setting up a data warehouse is insanely simple. In this video, …
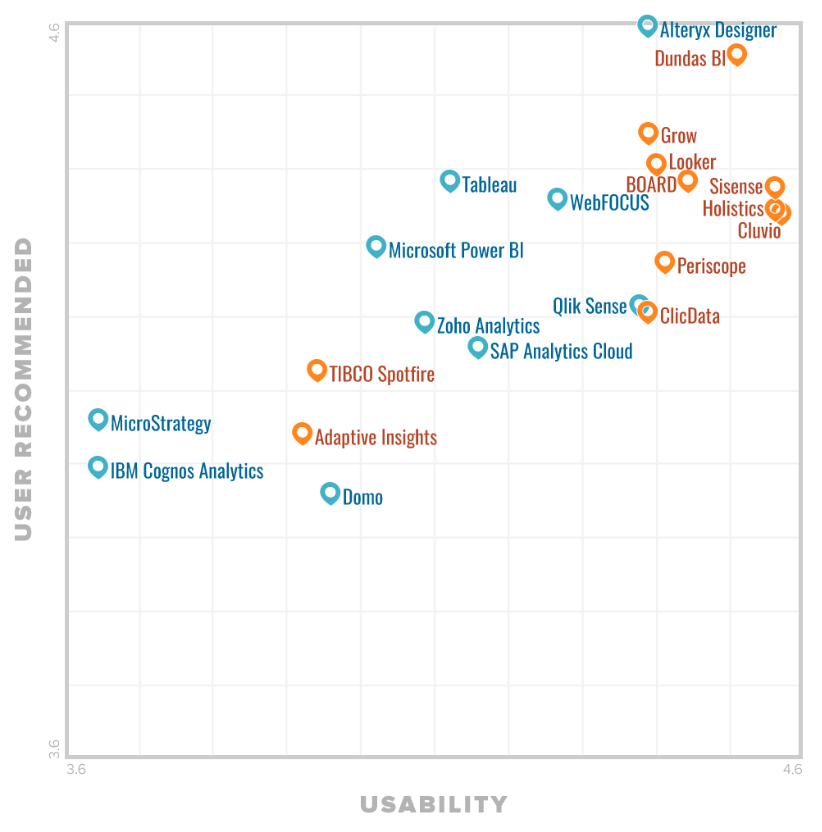
Holistics listed by Gartner's FrontRunners 2019 among the top 2 most Usable business intelligence tools globally, for the second consecutive year running.
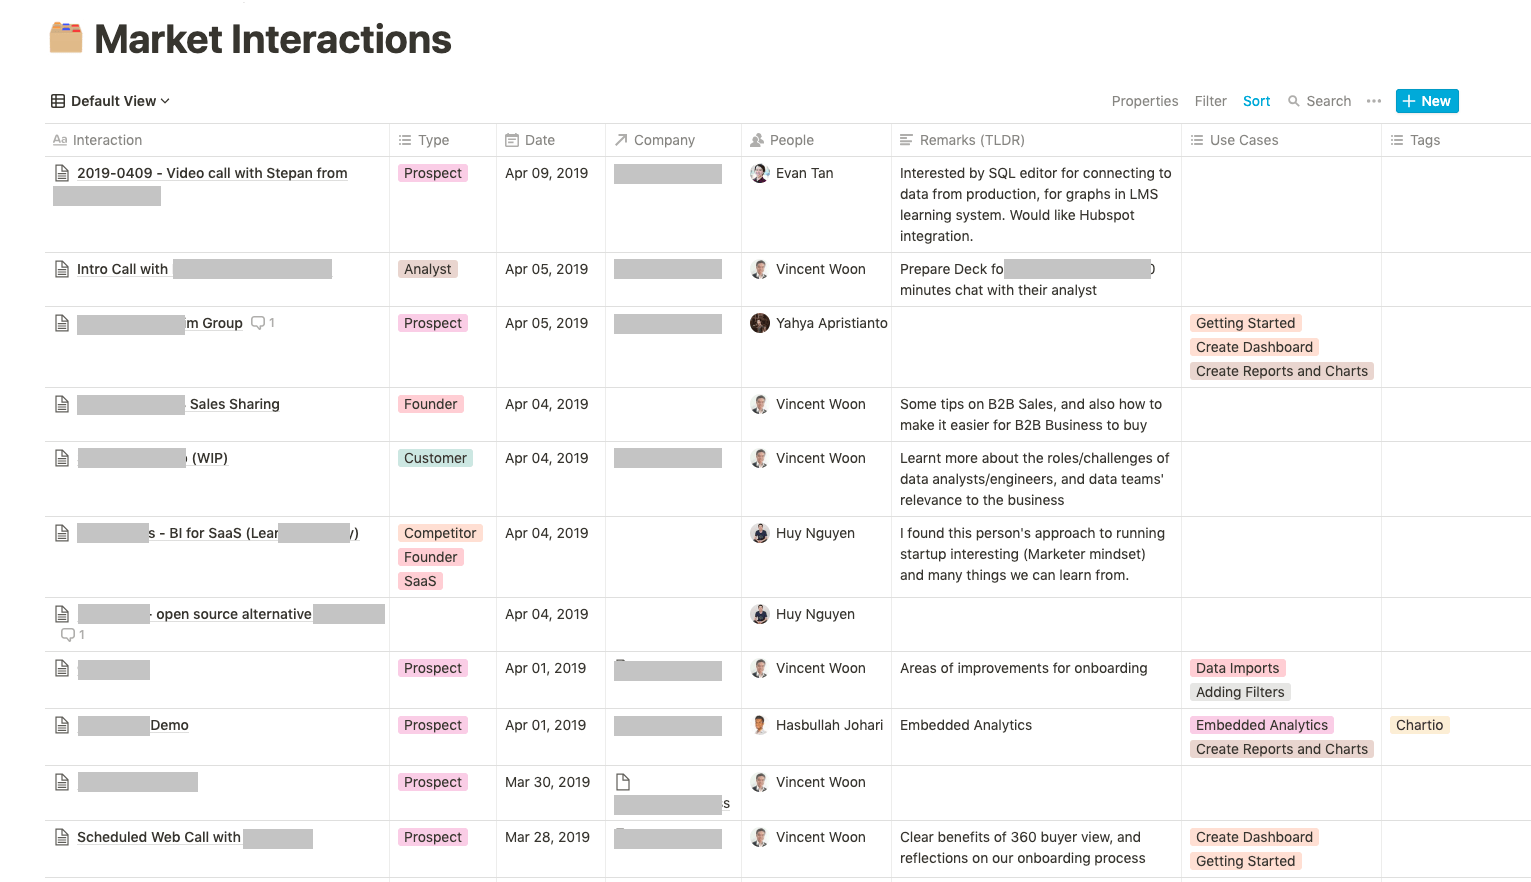
At Holistics, we have the habit of noting down every interactions the team has with the market. Whether it's customer, …

As we are still a very small startup, we do not have a dedicated data team but we want to democratize data access. Holistics plays a big role in our company by providing visualization and reporting features via connecting with our database.

Tableau is a great data visualization tool to help data teams provide senior executives with summarized data. However, there is typically lots …
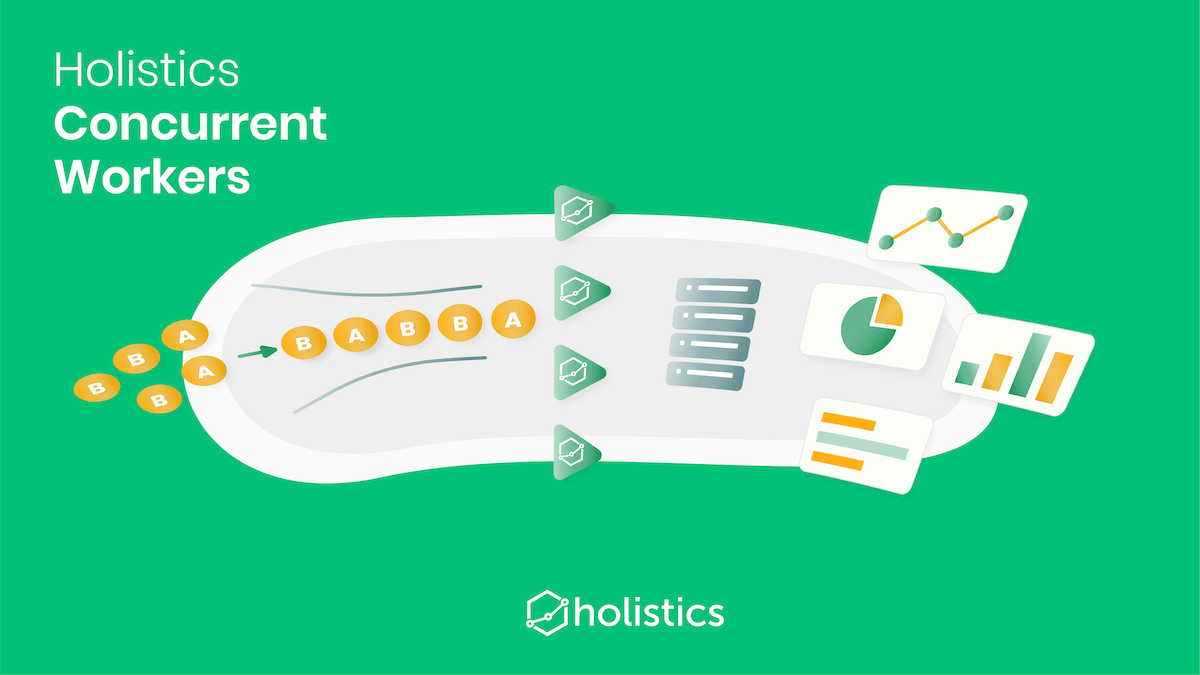
'A queuing system makes everything faster!' What is a Concurrent Worker? Holistics Workers control the number of concurrent database queries …

A step by step guide and video for querying S3 data to build reports and charts, by using AWS' Amazon Athena and Holistics.
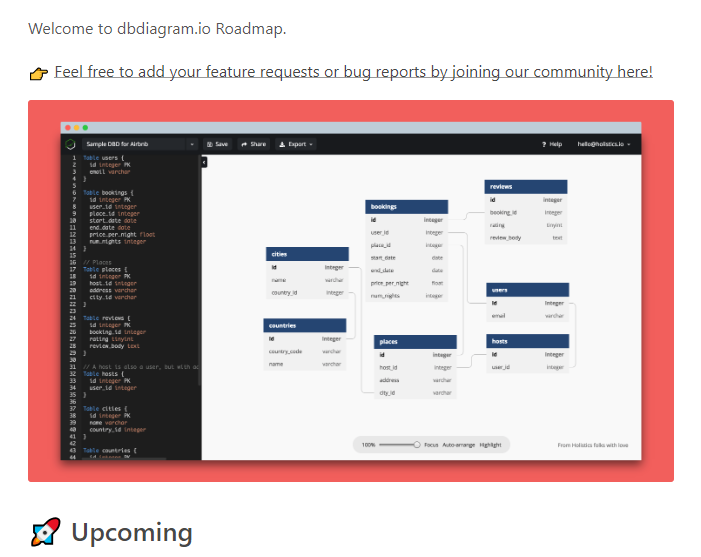
This project started out as a tiny feature intended for our DataOps cloud BI platform, Holistics.io. Our interns helped develop dbdiagram. …
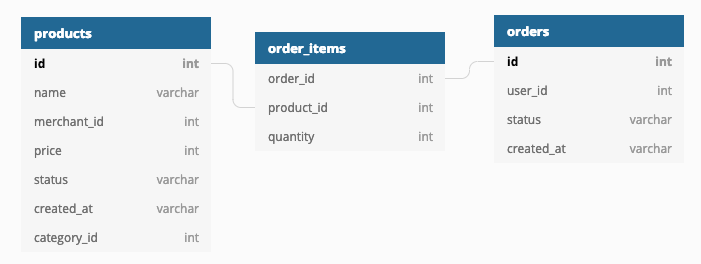
In this post, we will be sharing with you two tips to make dbdiagram.io work better for you * How to define …
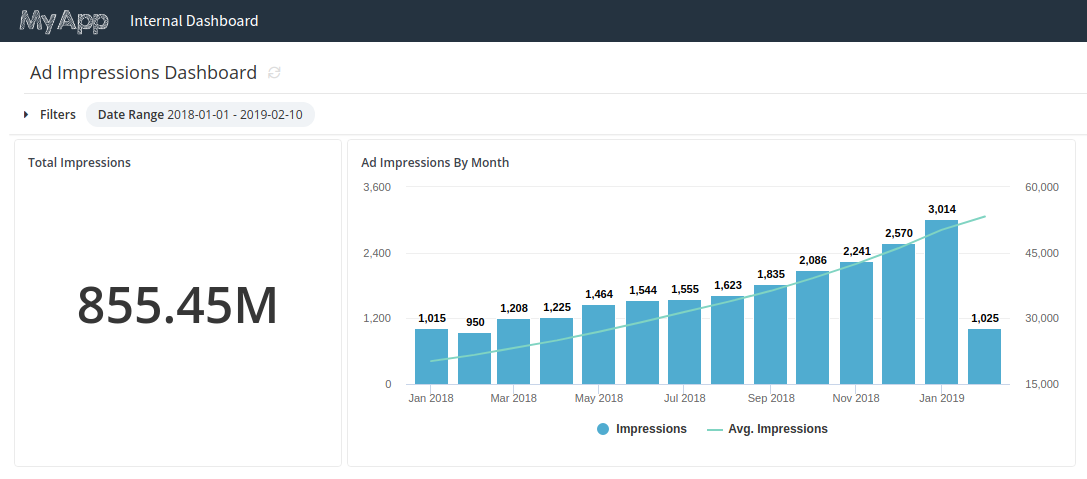
Your embedded analytics dashboard in Holistics takes a long time to load, thus impacting your customers' experience. This post shows you how to optimize the performance of embedded dashboard by preaggregating the data.
Why bother creating a database? The world is full of data. According to Forbes, there are 2.5 quintillion bytes of data …
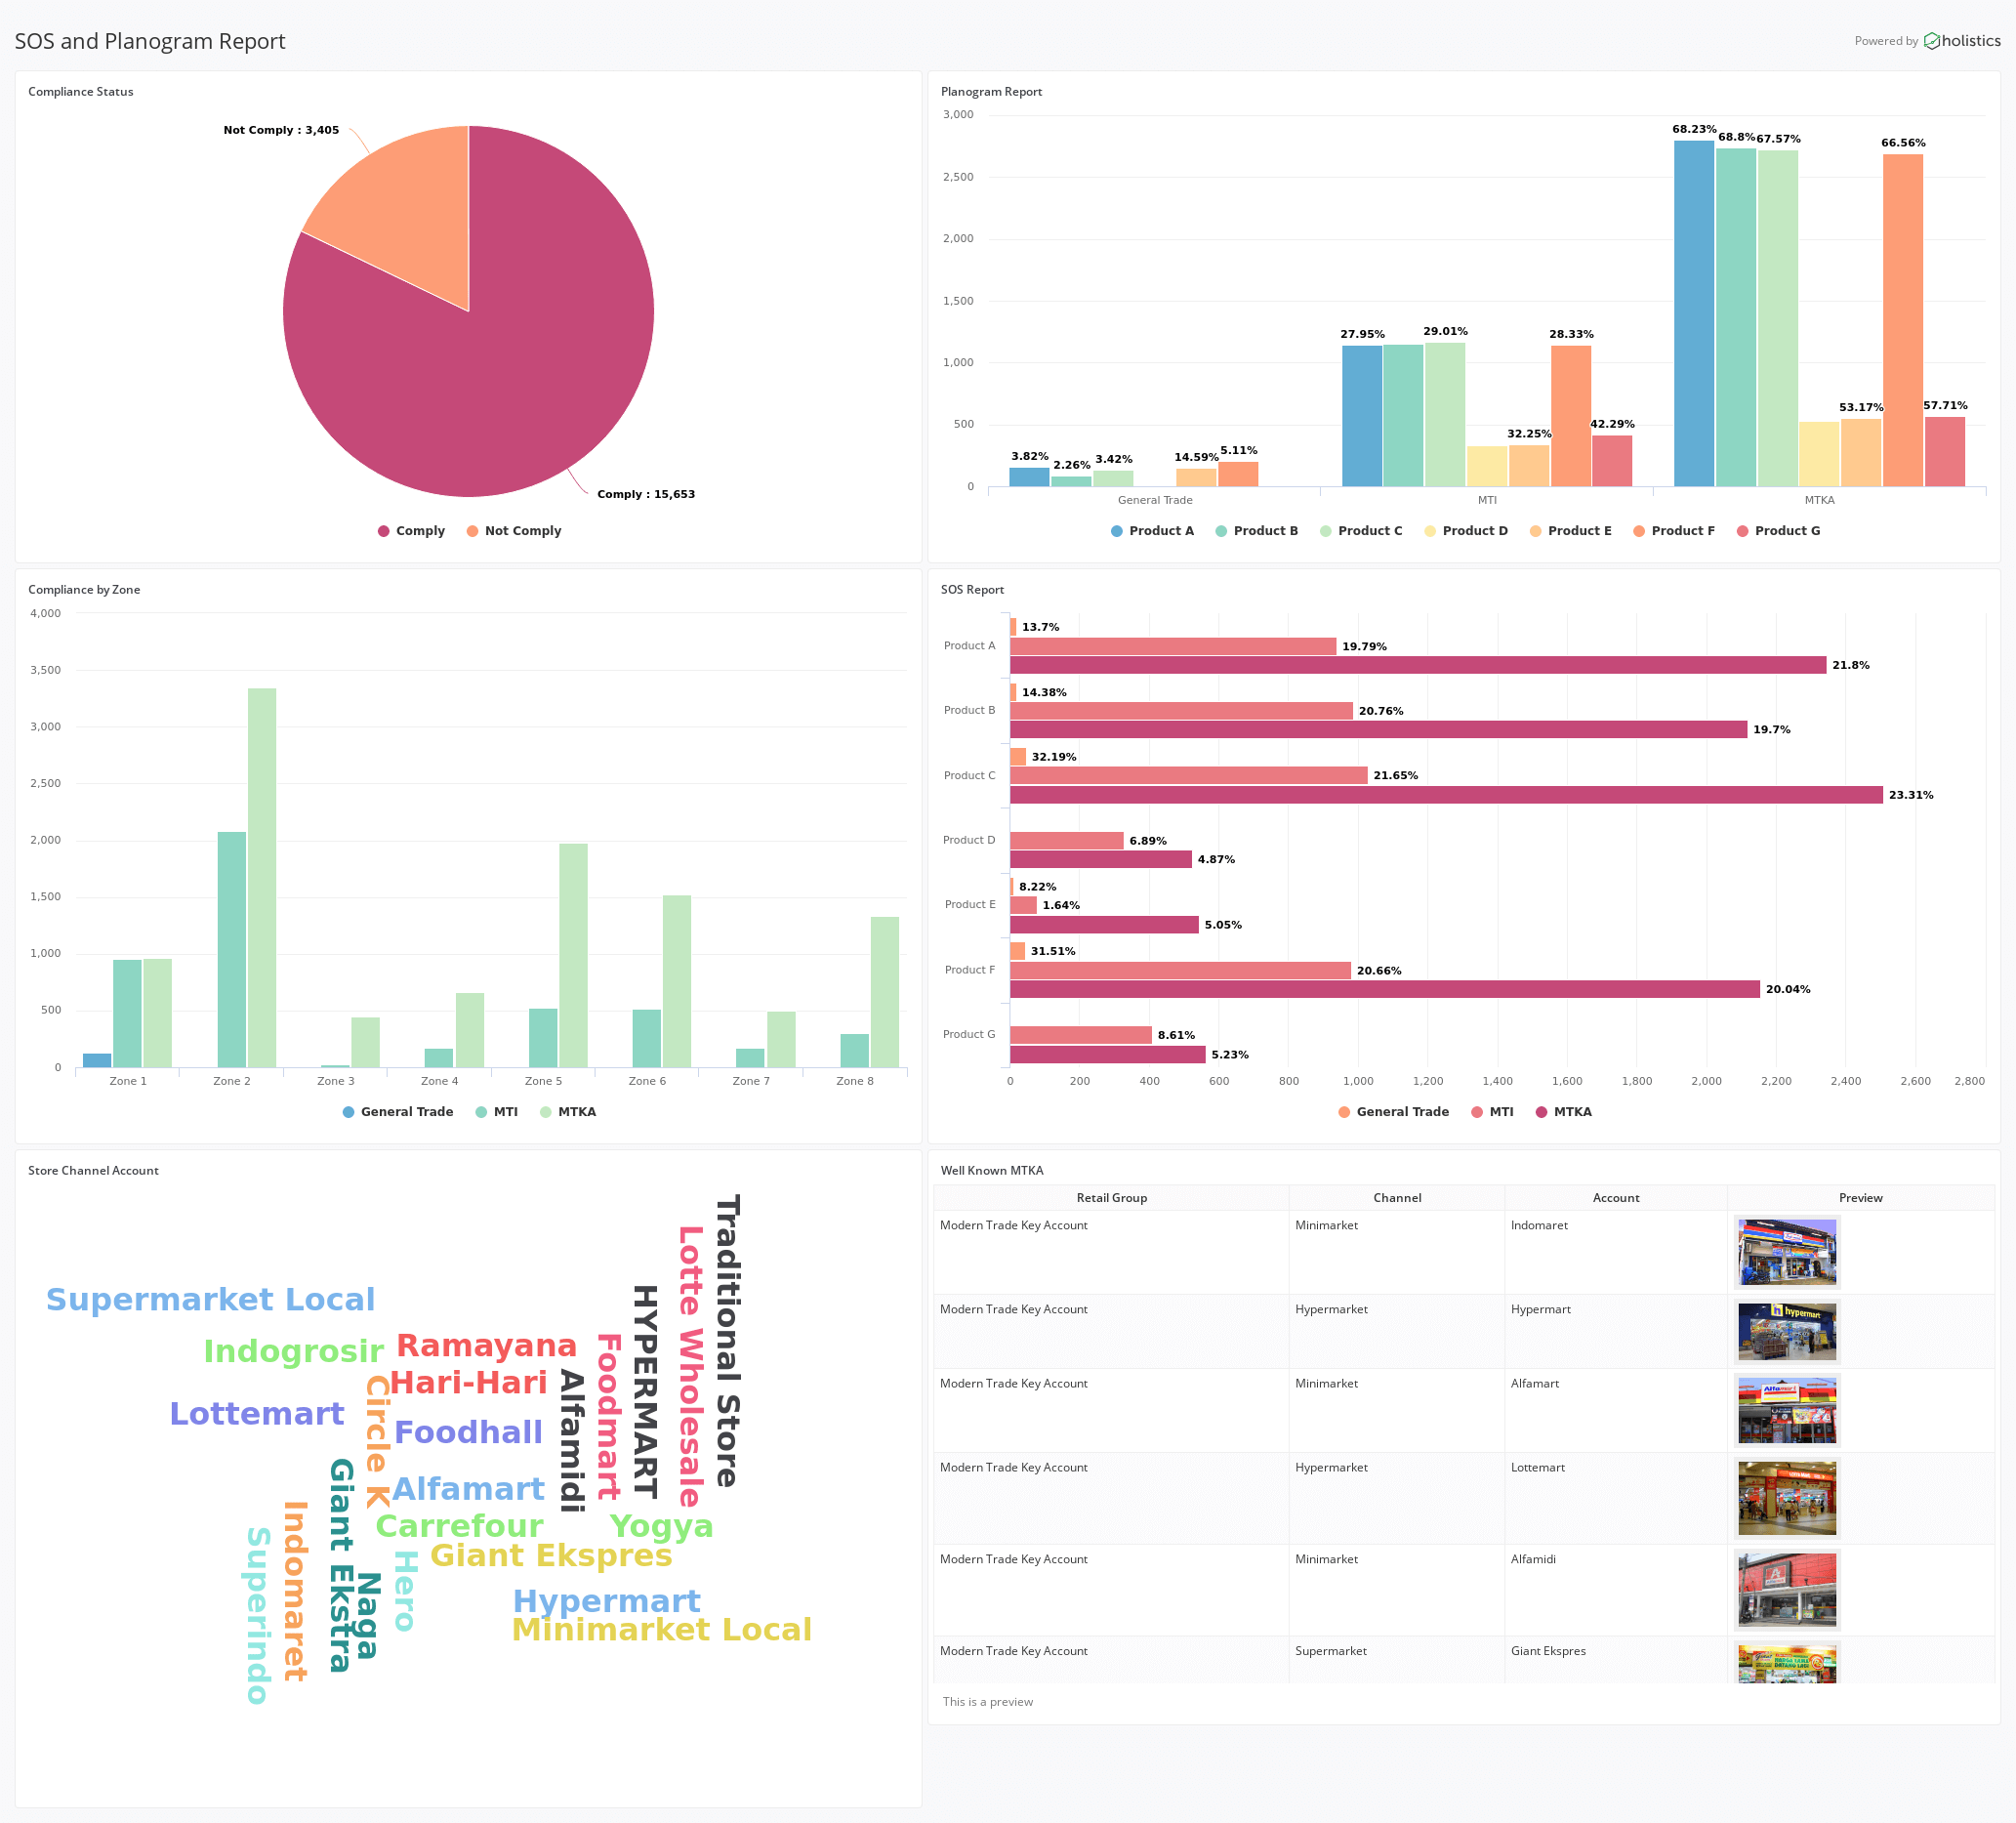
Planogram and Share of Shelf/Space (SOS) reports are key field execution reports that are important concerns for decision makers to carry out the marketing strategy. In this article, we will explain what Planogram and SOS reports are.
A good data analyst is one who has an absolute passion for data, he/she has a strong understanding of the business/product you are running, and will be always seeking meaningful insights to help the team make better decisions.
We are always looking back to see what we have achieved in the past year. It's our way of giving …

Sales data consists of many key statistics such as number of leads, lead score data from apps like Autopilot, success rate of …
Almost the end of the year! Has it been a good one? We're gonna try to make it better. Here's our November update and year end highlights!
Many Mongo users get stuck going from MongoDB data to analytics. Getting data out of Mongo and into a relational database lets you build your reporting workflow.
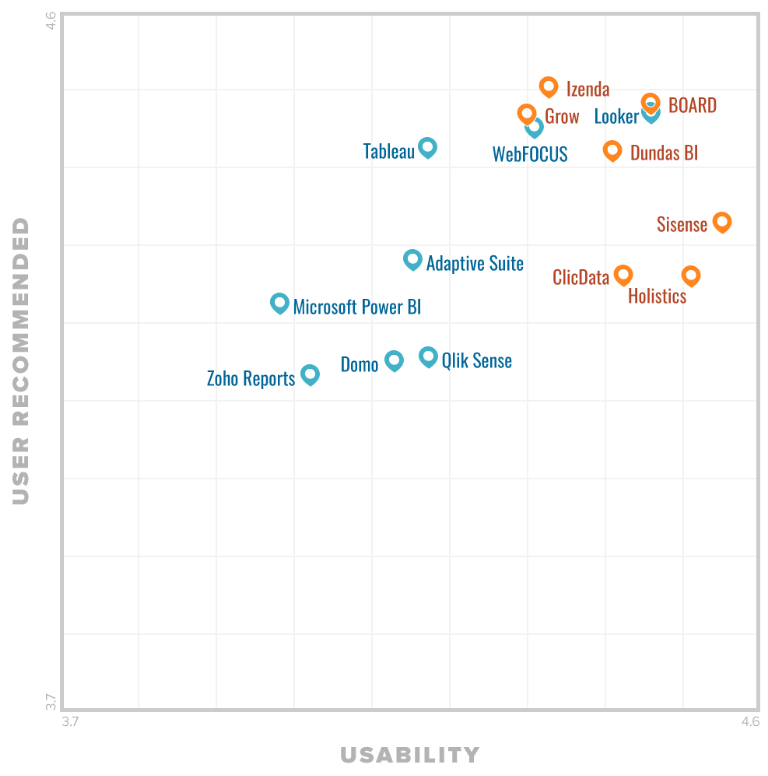
Holistics was listed by Gartner's FrontRunners 2018 as one of the highest ranked business intelligence tools for Usability and User Recommendations.
In this tutorial, you will learn how to query your MongoDB with SQL and use it for different purposes such as Analytics, Embedded Analytics, Machine Learning, Statistics etc.,

We believe that doing meaningful work requires giving people independence and autonomy. That’s why at Holistics, we are creating data champions.
Learn how to use this simple free tool dbdiagram.io to visualize your Rails ERD diagram, made by Holistics
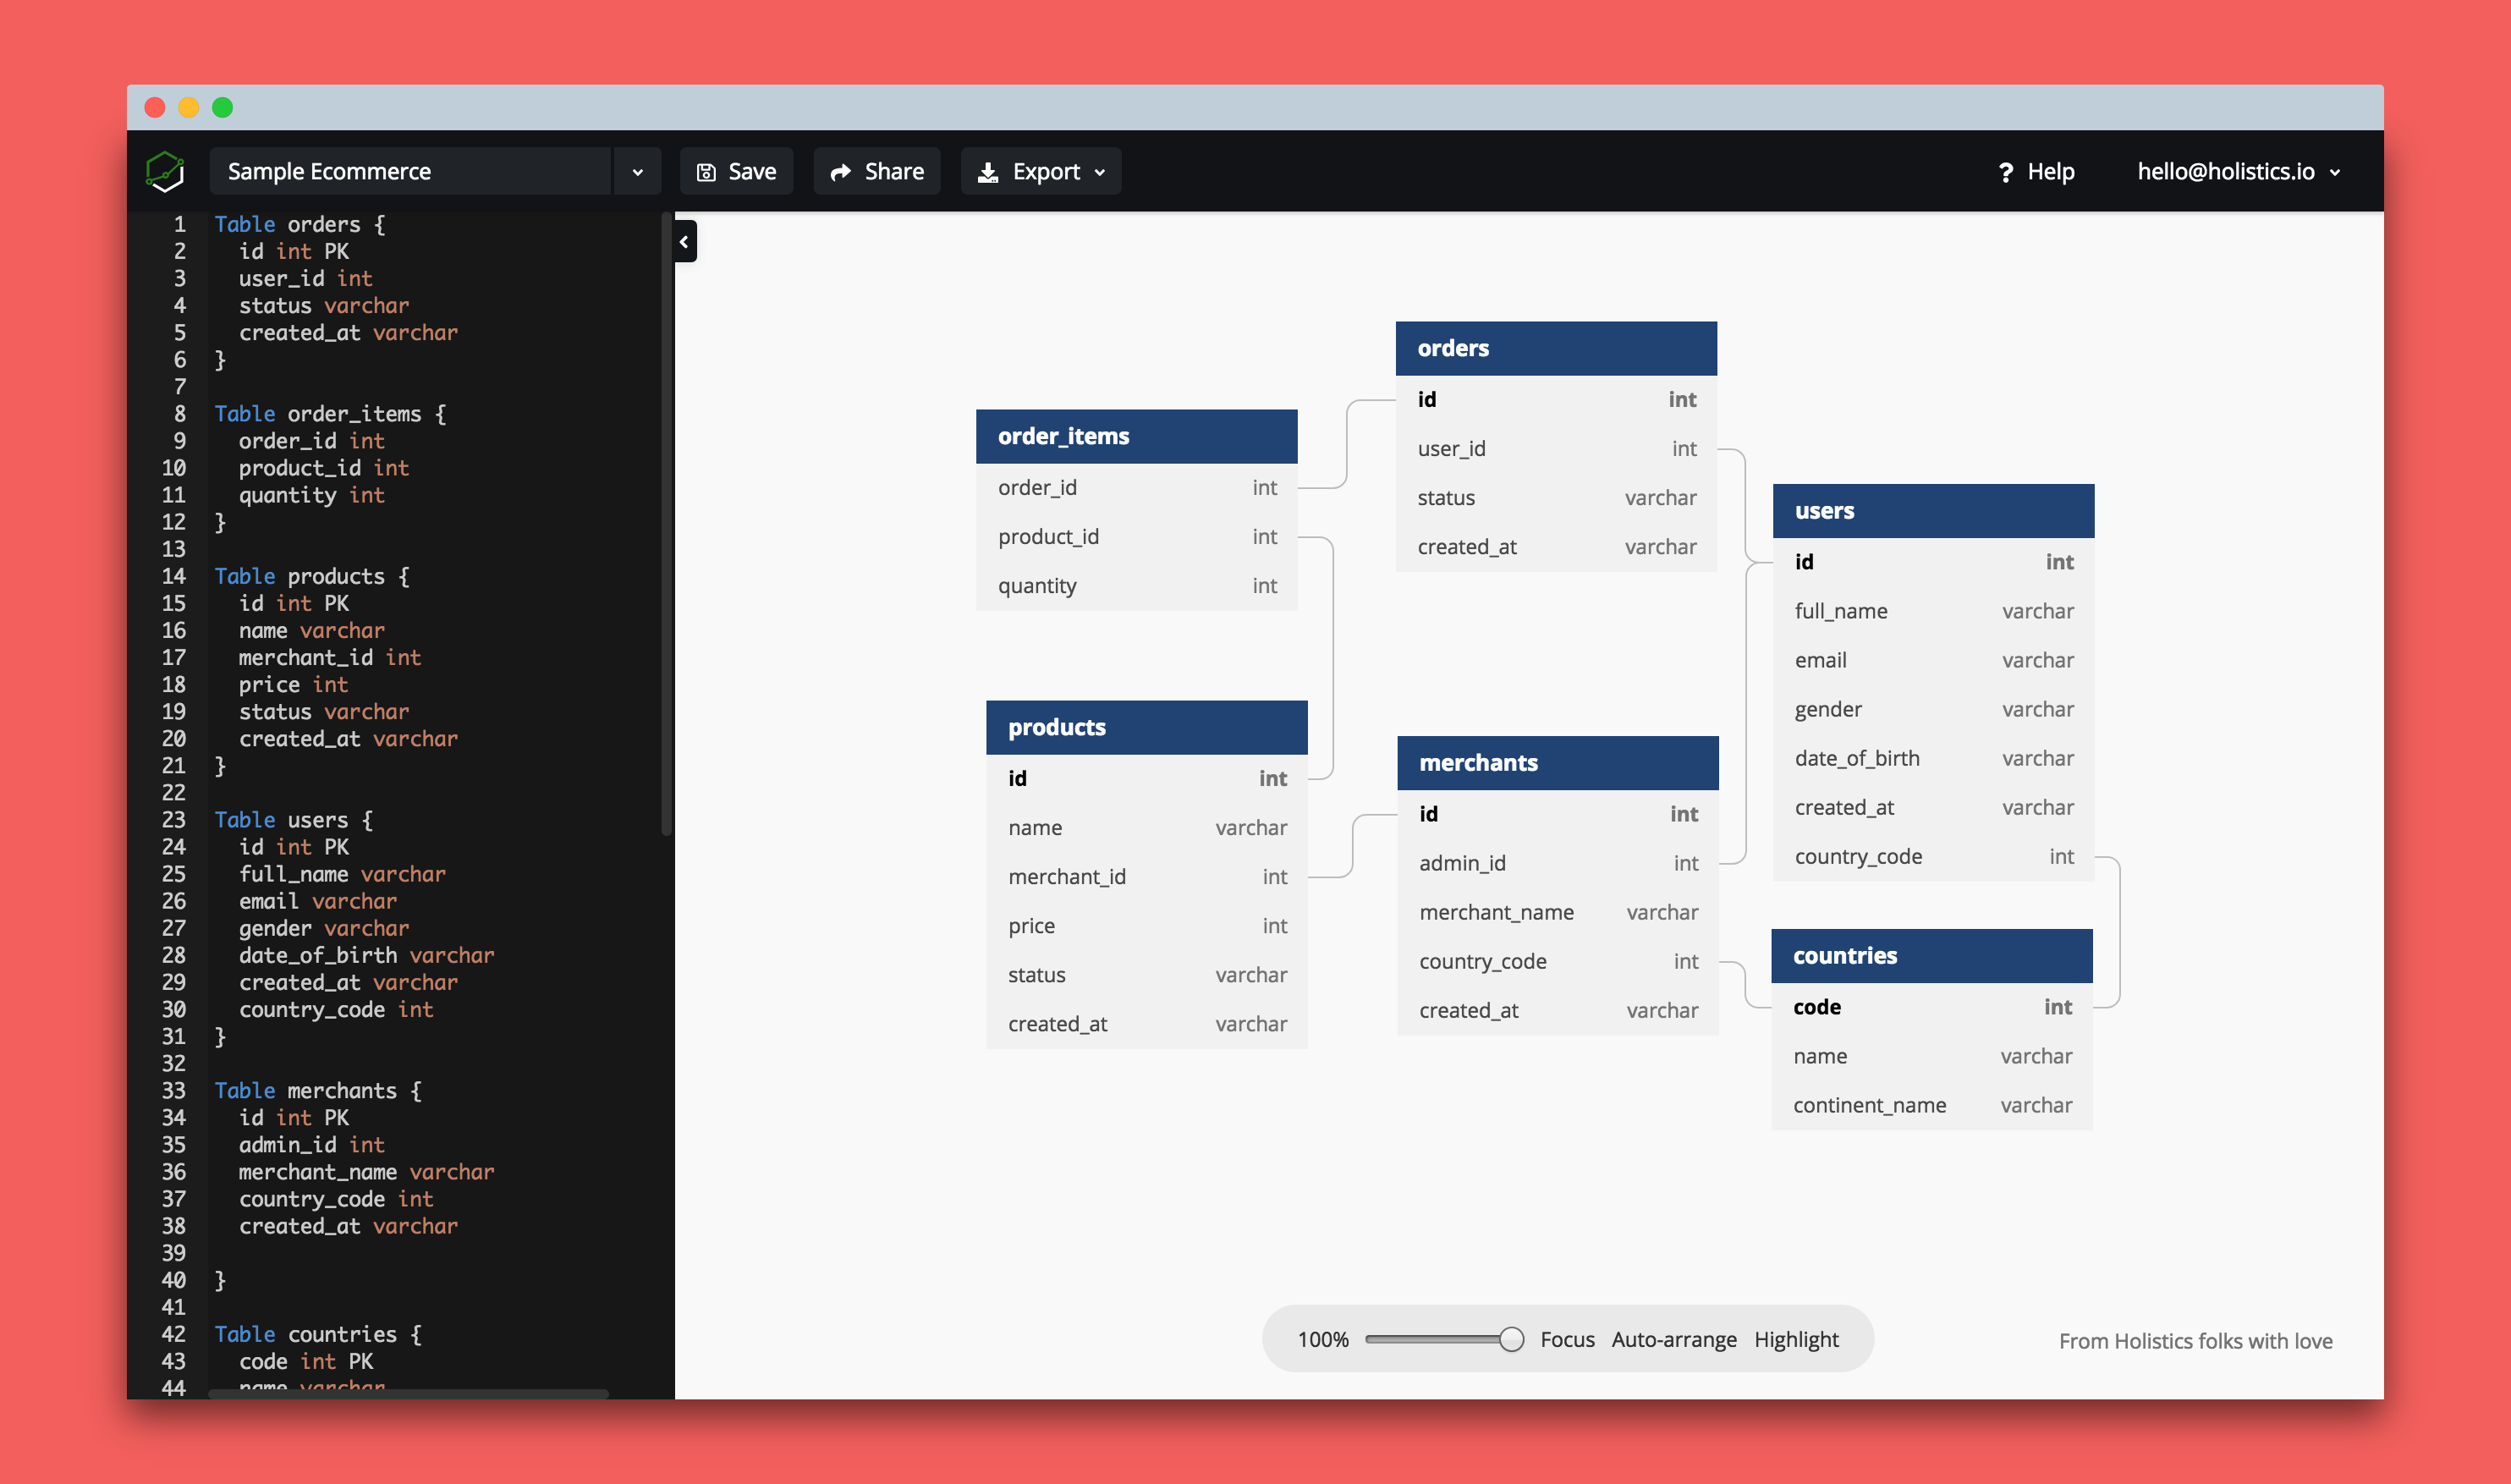
Starting as a feature developed by our interns to help our customers visualize their database schemas on holistics.io (Business Intelligence Platform) …
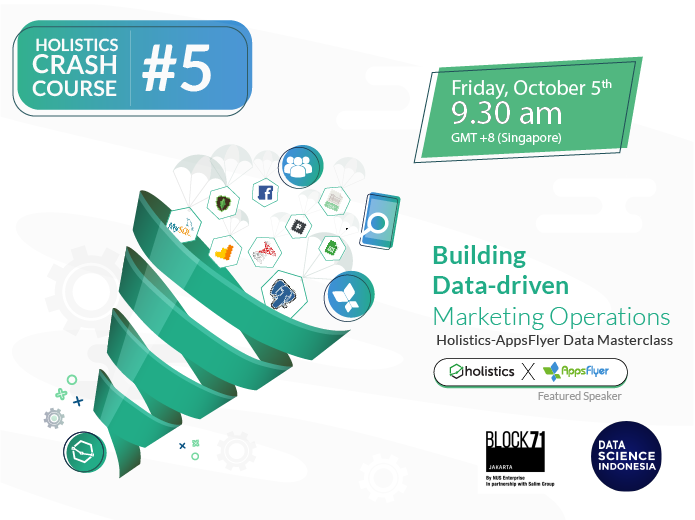
Your marketing team has tons of useful data from your mobile app for tracking and attribution. In this webinar, we show how Holistics and AppsFlyer, lets you work with these raw datasets, to automate email reporting and develop data-driven marketing operations,
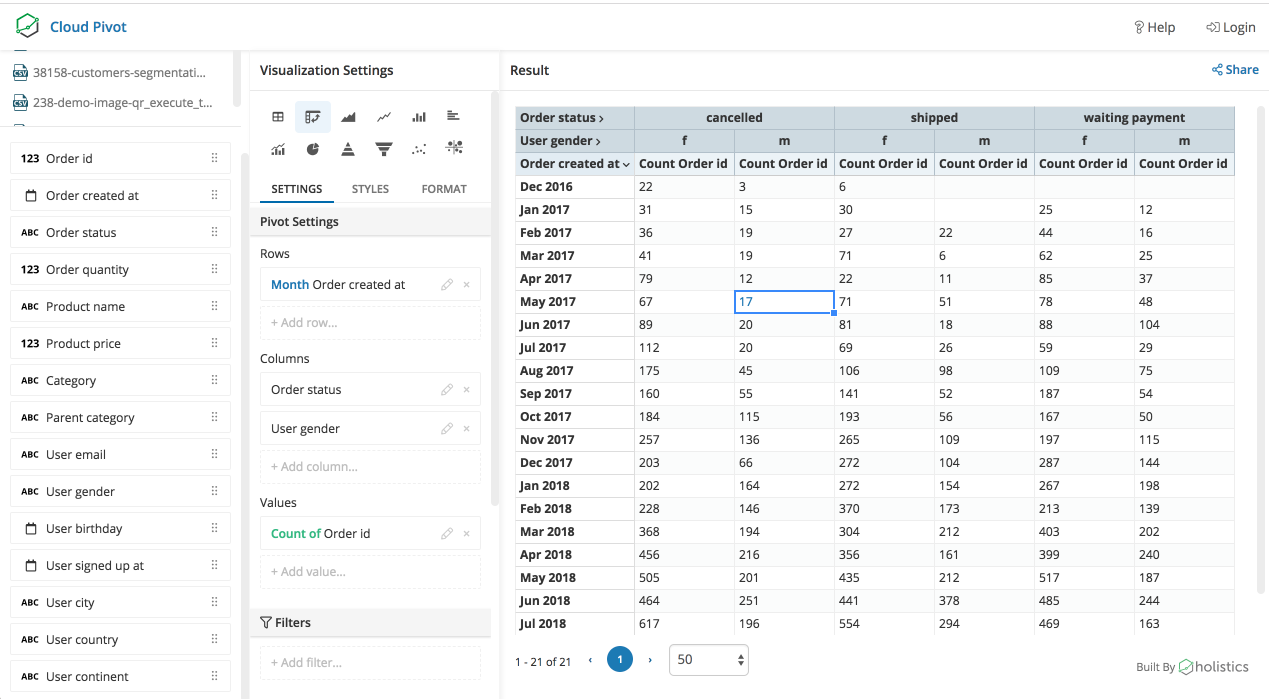
Pivot Table is a concept that allows you to summarize and aggregate a set of data by different groups of fields. The …

Fear not data traveller, though the data landscape may seem wild and treacherous, we will help you, young padawan, to navigate the …

Preparing for a data analyst interview can be intimidating. Learn a few tips to help you prepare your interview better.
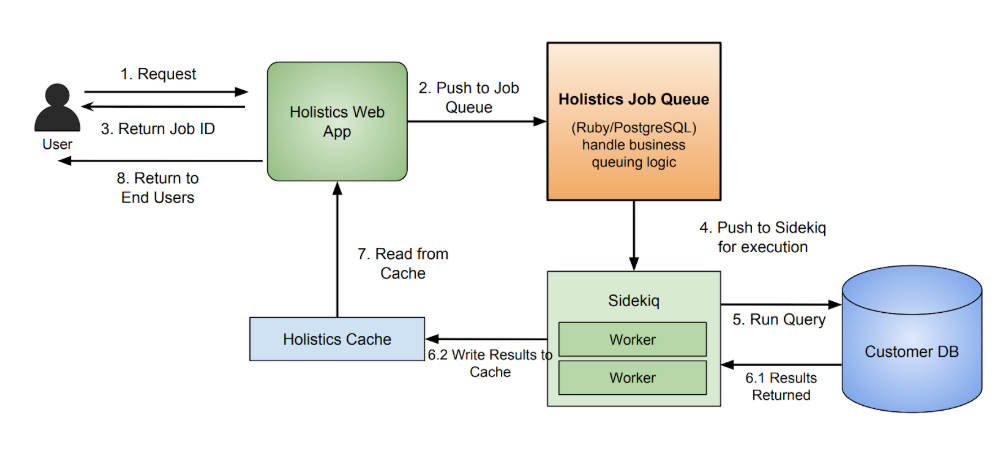
At Holistics we use Sidekiq, the de facto Ruby background processing framework. By combining the reliability of Sidekiq Pro and our own retry logic, no back-end job gets lost or forgotten.
View metrics from your Google Analytics data in a simpler dashboard format.
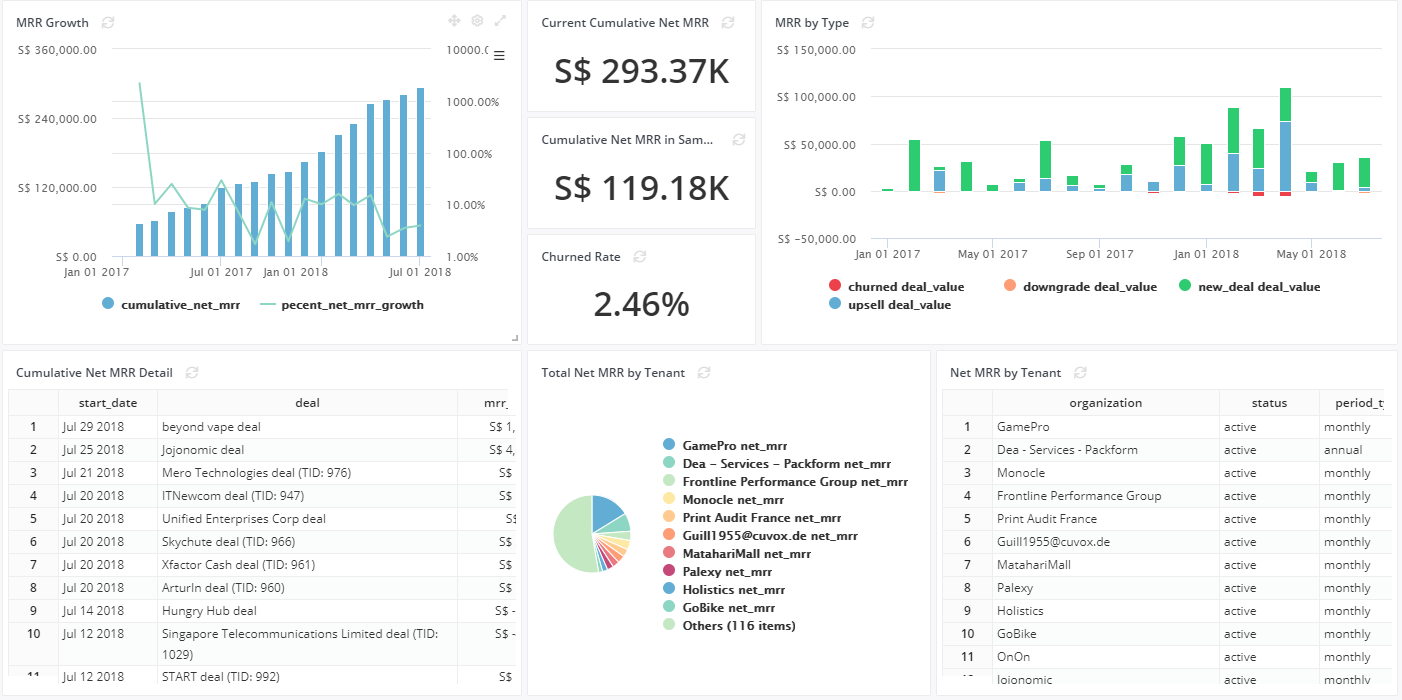
Want to customize and automate MRR reporting, to suit your company's specific data needs? Luckily, Holistics integrates with Pipedrive, here's our guide!
Struggling to draw insights regularly from your data lake? Accessing data lakes for timely insights does not need to be technical or difficult. Using Holistics and Qubole, you can schedule reports to be emailed automatically, from your data lake straight to your inbox.
Welcome back Everyone, August has been an important month here at Holistics and we are excited to share our updates this month! …
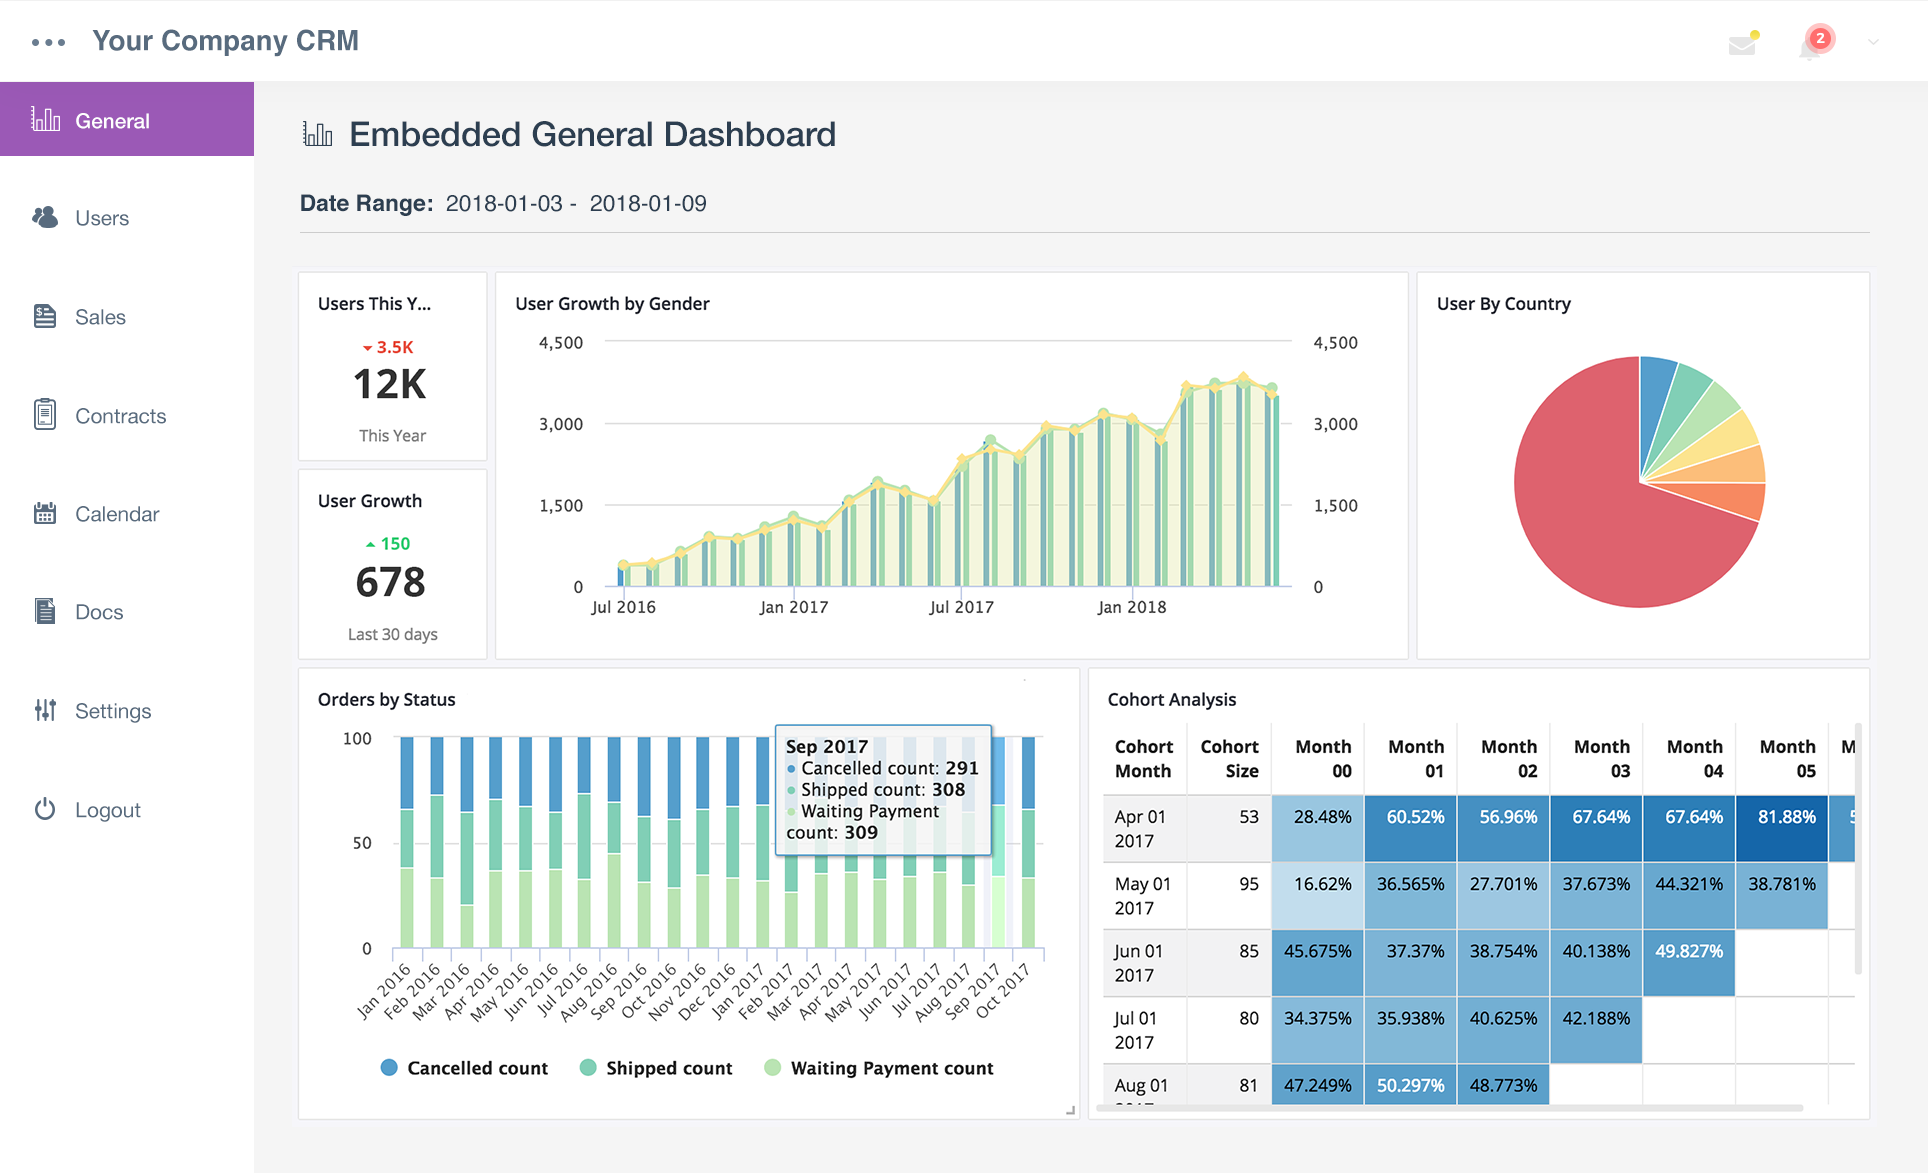
Learn about our Holistics Embedded Analytics feature, which allows our customers to embed their Holistics dashboards into their own applications or web services, using secured iframes (just like embedding a YouTube video).
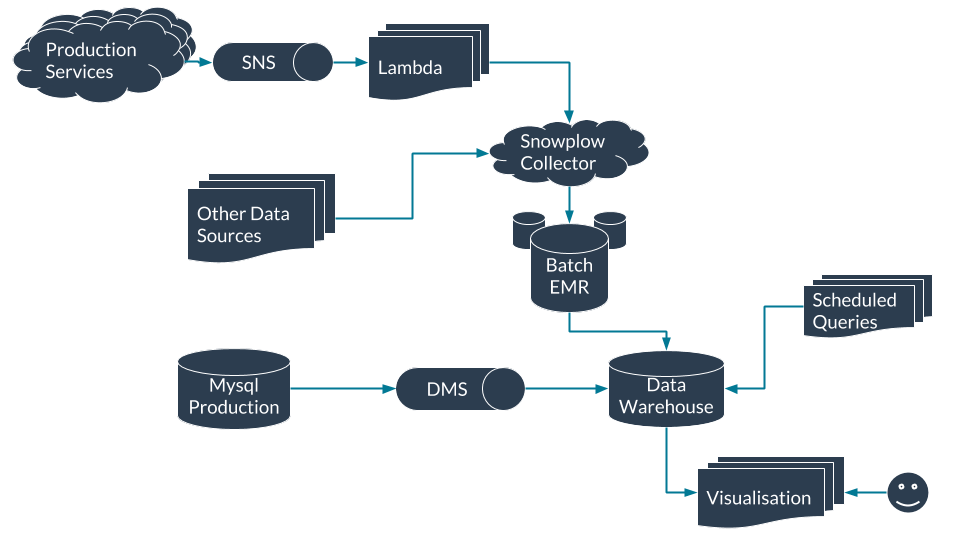
Infrastructure is only as good as the business value it provides. The use of data in a startup, becomes increasingly important as its number of users grows.
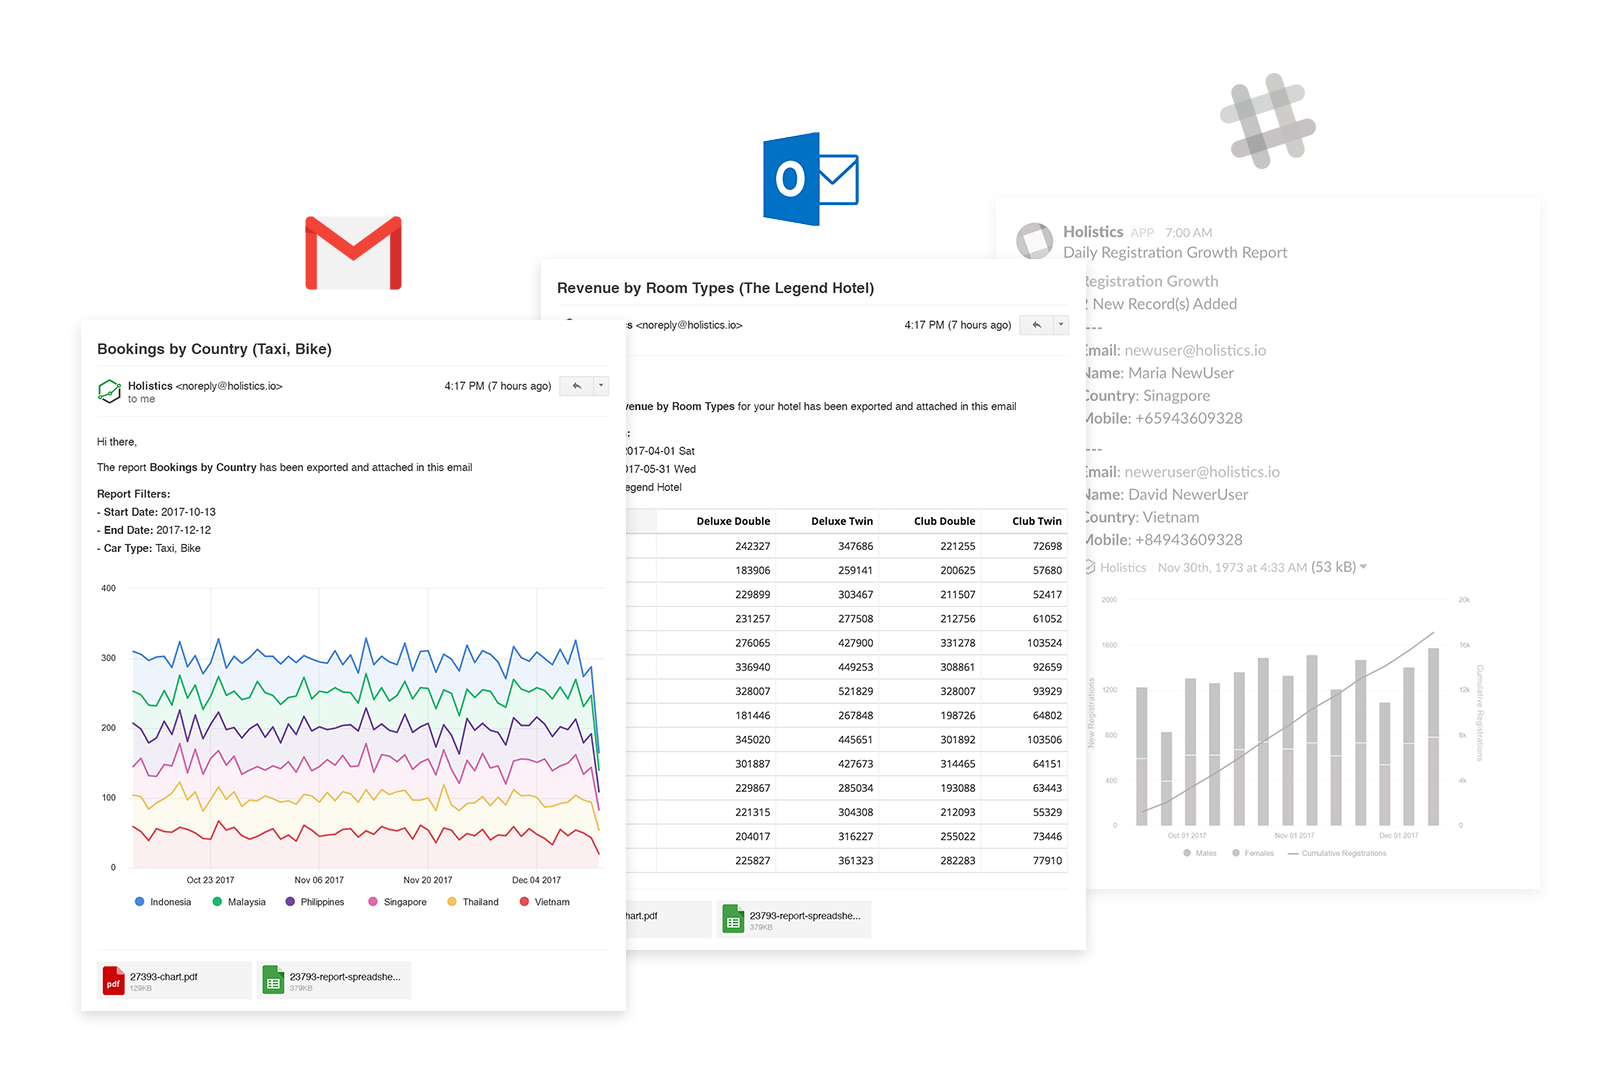
Scheduling the delivery of data insights and datasets is simple with Holistics. Now you can automatically send reports and dashboards via email and Slack, from your SQL database.
Choosing an appropriate BI tool for your business can be very difficult and time consuming. In order to avoid such constraints, we …
What to choose between BigQuerry and Amazon Redshift when it comes to build a cost-efficient, fast, and reliable data warehouse?

“It’s not about how good you are, it’s about how good you want to be” That's why at Holistics, we're always learning and thrilling for improvements, to serve our users better! Let’s have a look into what we’ve done in June 2018
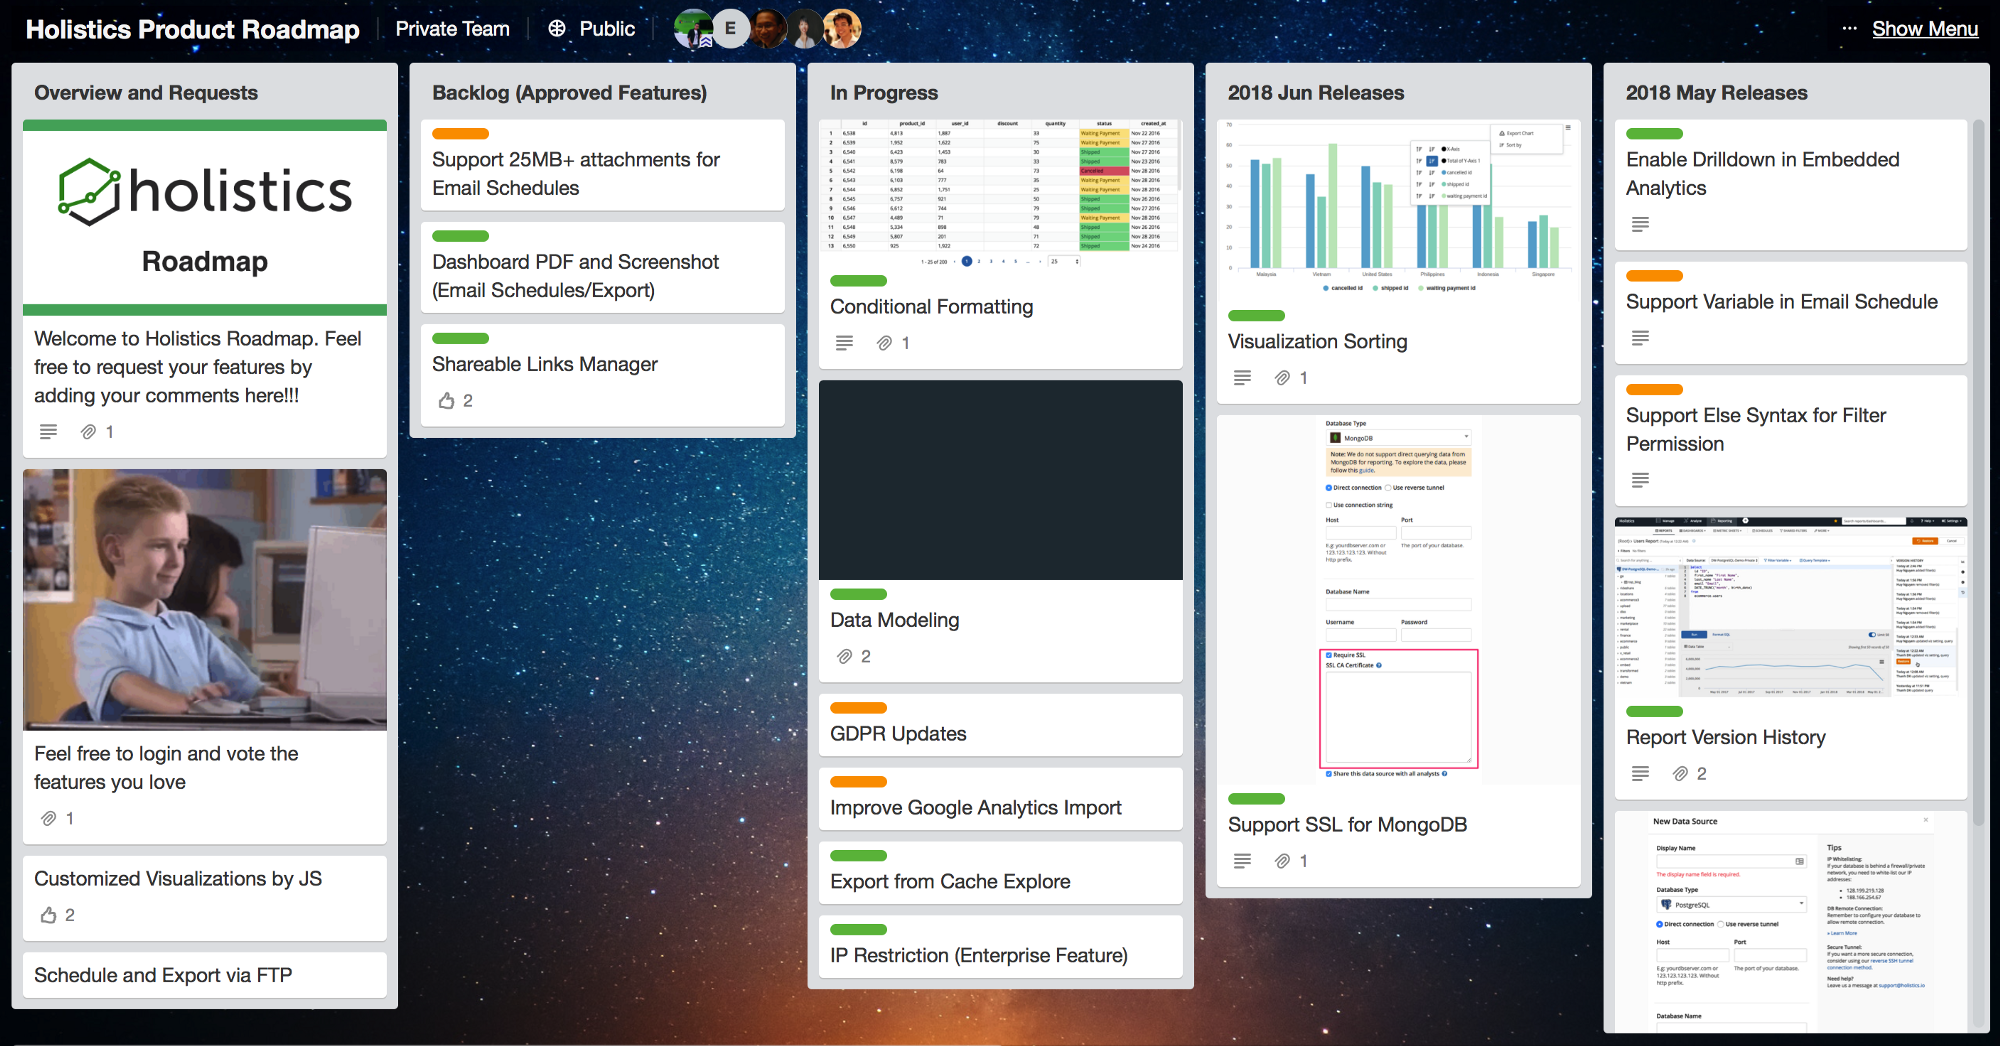
"Would be great if we have this feature…" "We really need this feature…" "Could you let me …
With the intuitive design, Holistics is not only a powerful tool for Analysts but also a lean and easy-to-use data self-serve portal for less technical users. Accessing data becomes as easy as using a phone app. No training required!

Imagine that you have some reports that contain sensitive or confidential data that should show certain columns basing on the users who …

On May 21st 2018, the Holistics team hosted a webinar about controlling data access in organizations. In this article, you will find …
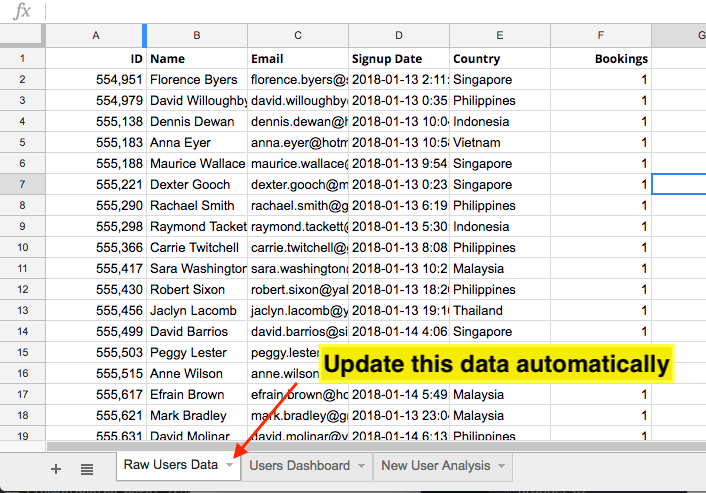
Learn how to use Scheduled Google Sheets Export to get your data from different sources into google spreadsheet and update them automatically.
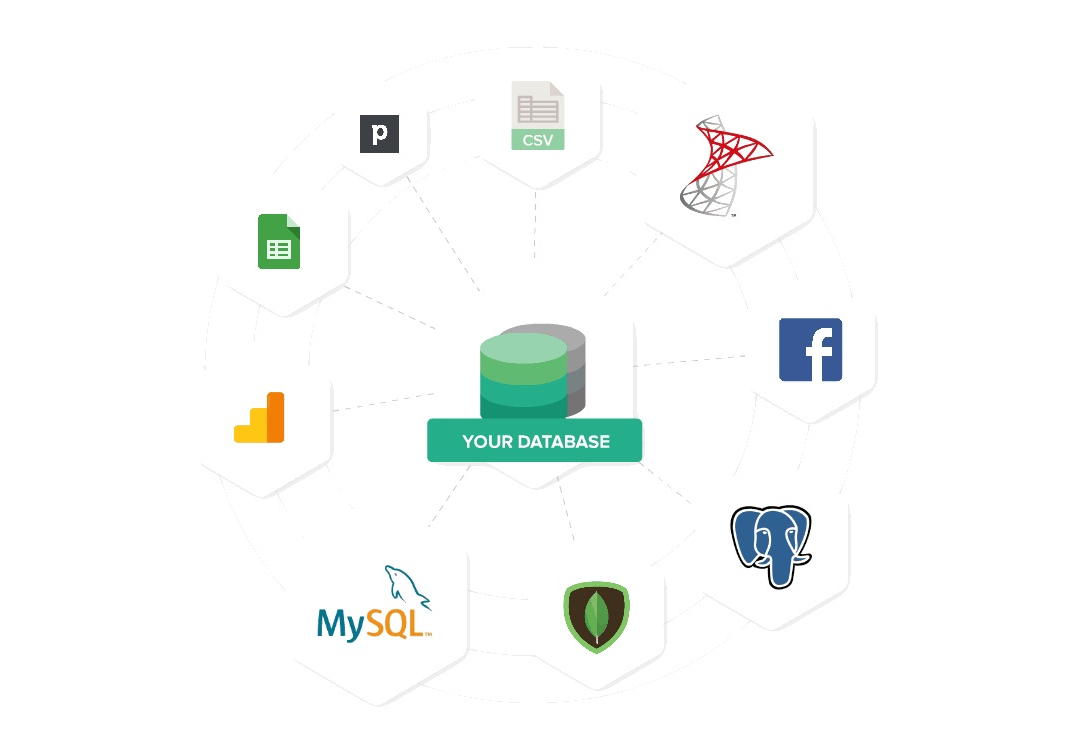
High level guide for data analysts and engineers starting their first data warehouse project.

When people think of data analytics, they often think of charts and visualizations. However, the 10x data analyst cannot just be a visualizer. There are several abilities and techniques that a data analyst requires to truly become fully empowered and effective.
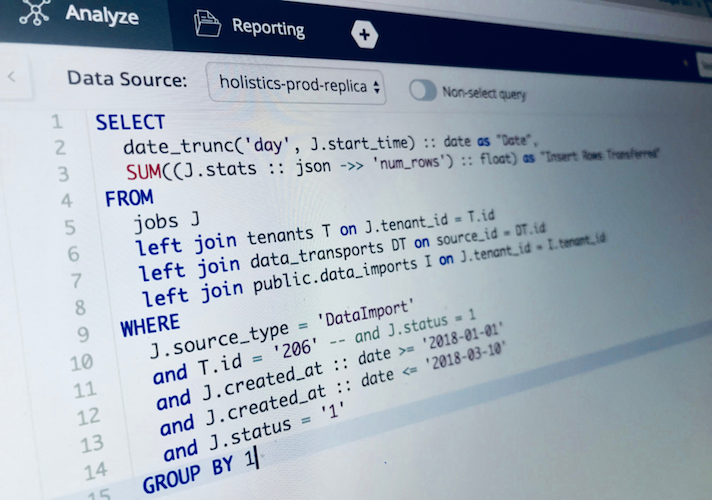
As a derivative of the development of technology, the importance of data to business is indisputable. Converting that information into insights becomes a business advantage. Understanding data flows to be able to work with data is essential for all Analysts.
Holistics celebrate Lunar New Year 2018 with festive designs.

How do you usually interview a data analyst candidates? In this article, I'll share some of the guidelines and areas you can focus on when interviewing a data analyst candidate. These serve as pointers to aid with your interview.
The term "Data Lake", "Data Warehouse" and "Data Mart" are often times used interchangbly. But what …
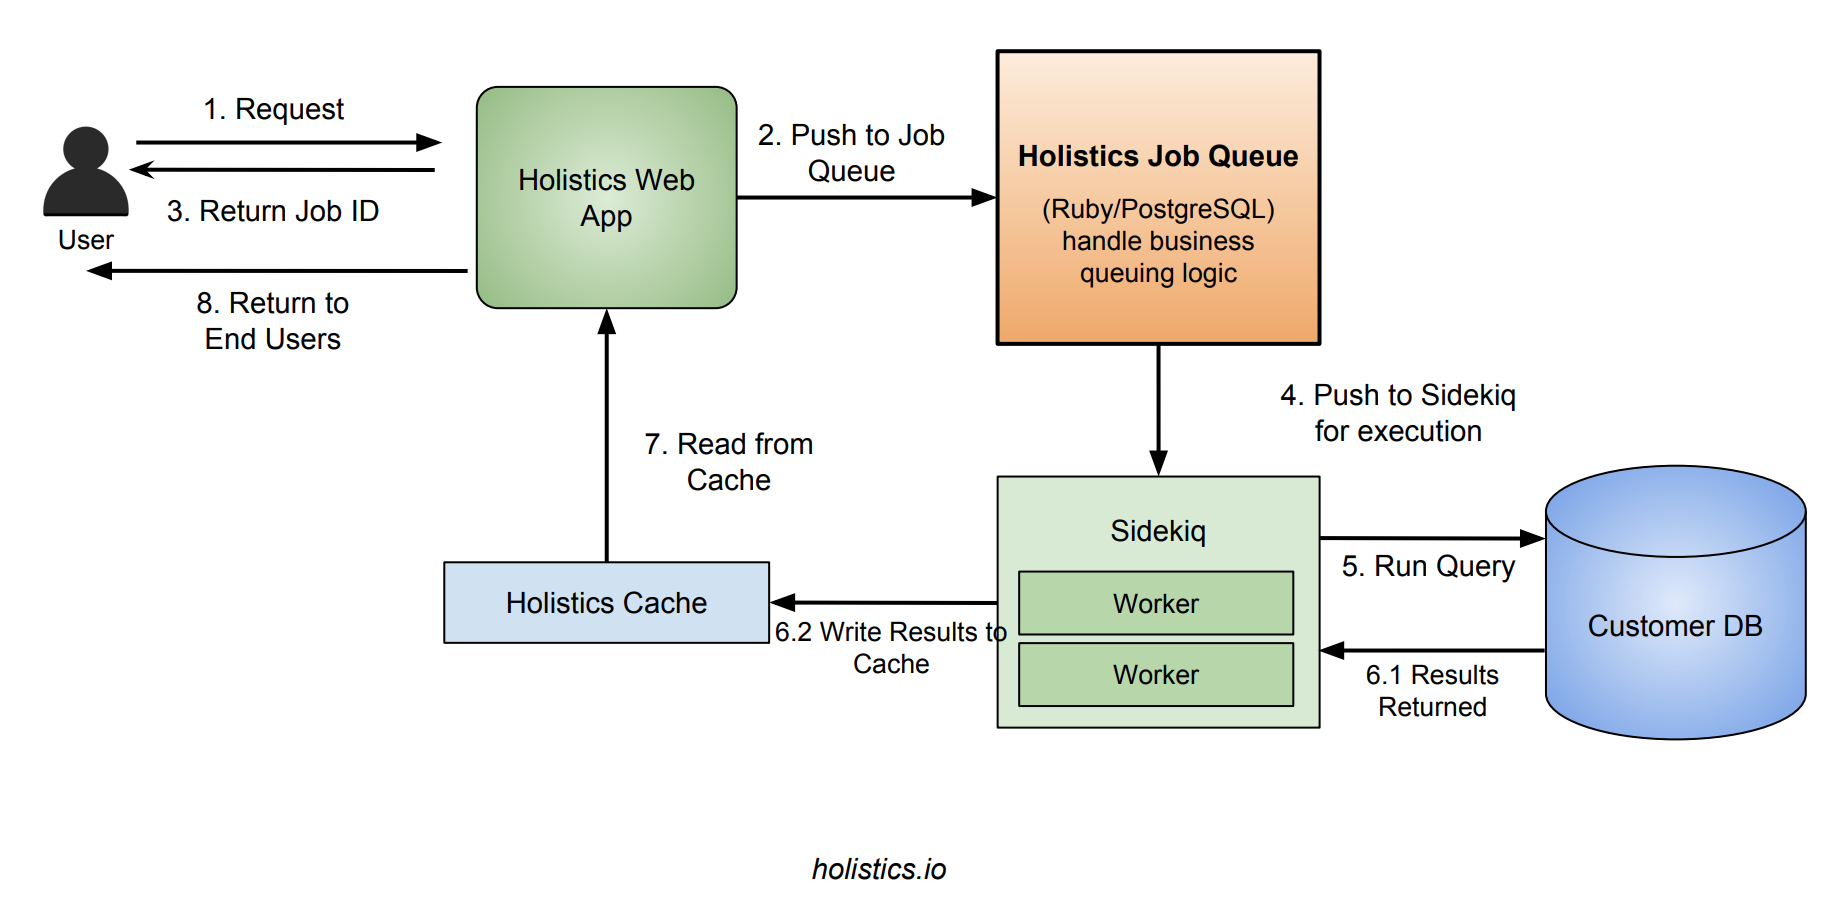
Why and how we built a multi-tenant job queue system for our B2B SaaS Application with PostgreSQL and Ruby
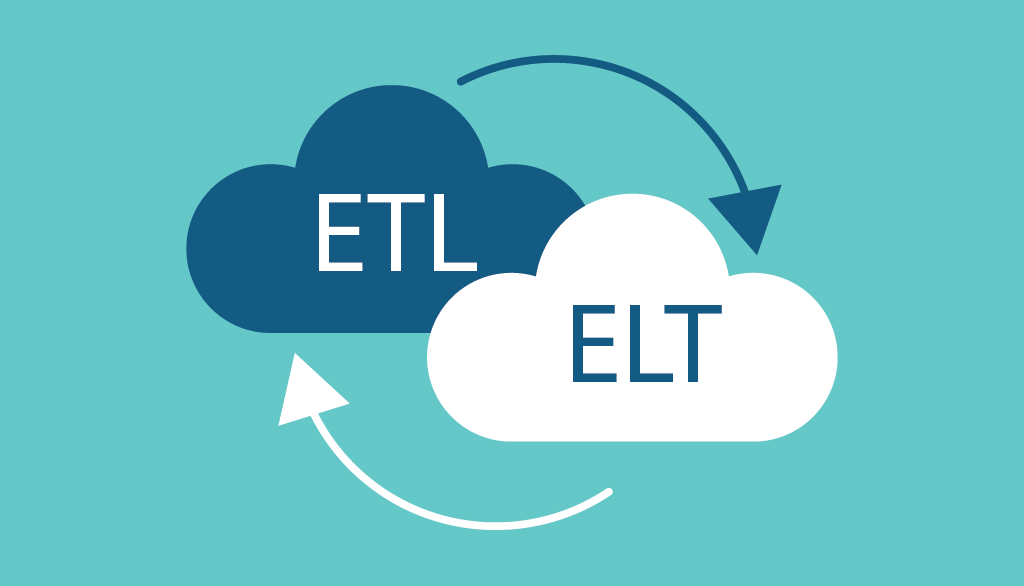
In any organization’s analytics stack, the most intensive step usually lies is data preparation: combining, cleaning, and creating data sets that …
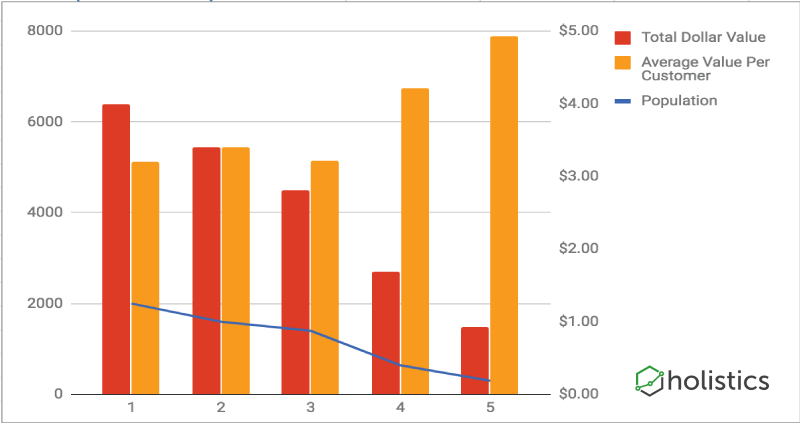
As business owners, understanding your customers’ behaviour is among the key things that will help you grow your business. If you’re …

A common problem that data analysts and report users face is slow dashboards, making users wait for charts and reports to load. …

In his early days of investing, Warren Buffett drove to the airport at Omaha to pick up David Strassler, a New York based businessman whose family bought and fixed distressed companies.

Cohort Retention Analysis is a powerful thing that most business owners need to look at. In this post, I'm going …

Below are some useful Postgres queries for both troubleshooting, monitoring and analytics purpose. Note: if you're looking for a simple …
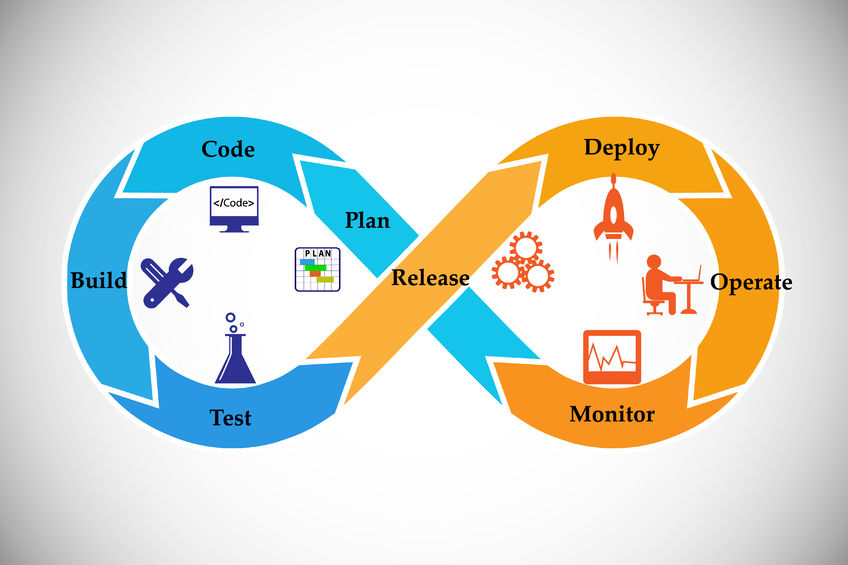
The benefits of how an engineering-driven culture drives the growth of Holistics, a data analytics company

As I'm writing this, we've just removed the last line of AngularJS code from our application codebase, ending …

A common requirement in data reporting is converting data present in row-form to a dataset that is organized in a columnar format. …
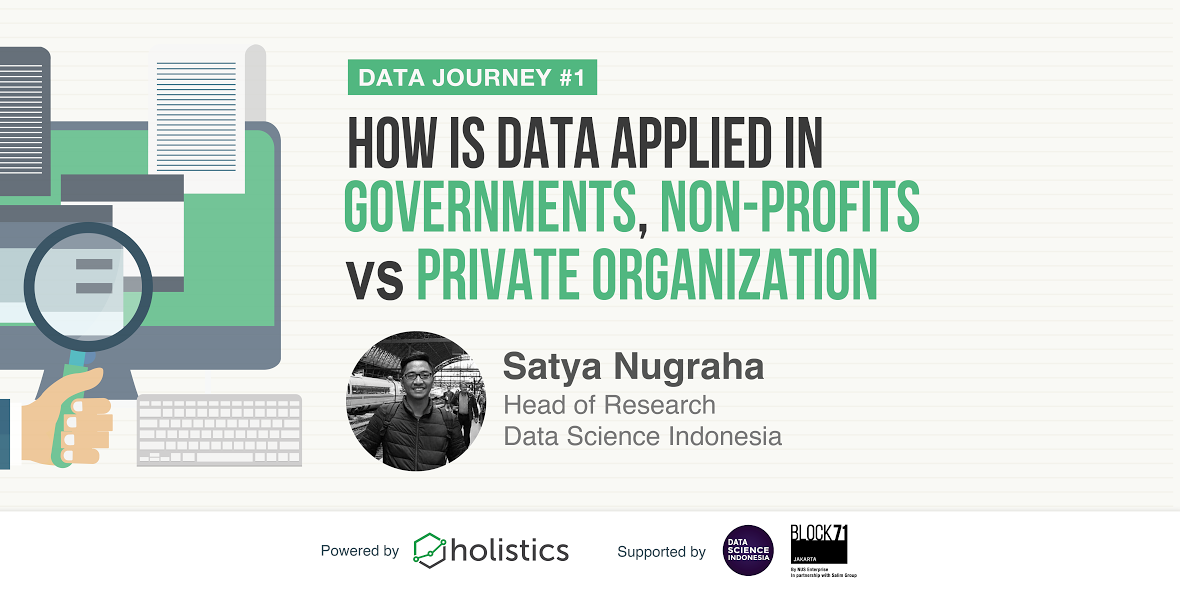
Thanks for joining our recent inaugural session of our Holistics Data Journey webinar series, on "How Is Data Applied In Governments, …

How Holistics help to join, standardize, clean, pre-process, transform data for reporting.

How Holistics Business Intelligence helps customers combine data from different sources. Without storing their data.

3 key reasons why data analysts love Holistics
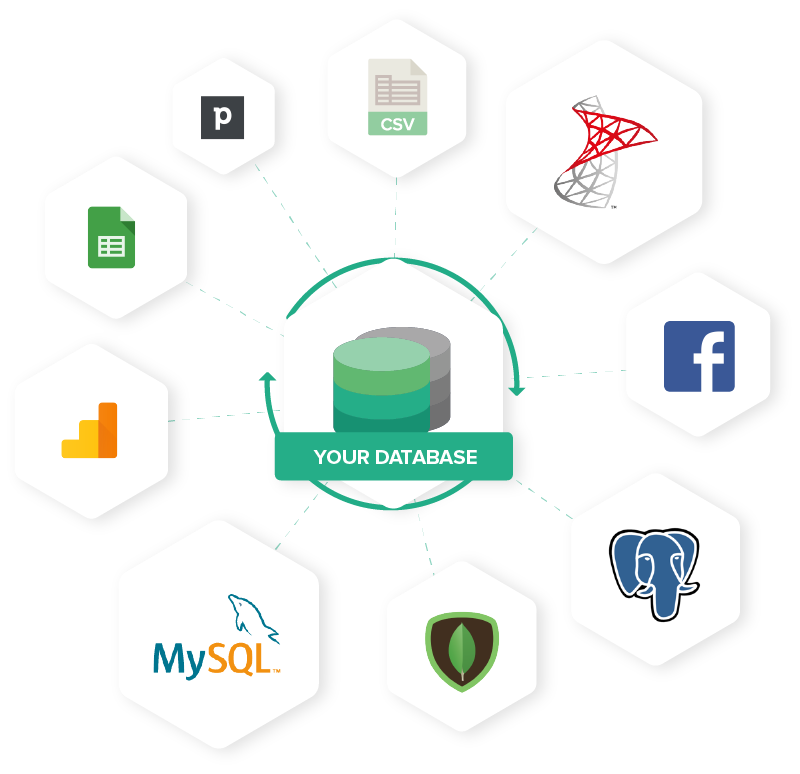
Analyze how the way different vendors addresses the problem of combing data from different sources
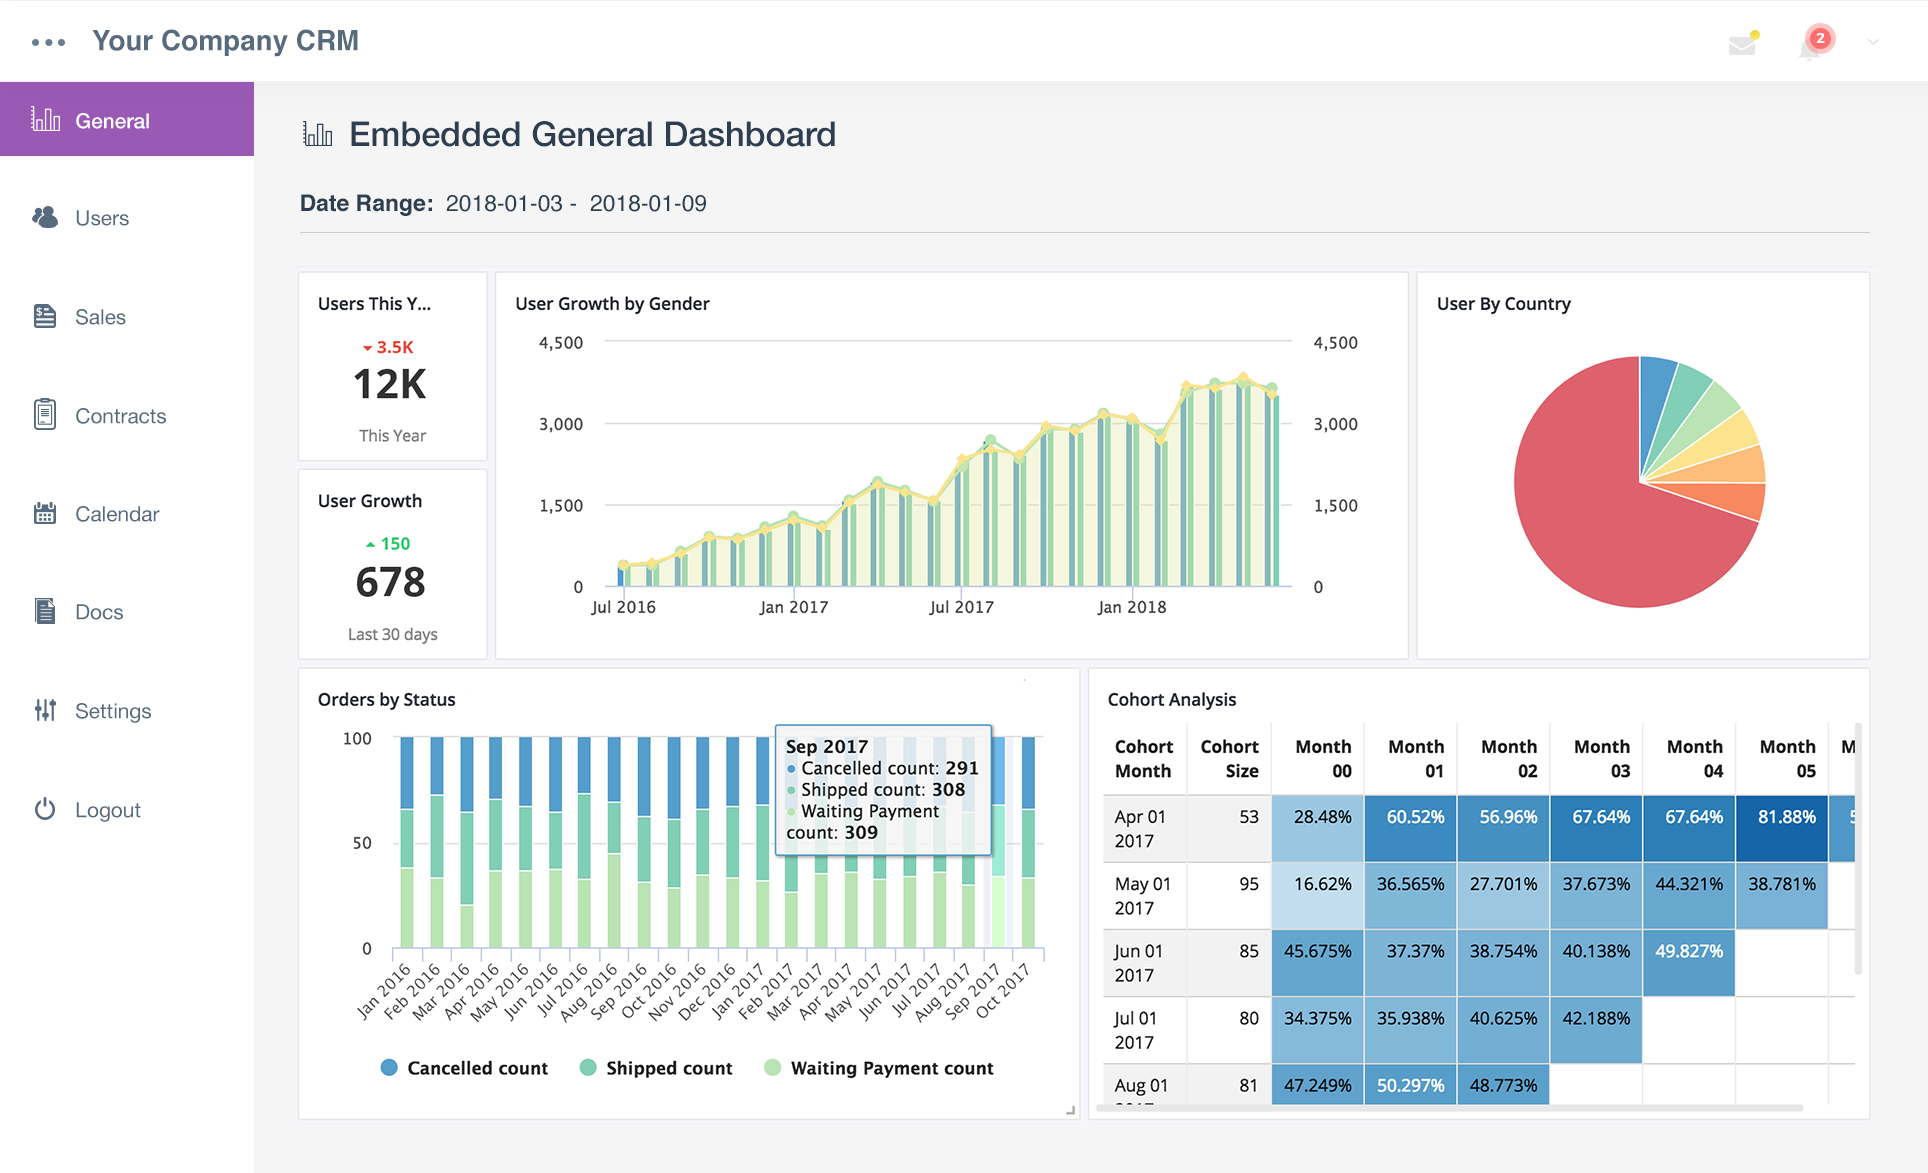
As startups and tech-enabled companies, often times we are sitting upon invaluable data for making decisions, be it for conversion, retention or …

Y-Combinator (YC) has always been recognized as one of the top accelerators/incubator for promising startups to apply for. They recently launched …
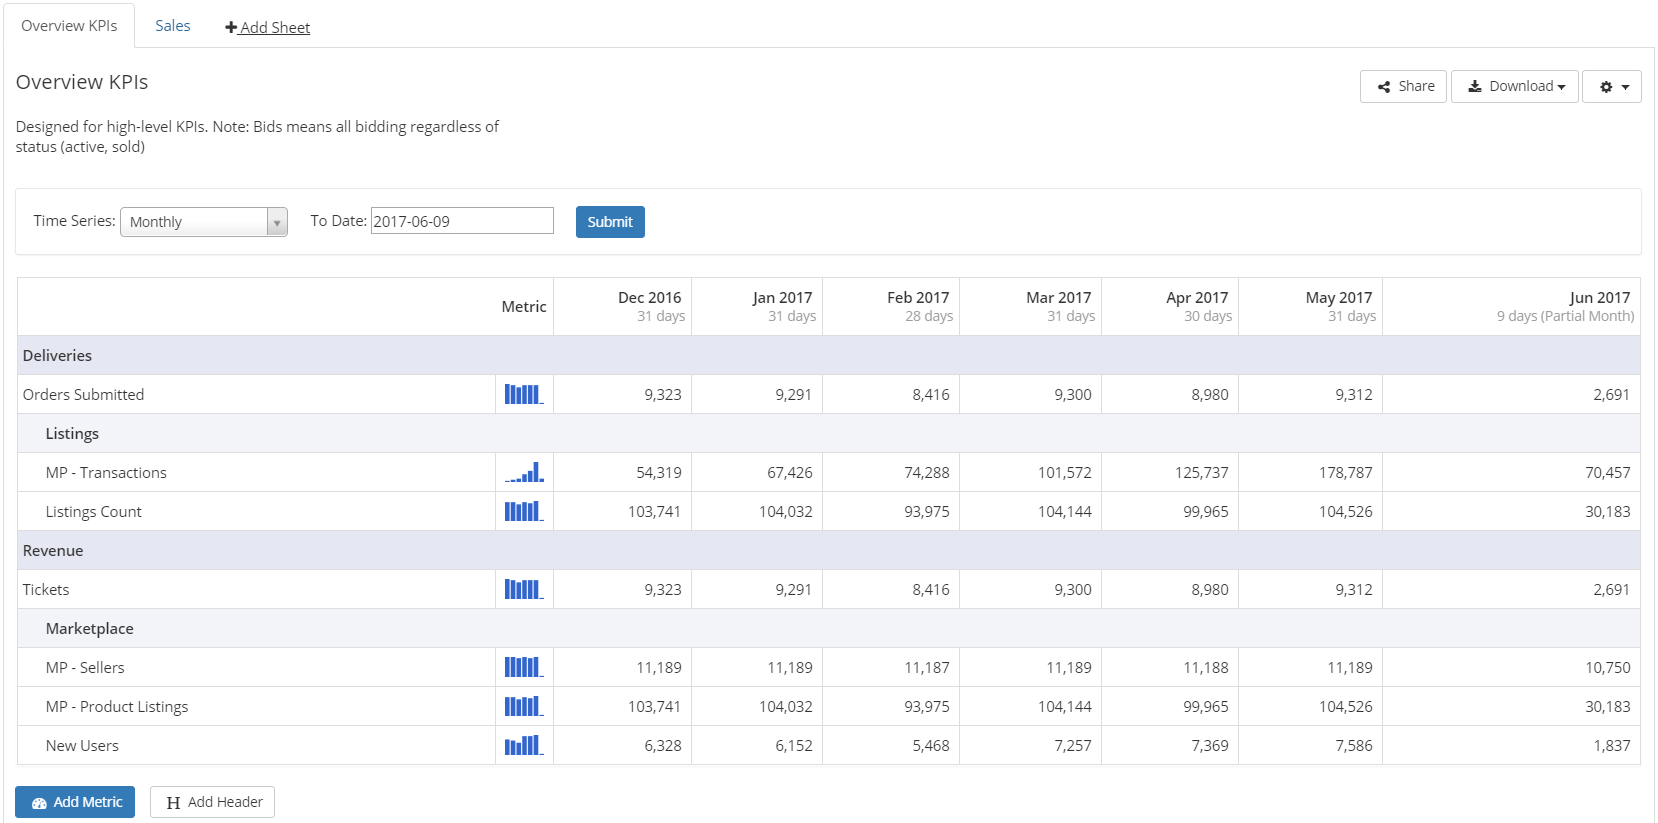
It's just been slightly over a week since our last release, and already we've launched the next one! …
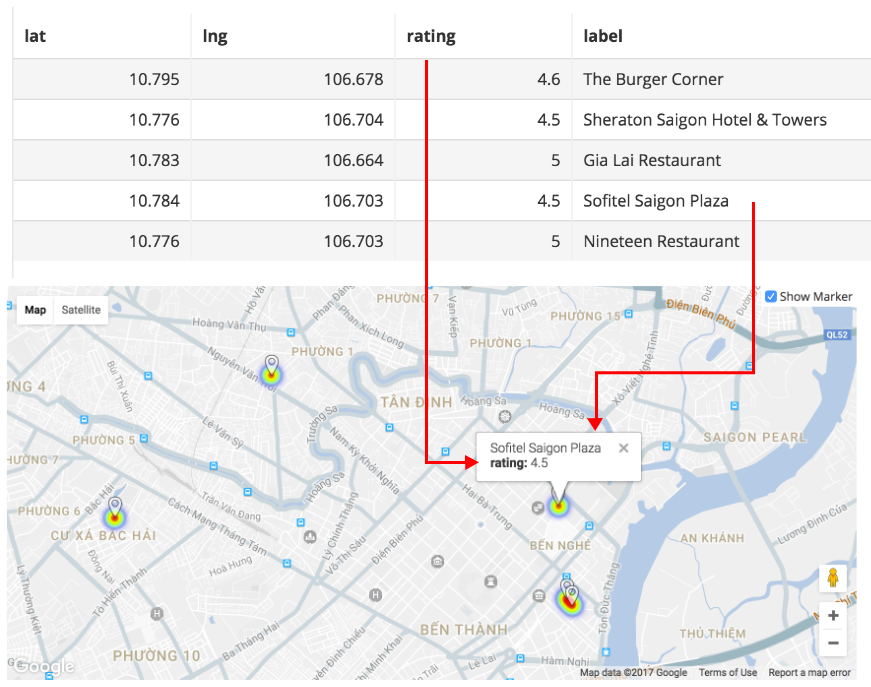
In our new Holistics release (v1.29), we finally unveiled a popularly requested feature: Geo Heatmaps! Our engineering team has been working …

As you progress in your business, it's becoming more and more difficult to keep track of the small or big …

Recently one of our customers, Grab - the Uber's competitor in SEA, unicorn startup - published a blog post on …

In our last release (v1.22), we've supported the ability for you to freeze your table header. This is among …

In this article I will show you how to build daily user growth report with cumulative number (running total) using mostly SQL, …

There was a time when being a power Excel user gave you an edge in your resume – it implied that you can …

Holistics helps you present any queries from your database as online reports and dashboards. As Holistics does not store your data, you …

We've worked with a lot of customers who writes SQL on a regular basis. And from time to time they …

As engineers we refactor and abstract our code regularly, this is part of process to improve our code quality and scale up …
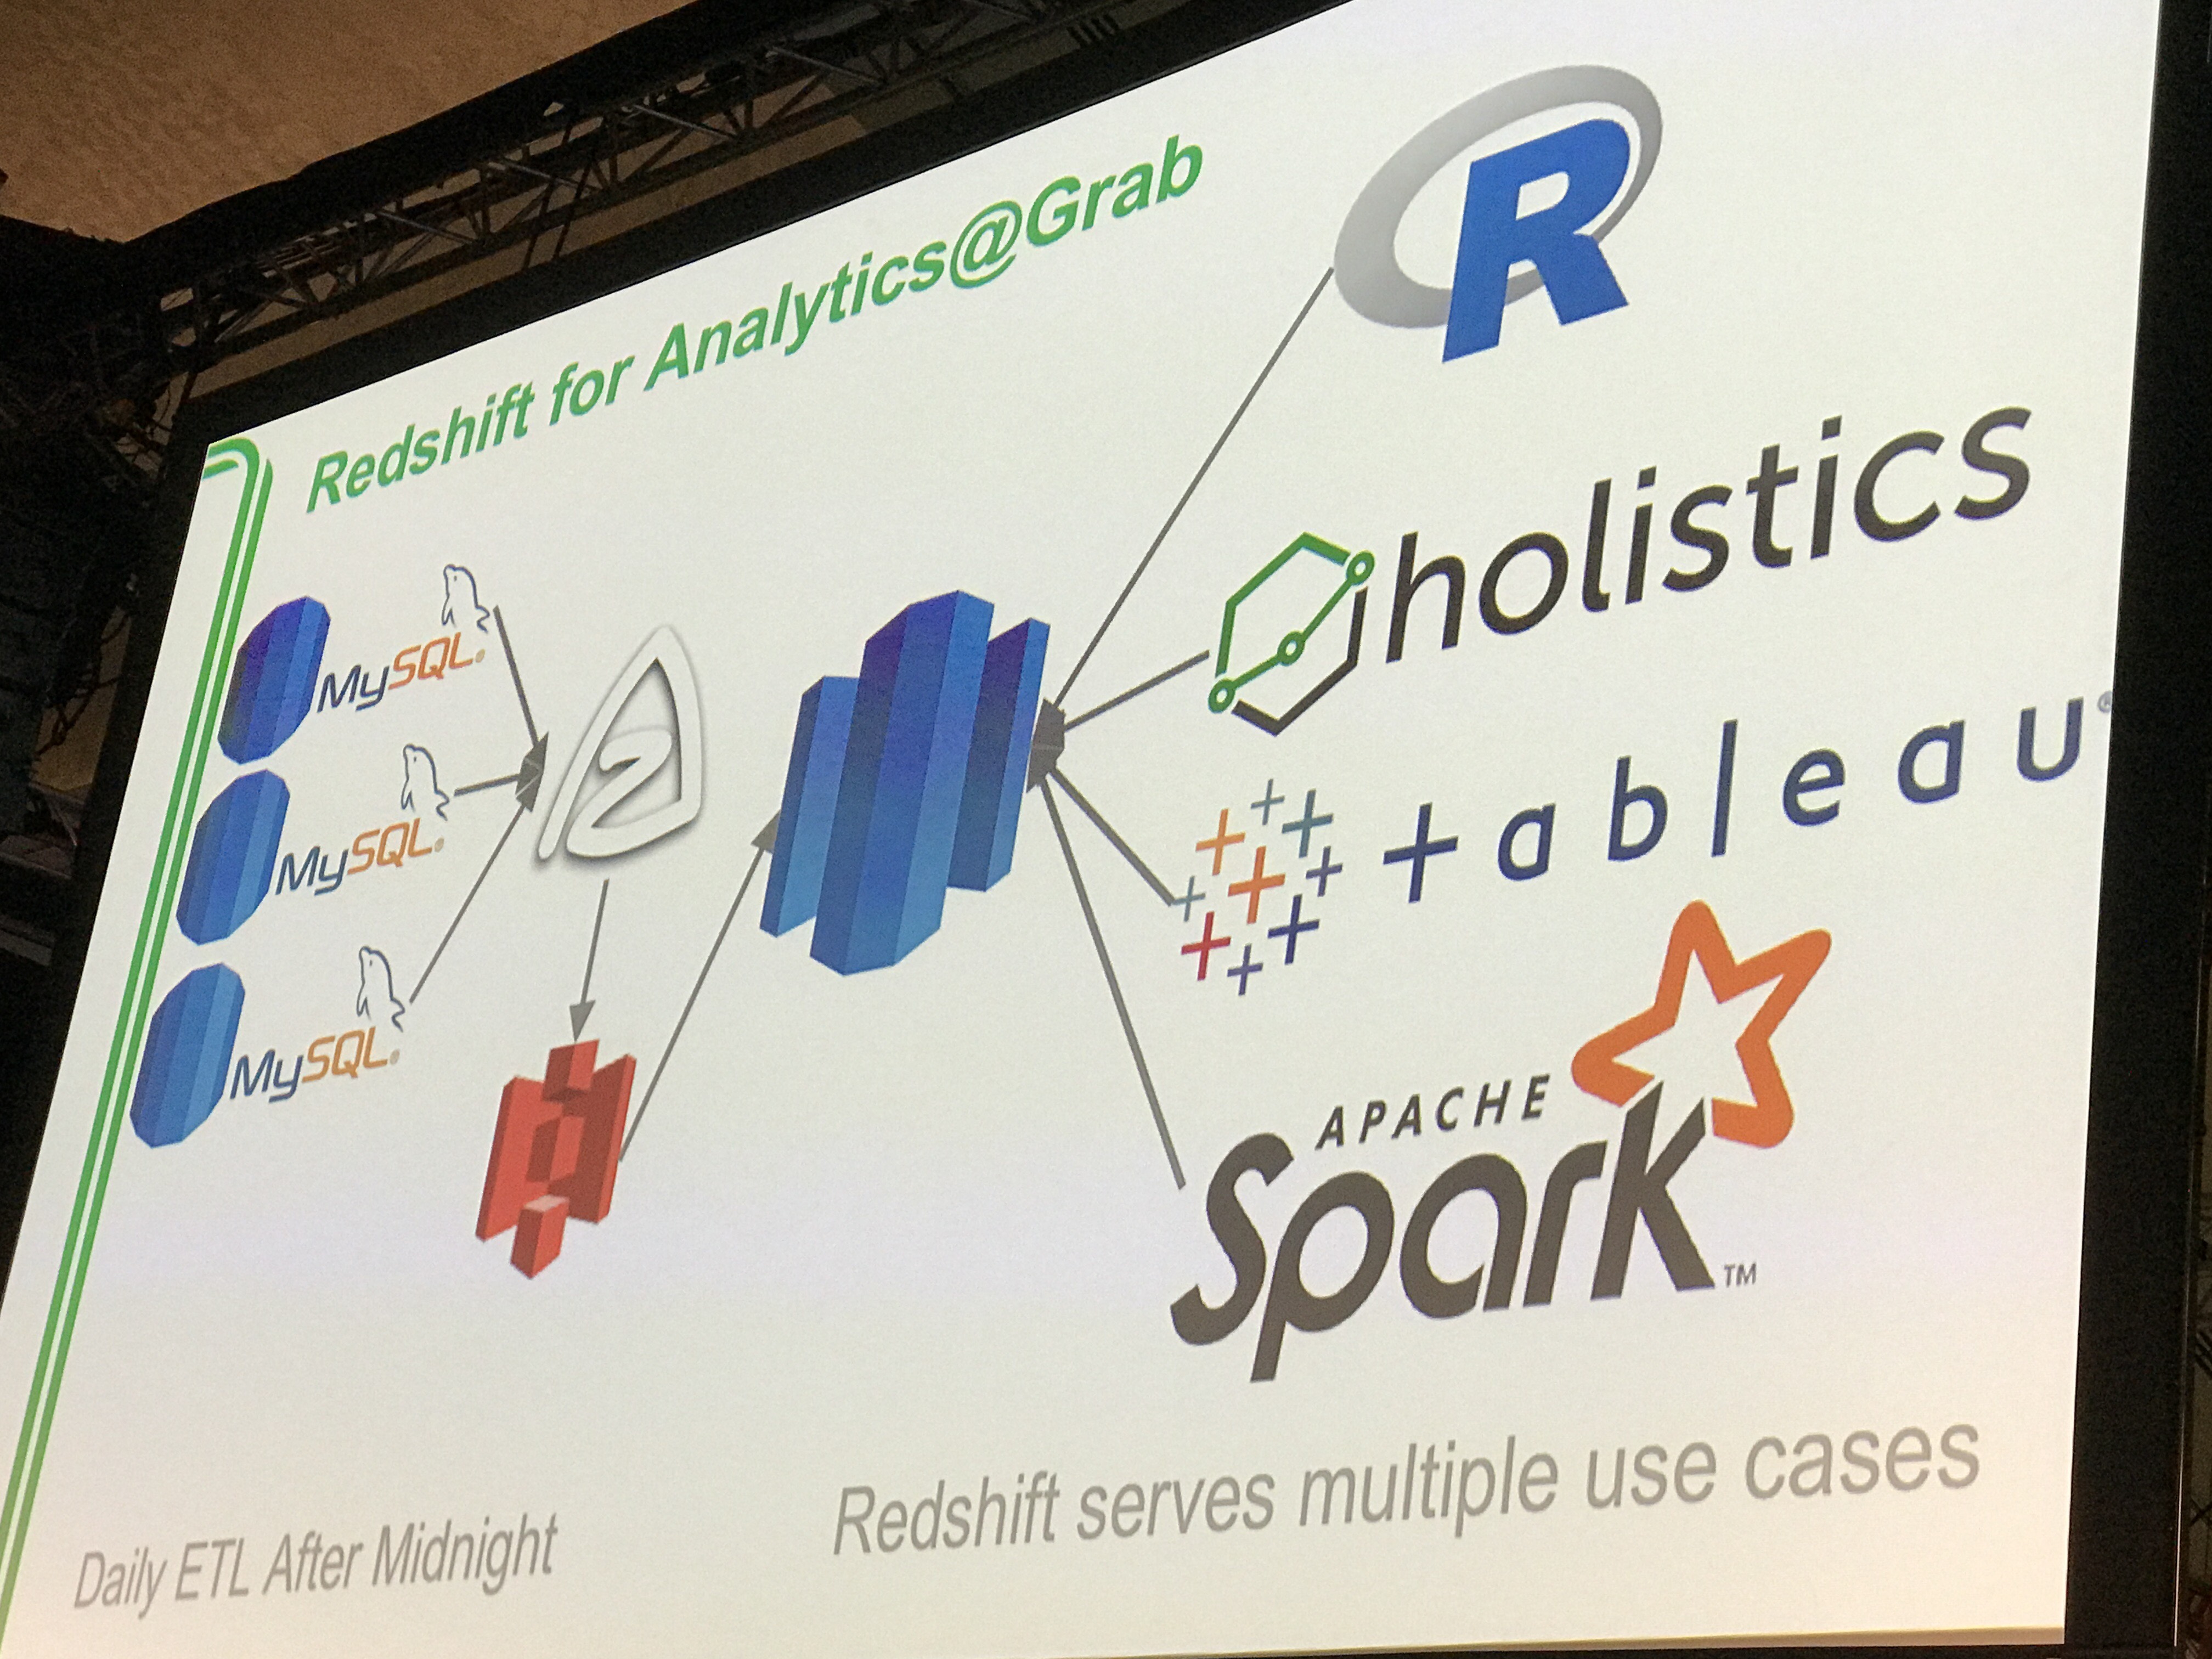
Holistics gives you more flexibility and control over Tableau for data extraction and preparation. Holistics featured at Grab Engineering's presentation …

Being an analytics/reporting product company, we’ve worked with a fair amount of customers who run Postgres/Redshift for their analytics, …