The rise of SQL-based data modeling and DataOps
The resurgence of SQL-based RDBMS
If there is one analytics trend we can all agree on, it is that we've seen a vast increase in the amount of business data collected in the past decade. A typical business today uses dozens if not hundreds of cloud-based, subscription-as-a-service software, for all sorts of purposes. Together with more traditional in-house enterprise software, the average business produces a mountain of data today, compared to just a few years ago.
The savvier businesses are the ones who have found great value in analyzing their data, in order to make informed decisions, causing a tremendous uptick in both the demand and the supply of data management systems.
Up till a few years ago, the traditional way of managing data (in SQL-based RDBMSs) was considered a relic of the past, as these systems couldn't scale to cope with such a huge amount of data. Instead, NoSQL systems like HBase, Cassandra, and MongoDB became fashionable as they marketed themselves as being scalable and easier to use.
Today, there seems to be a resurgence of SQL-based database systems
Yet today, there seems to be a resurgence of SQL-based database systems. According to Amazon's CTO, its PostgreSQL and MySQL-compatible Aurora database product has been the “fastest-growing service in the history of AWS”.
SQL-based MPP (massively parallel processing) data warehouses, which used to be expensive and could only be purchased by big enterprises, have now moved to the cloud and are increasingly commoditized. All the major cloud providers today have their own MPP data warehouses: Google has BigQuery, Amazon has Redshift and Microsoft has Azure Data Warehouse ... and that's not to mention Snowflake — an independent data warehouse vendor that was recently valued at $3.9 billion. Everyone can now spin up their own data warehouse ... and pay by the minute, which was unheard of just a decade ago.
These developments have brought tremendous power and unprecedented access to data analysts, for they may now execute complex analytical queries and get the results in seconds or minutes instead of hours like with traditional data warehouses.
SQL for data analytics
For data analytics, the reasons to this resurgence are simple to understand:
- NoSQL sucks at analytical queries: the lack of joins means it is almost impossible to write complex analytical queries on these databases.
- No standardized query language: each vendor creates their own language to query their NoSQL database, which adds friction and learning curves to analysts.
SQL, on the other hand, is ubiquitous and standardized. Almost every data analyst is familiar with it.
In Google's own words about their massively scalable in-house data management system, Google Spanner:
The original API of Spanner provided NoSQL methods for point lookups and range scans of individual and interleaved tables. While NoSQL methods provided a simple path to launching Spanner, and continue to be useful in simple retrieval scenarios, SQL has provided significant additional value in expressing more complex data access patterns and pushing computation to the data.
Spanner’s SQL engine shares a common SQL dialect, called “Standard SQL”, with several other systems at Google including internal systems such as F1 and Dremel (among others), and external systems such as BigQuery… For users within Google, this lowers the barrier of working across the systems. A developer or data analyst who writes SQL against a Spanner database can transfer their understanding of the language to Dremel without concern over subtle differences in syntax, NULL handling, etc.
Together with the rise of cloud-based MPP data warehouses, SQL has now become a very attractive way to do data analytics. Capitalizing on this trend, startups like Mode Analytics, Periscope Data and open source tools like Redash became more popular. For analysts which are proficient with SQL, they can now utilize the power of their brand new cloud-based data warehouses to produce beautiful charts and dashboards without the need to learn any proprietary language or tool. Furthermore, SQL code is just text and thus can be stored in a version control system, making it trivial to manage.
The problems with SQL
However, using SQL for data analytics is not all sunshine and roses.
Any tool that relies heavily on SQL is off-limits to business users who want more than viewing static charts and dashboards but don't know the language. It forces business users to fall back to old-school spreadsheets, where they export raw data to Excel and perform manual calculations on their own, causing problems around accuracy and data consistency down the line.
SQL is also too low level, and queries quickly become convoluted when more complex analysis is required. Most SQL queries read just fine when the analysis requires a couple of tables. But when the number of related tables increases, data analysts are forced to keep track of multiple types of joins and choose the right one for the right situation every time they write a query.
This implies that SQL is not reusable, causing similar code with slightly different logic to be repeated all over the place. For example, one cannot easily write a SQL ‘library’ for accounting purposes and distribute it to the rest of your team for reuse whenever accounting-related analysis is required.
Traditional data modeling
The traditional way of providing BI to non-technical users is to give them a drag-and-drop interface ... after an analyst prepares a data set via a data modeling process. The process works by allowing the analyst to set up mappings between business logic and the raw underlying data. By exposing the high level business concepts to end users via the software's interface, it enables them to do data exploration on their own without learning query languages like SQL.
This process started a few decades ago with vendors such as Cognos, SAP BI, and so on. The modern versions of this include vendors like Sisense, Tableau and PowerBI. However, regardless of old or new, these tools suffer from the same few problems.
Legacy tools weren't designed to take advantage of modern data warehouses.
First, data is loaded into each vendor's proprietary data store before becoming useful. This means data is now duplicated and that modern powerful MPP data warehouses becomes nothing more than a naive data store. The reason for this is simply because these tools weren't designed to take advantage of modern data warehouses. They were designed at a time where data warehouses were expensive, and when it was natural for each BI tool to build their own datastore engines.
Second, the data modeling process is mostly GUI-based, meaning it is not easy to reuse and can't leverage powerful version control systems like git to track changes.
The SQL-based data model approach
The advantages of both approaches naturally point us to a new direction: what if we can combine the power of SQL and the ease of use of data modeling? The answer is that we absolutely can!
Looker, which was recently acquired by Google for $2.6 billion, was a pioneer in using this approach. It provided a data modeling language called LookML which serves as an abstraction layer on top of a customer's databases. The software does not load the data into its own data store or use a proprietary query engine. Instead, when a non-technical user uses Looker to explore data, the software translates the modeling input into a SQL query, and then sends this query to the customer's database. This means the user doesn't need to know SQL at all but still can utilize the power of modern MPP data warehouses!
Another advantage of using a text-based modeling language is that now the whole modeling layer can be stored in a powerful version control system, making it trivial to track changes and to revert when there are issues.
The SQL-based end-to-end data pipeline
The SQL-based data model approach is just the tip of the iceberg.
Take ETL, for instance. In order for our business data to be present in a data warehouse and ready to be modeled, one needs to import the data from multiple sources, and transform that data into a format that's suitable for analysis. Traditionally, these tasks belong to a category of tools called ETL tools. The process includes three steps:
- Extract — extract data from sources.
- Transform — transform data to its final, usable format.
- Load — load that transformed data into the data warehouse.
With the advent of powerful MPP data warehouses, more and more data teams are switching to an ELT approach, as opposed to an ETL approach. This process extracts raw data from sources and loads them directly into data warehouses with no transformations involved. Once stored, analysts can then use their favourite tool — SQL — to transform the data to a final format suitable for consumption.
Because data transformations are now written in SQL, it follows naturally that we can apply the same SQL-based data modeling approach to it!
Tools like Holistics take Looker's SQL-based data modeling approach one step further by extending the modeling further into the L (load) and T (transform) layers, covering the entire analytics pipeline from end to end.
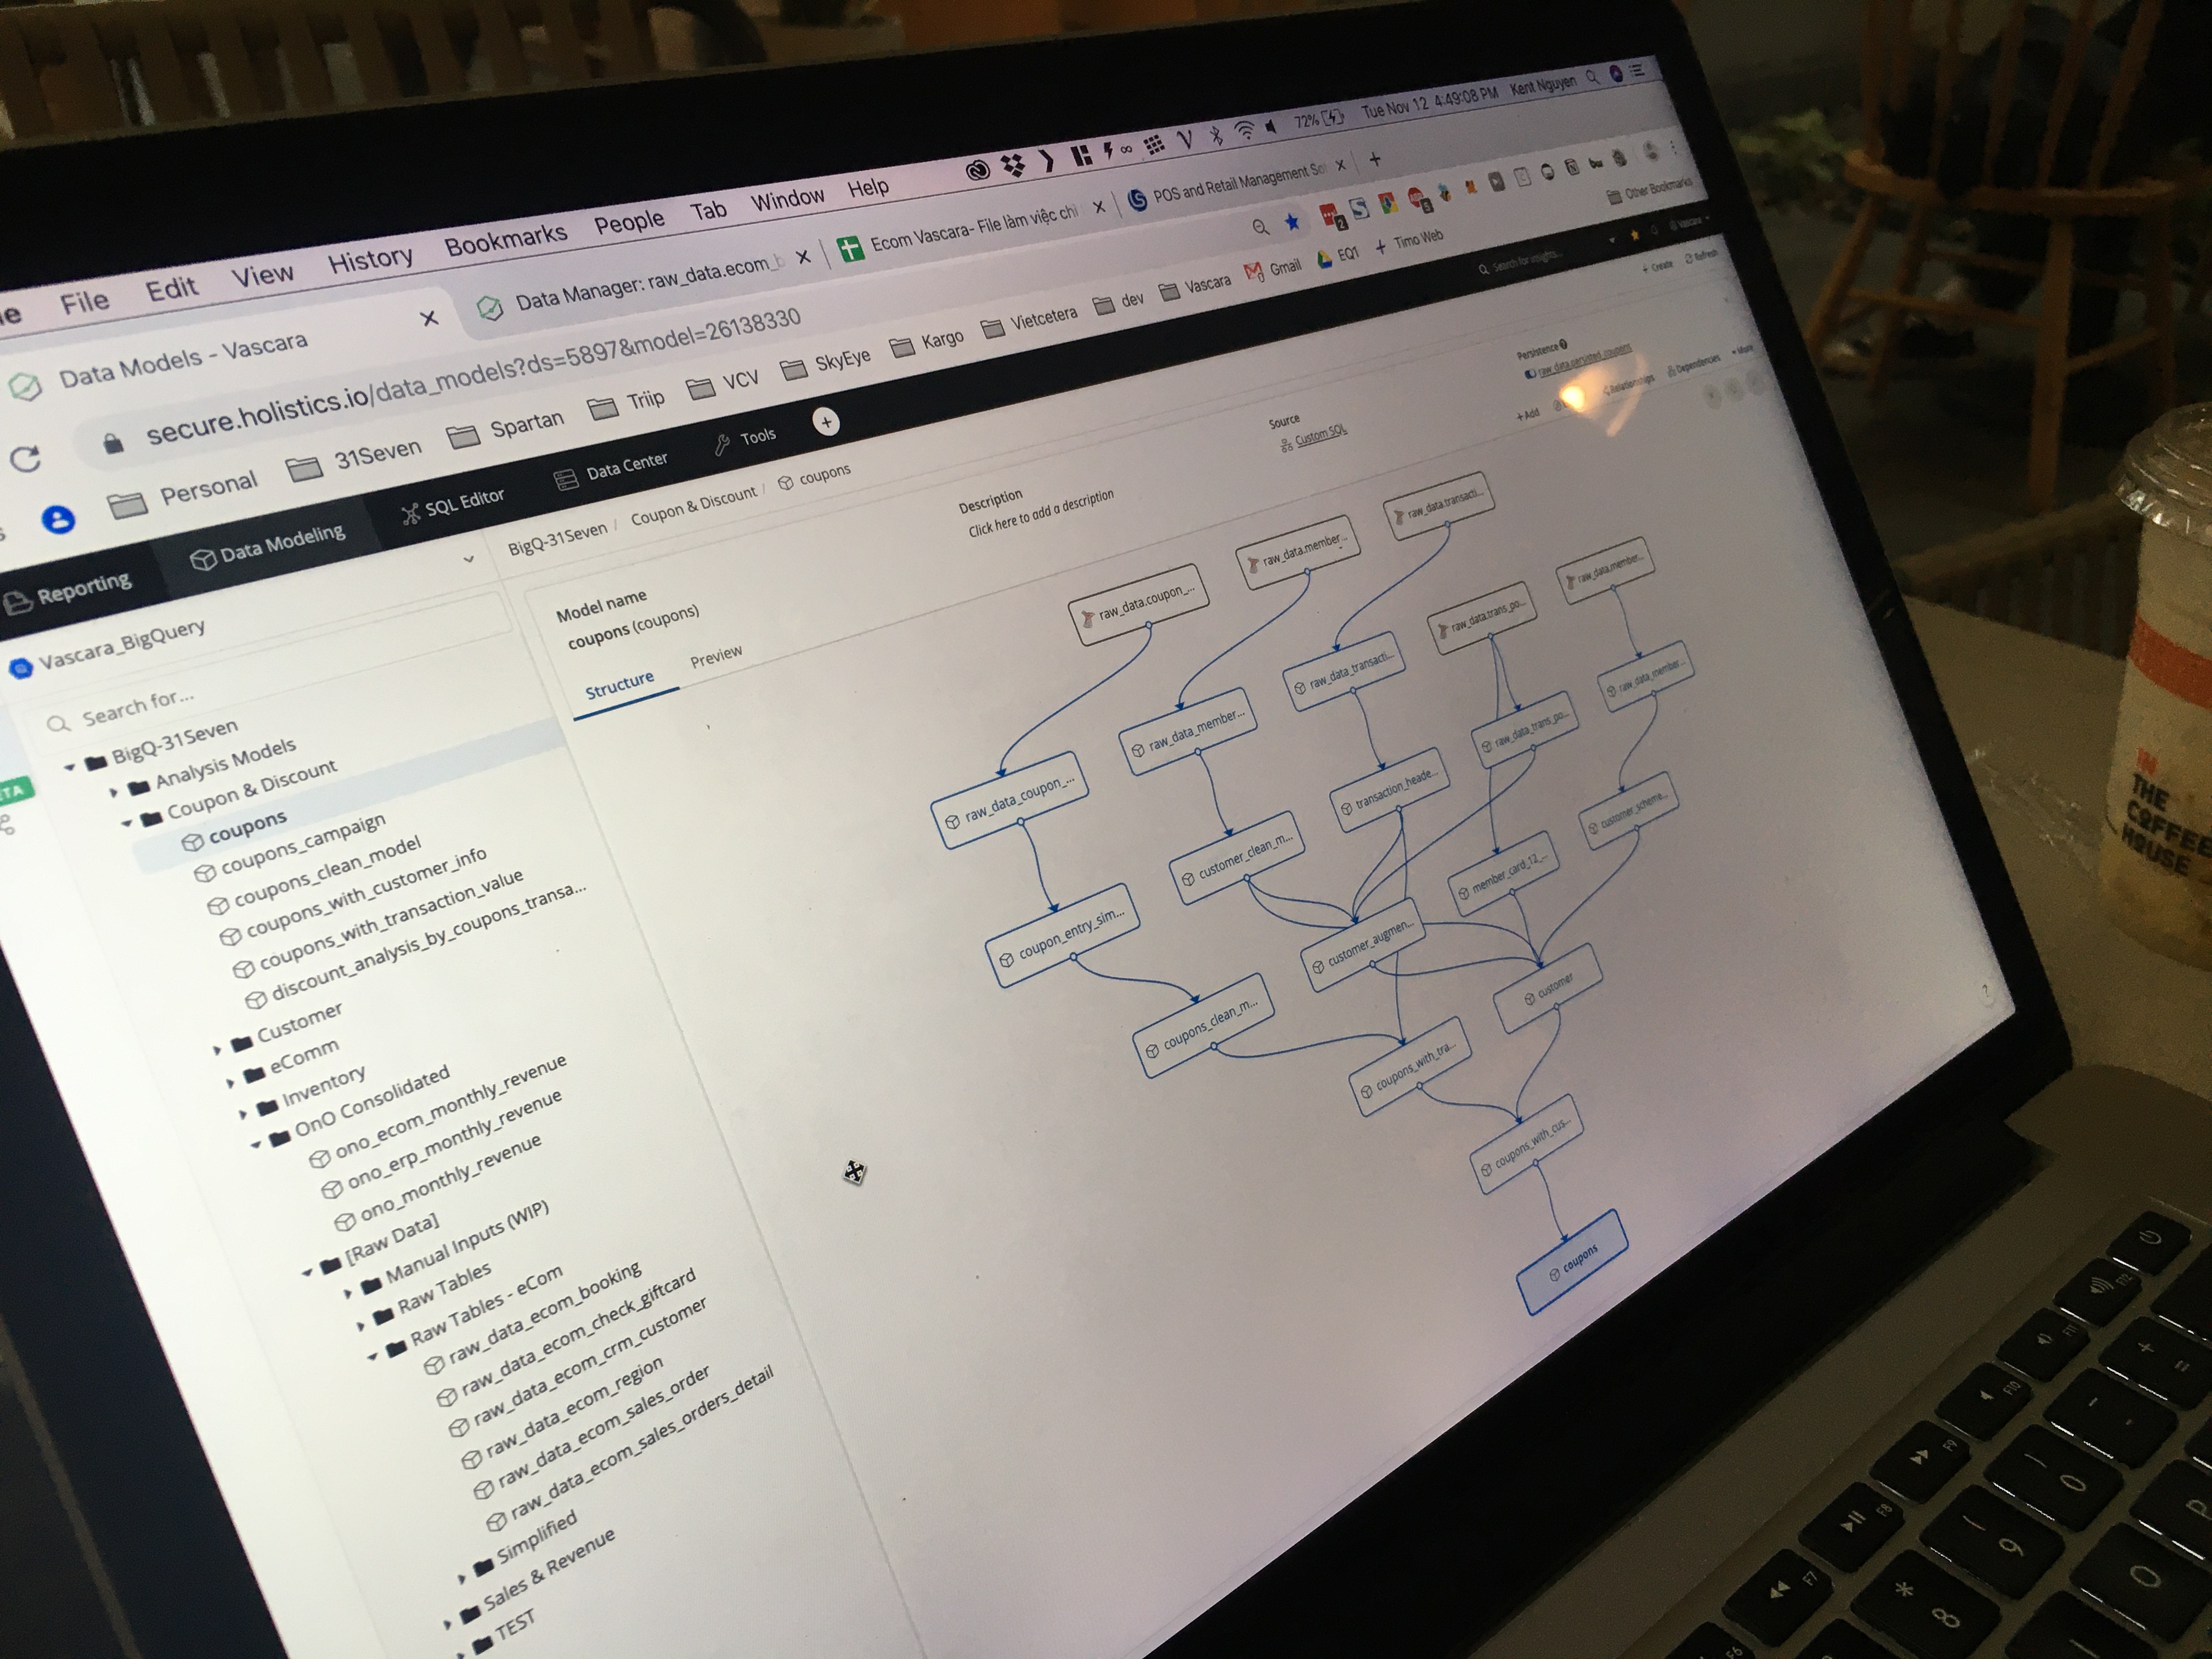
This approach of using a unified SQL-based modeling approach to import, transform and explore data uncover multiple advantages that weren't available before:
- It enables data analysts to own the entire data analysis pipeline from end-to-end , significantly reducing the time-to-insights of each analysis while keeping the requirements the same: that is, to the current industry standard, SQL.
- Data context is preserved. This means that the end results of an analysis can be traced back to where they come from, making it trivial to debug data accuracy issues.
- It breaks the natural silos between data stakeholders such as data engineers, data analysts, data scientists and business users, thus improving the data culture of an organization.
The DataOps-driven movement
When you start to think about data modeling as just another type of logical coding using SQL, the similarities between data analytics and software engineering became more and more apparent. The goal of software engineering is to deliver value by shipping software, while the goal of analytics is to deliver value by shipping explorable datasets and visualizations. Both of these processes include the need to write logical code (programming languages for the former and SQL modeling languages for the latter) then deploy the code to "production".
The software development world has seen multiple decades of process experimentation. One relatively modern movement that has been instrumental in improving software development is the DevOps movement. This movement incorporates automation and continuous delivery in order to help countless organizations speed up software delivery, while increasing reliability and quality of their software.
My thesis is that we can significantly improve the data analytics process if we copy the ideas expressed in DevOps. To name a few examples:
- Analytics as code — If we treat analytics logic as code, we can now put them into our source code control systems, enabling powerful tracking, debugging, and (most importantly!) automation.
- Unit tests for data — Data accuracy and quality can be tremendously improved by incorporating automated testing at every transformation step.
- Centralized data wiki — Building a centralized data wiki allows everyone in an organization to discover and explore data in a single place.
A new analytics paradigm
SQL, data modeling and DevOps are three age-old concepts with little to do with one another. Yet when combined, we have an entirely new paradigm for thinking about analytics, one that's never been seen before in our 60-year old industry.
We call this the DataOps paradigm. It is the guiding paradigm behind Holistics, a unified analytics platform that we've been working on for the past two years. And we're incredibly excited about its future.