









NASDAQ-listed. Autonomous vehicle tech. 1,000 end users.
We evaluated 41 BI tools, including mature companies, startups, open source solutions. During that process, I stumbled upon Holistics, tried it, and liked it a lot.
Holistics helps data teams stand up self-service BI where the AI answers and the point-and-click answers actually match, because both read from metrics you define once.
Analysts prepare curated datasets. Business users self-serve via AI or point-n-click interface.
Define metrics and logic in a centralized layer. Dashboards, AI answers, and explorations pull from the same source of truth.
Define everything as code, from models, metrics to dashboards. Check in with Git version control. Plug directly to your AI agents as context.
Anyone can ask in plain language, from a quick metric to a multi-step cohort breakdown. Answers come from your governed definitions, so the numbers match your dashboards.
Hi — what would you like to explore?
I’ll break down July and August revenue by a few dimensions to see what drove the drop.
Revenue fell across every product category, each by roughly 11% — so no single product line is responsible.
By region it is concentrated: APAC accounts for 82% of the drop — $5.4k of the $6.6k total.
So this isn’t a category problem — it’s an APAC problem. That could mean fewer APAC customers, or the same customers spending less. Worth checking APAC customer activity next.
Since January revenue has grown 105%, averaging 7.1% a month. August broke the run, falling 11% versus July.
📊 Key insightWhy APAC stopped acquiring in August — two things to check:
Revenue dipped in August. Ask why, and AI finds the region behind it, checks what you meant, and writes the finding up on a dashboard — one continuous conversation, no SQL.
AI reads the dashboard and adds a plain-English summary on top, flagging what changed and where to look next.
Ask user: Which metric do you want for “how did we do” across over the last few weeks
Please answer the question below
When a request is unclear, Holistics AI asks what you meant, offering the likely options to pick from or letting you type your own.

Watch it answer live, then trace every number back to the metric it came from.
Business users slice, drill, and combine metrics on datasets your team curates, without SQL, tickets, or numbers that disagree with the dashboard next door.
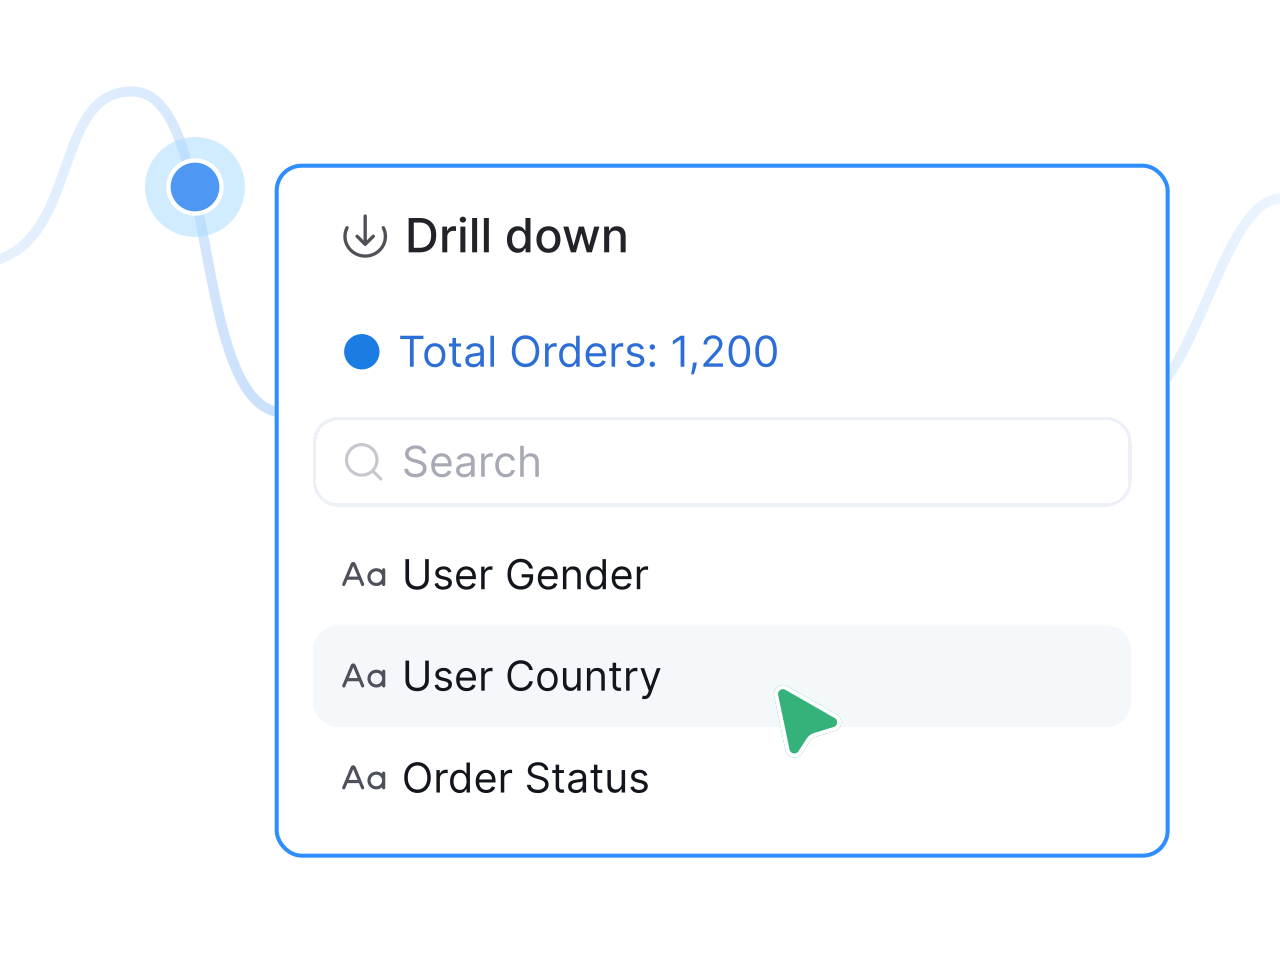
Break down by any dimension, then jump to the detail dashboard.
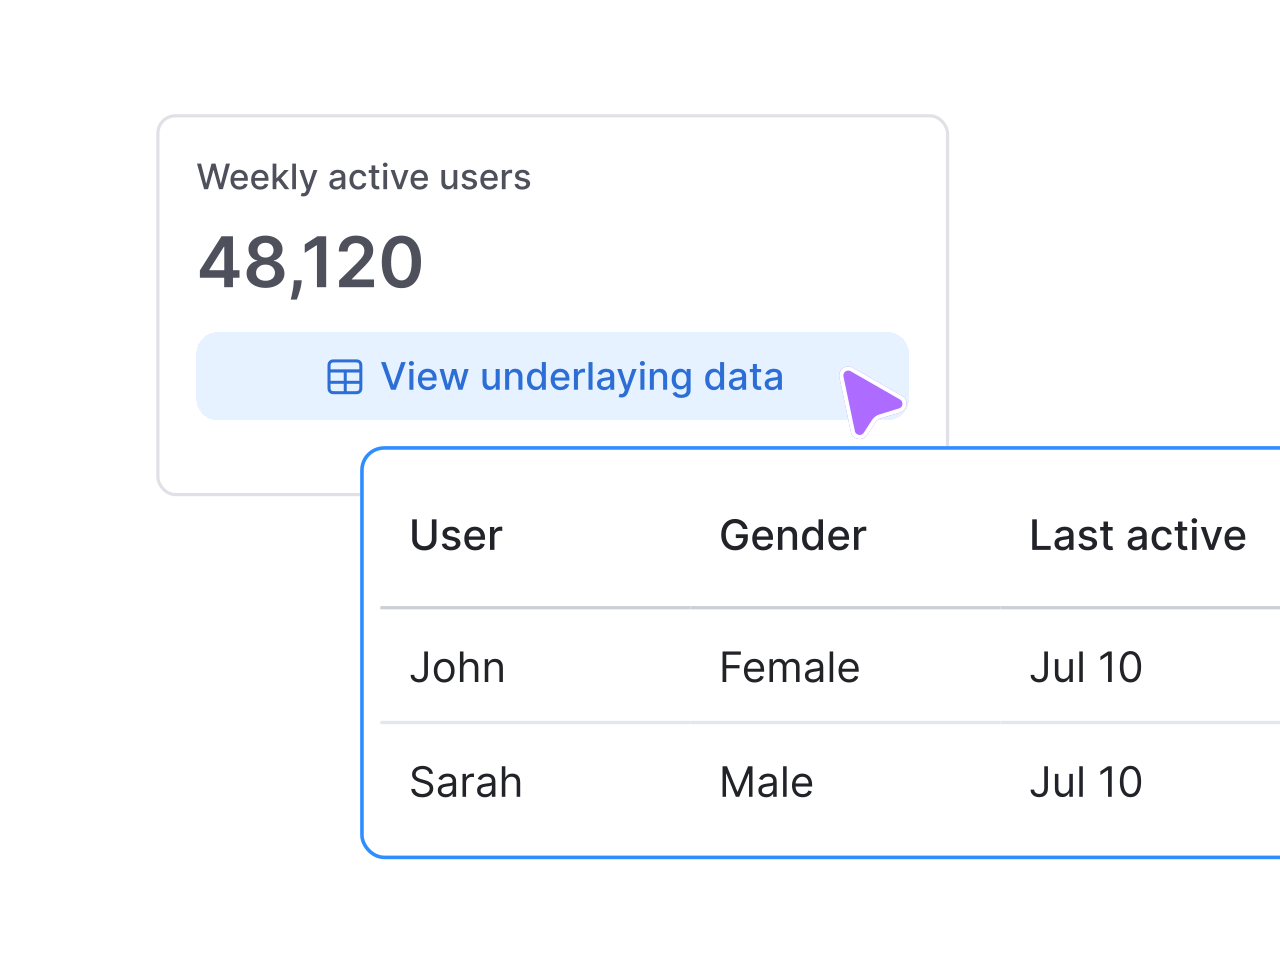
Click into any number to see the exact rows behind it.
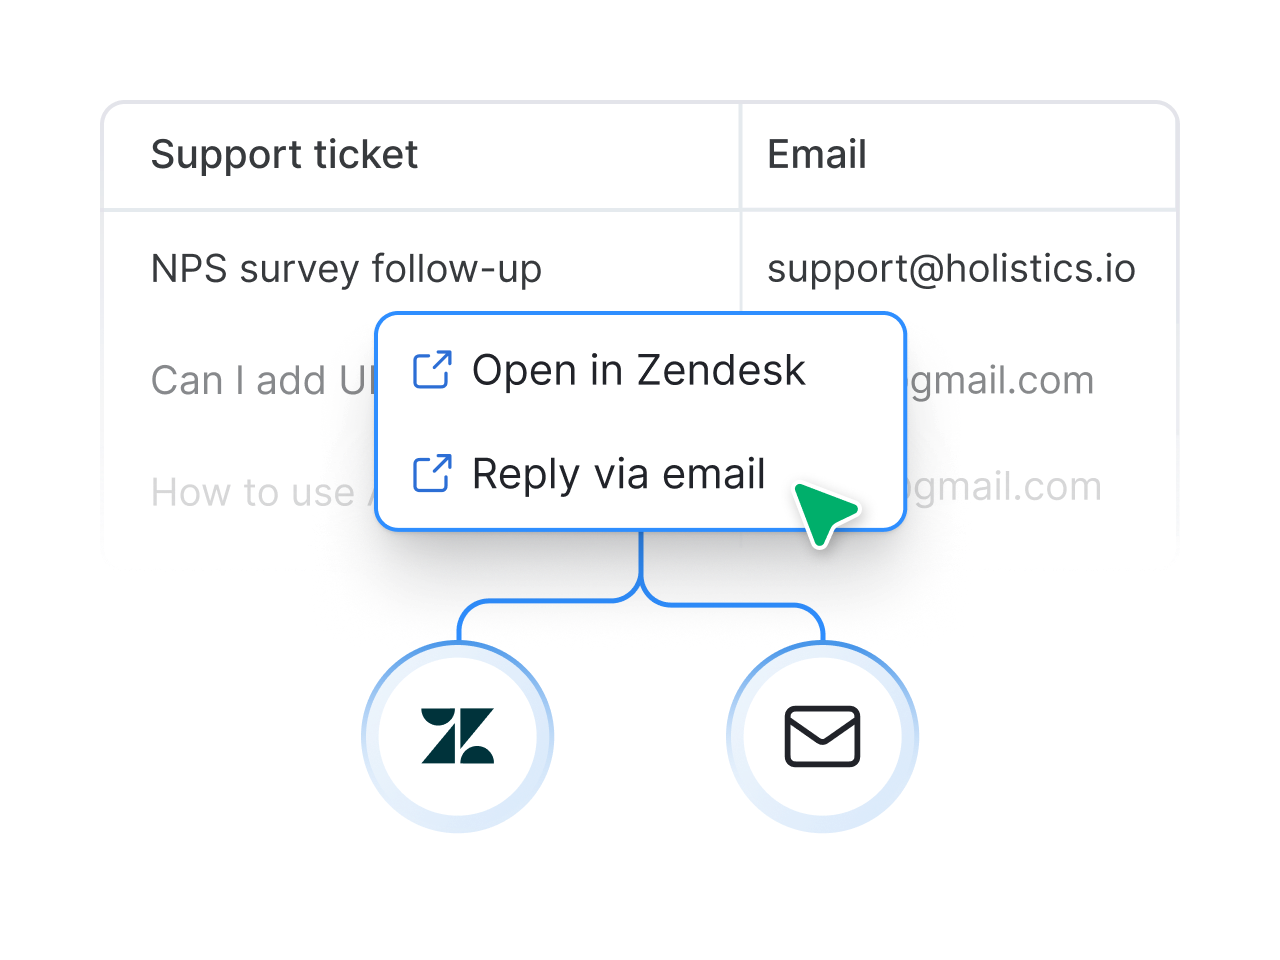
Open a CRM record, send a pre-filled email, or jump to another dashboard, right from your table.

See what business users can answer on their own, and how curated datasets keep them on track.
Your metrics and logic live in one place your team controls, so Holistics AI answers from those definitions instead of guessing at raw tables.
The semantic layer is Holistics' biggest draw because I was able to build reusable models, dimensions, metrics, and then describe them as code.

Model orders {
  table_name: 'ecommerce.orders'

  dimension status     { type: 'text' }
  dimension created_at { type: 'datetime' }

  measure revenue {
    type: 'number'
    definition: @aql sum(order_items.quantity * products.price) ;;
  }
}

// assemble models into a governed dataset
Dataset ecommerce {
  models: [orders, order_items, products, users]
  relationship(order_items.order_id > orders.id)
  relationship(order_items.product_id > products.id)
}
Query it in AQL, where every metric is an object that composes like a function, so you build new metrics on top of existing ones instead of copy-pasting SQL.
I'd score AQL a 9 or 10, up there with the best tools I've used. We can define metrics based on other metrics, stacking them on top of each other, and still retain visibility into the raw data.

metric revenue =
  sum(order_items.quantity * products.price)

metric arpu =
  safe_divide(revenue, count(users.id))   // builds on revenue

metric ltv =
  arpu * avg(users.lifespan_months)       // builds on arpu
Query your metrics from Claude, ChatGPT, Cursor, or your own app over MCP and APIs. Every tool reads the same definitions, so the answers agree.
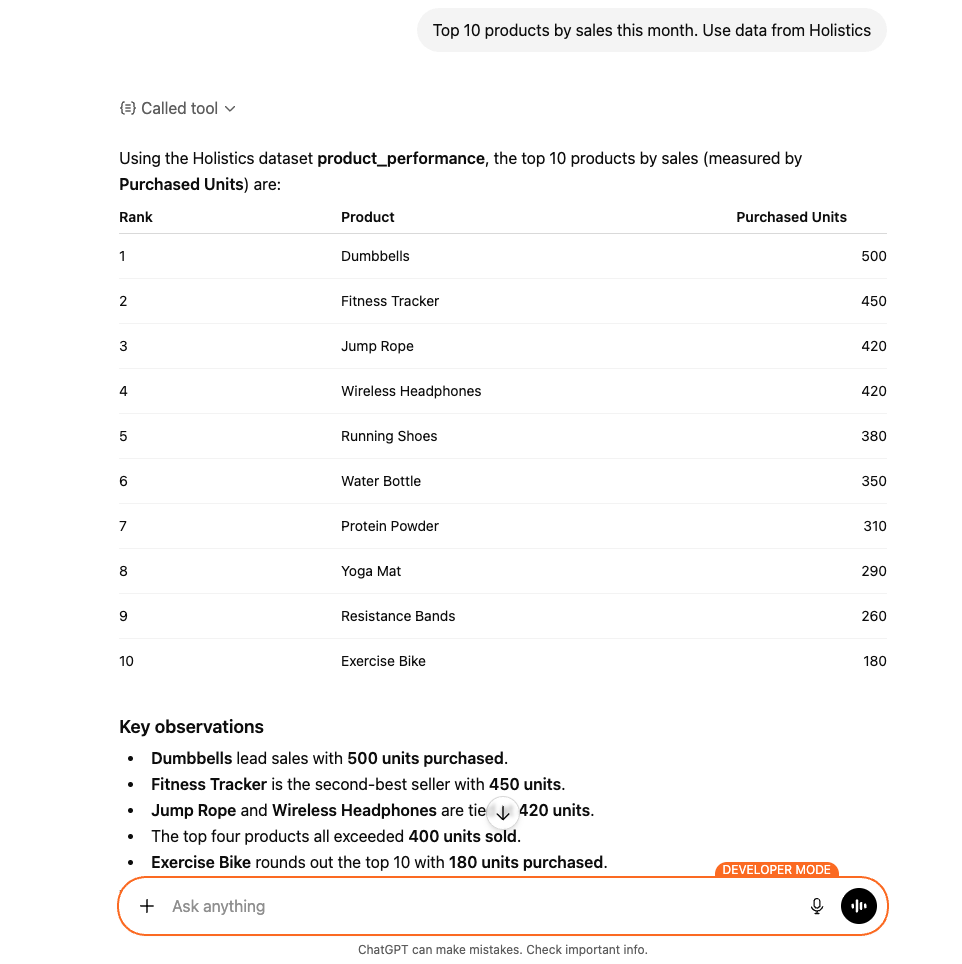
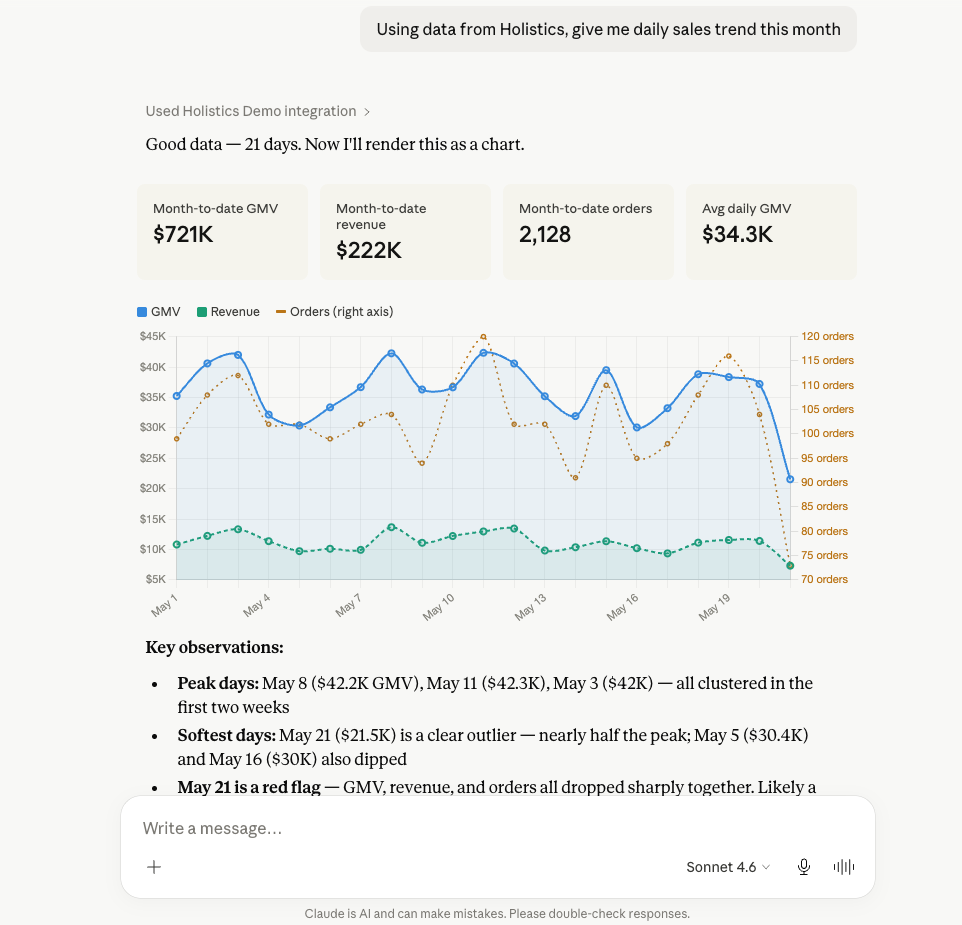
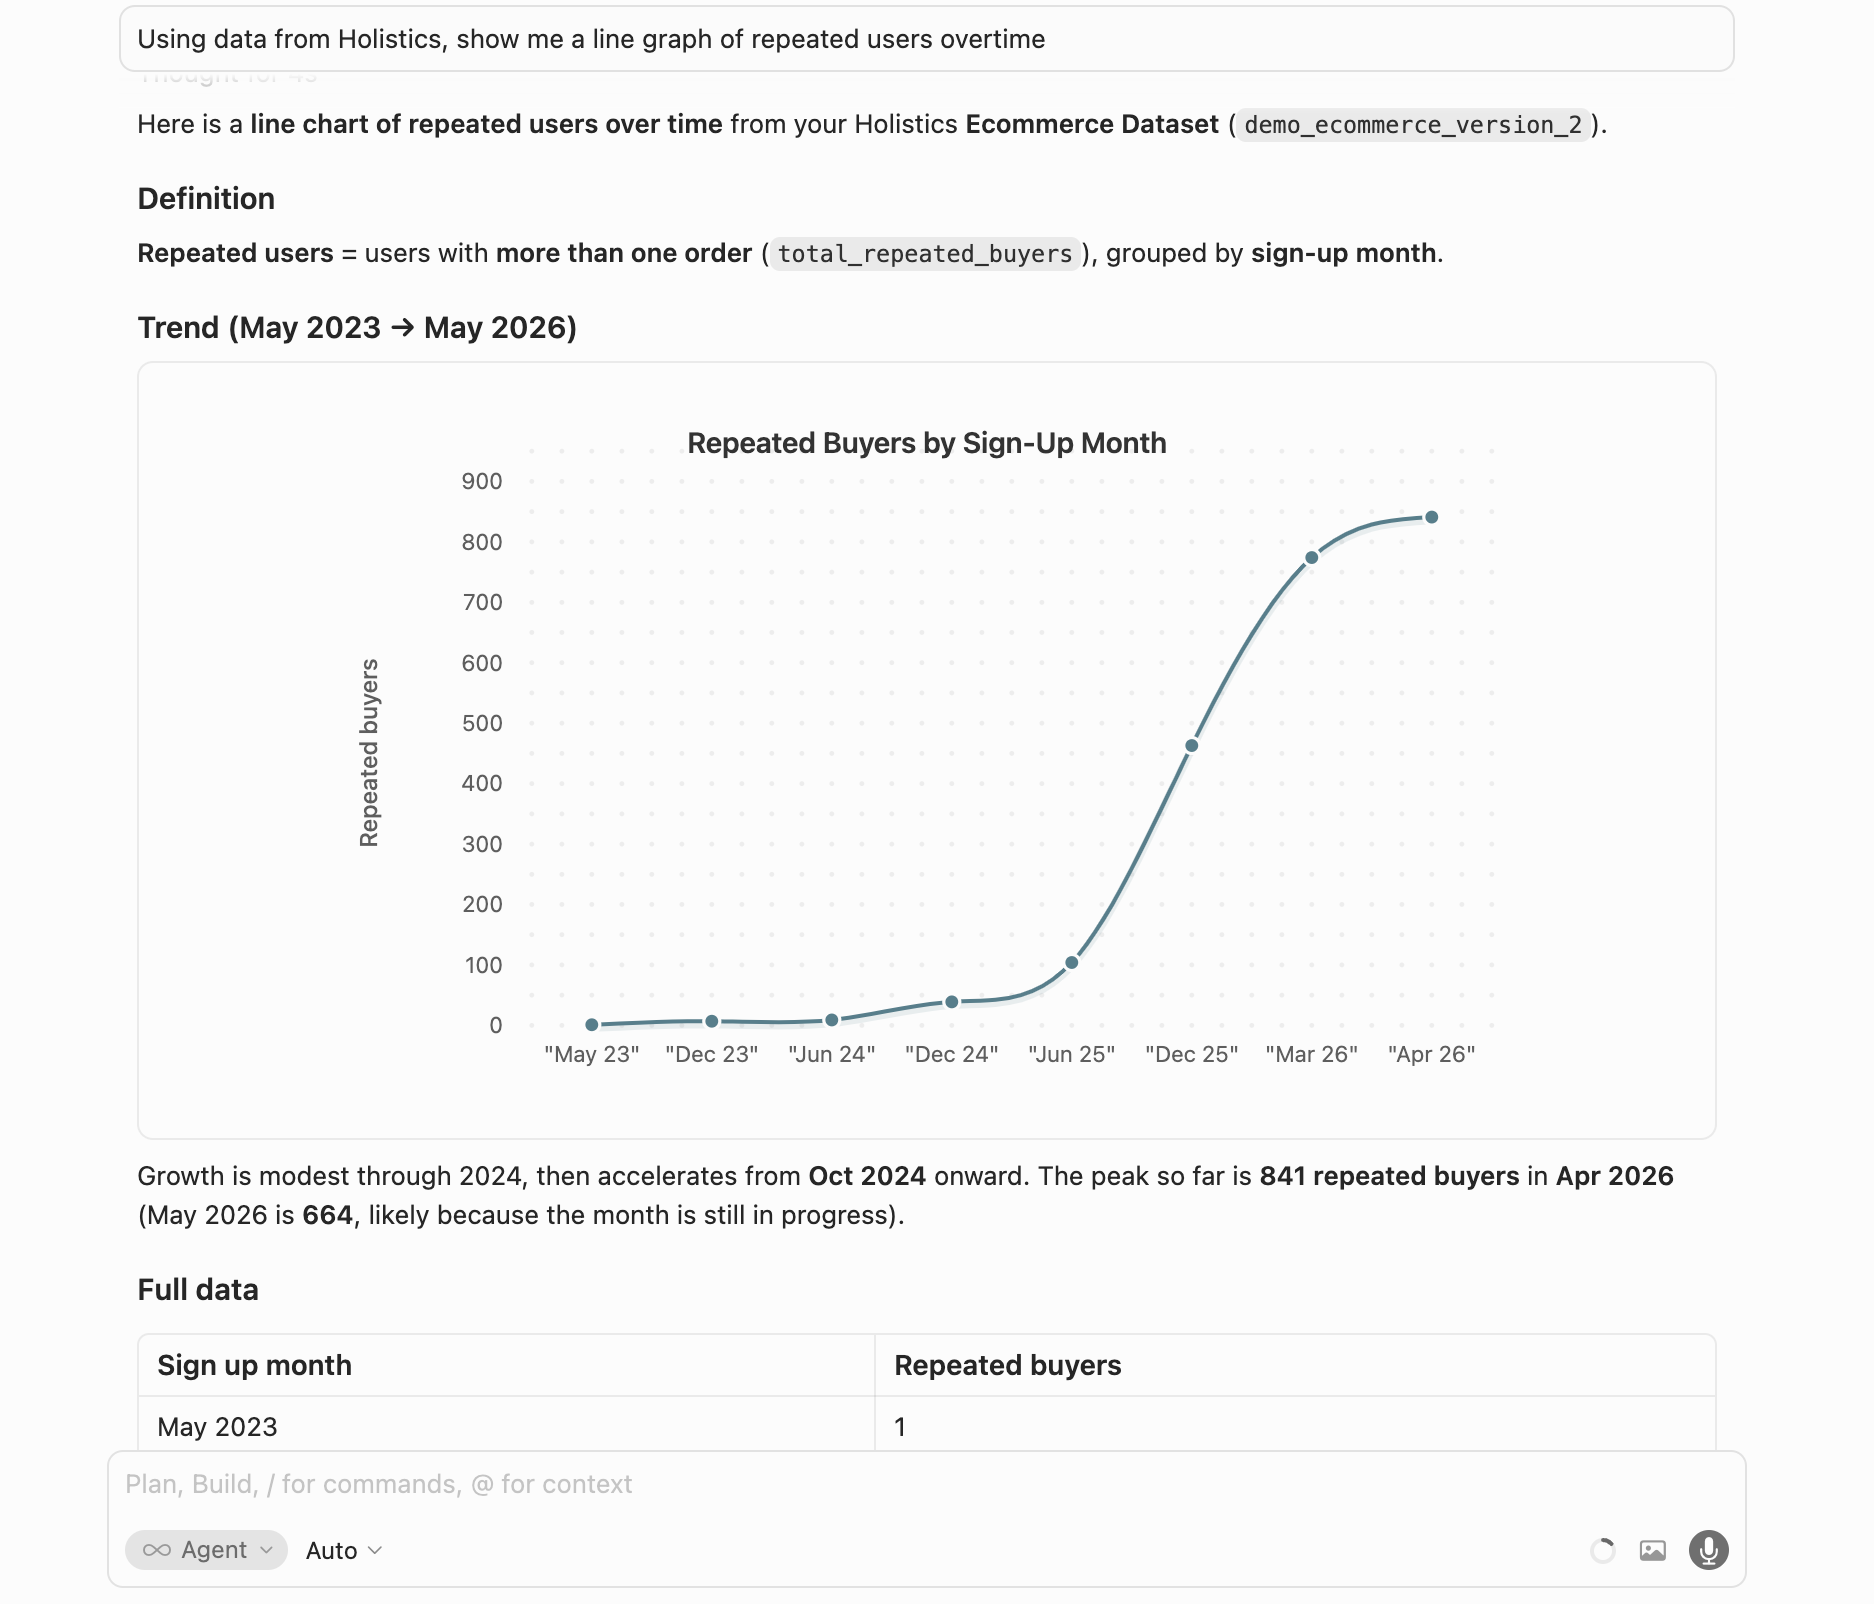
See how defining a metric once keeps every dashboard, query, and AI answer in sync.
Define models, metrics, and dashboards as code in Git. Branch a change, open a pull request, and roll it back the moment something looks wrong.
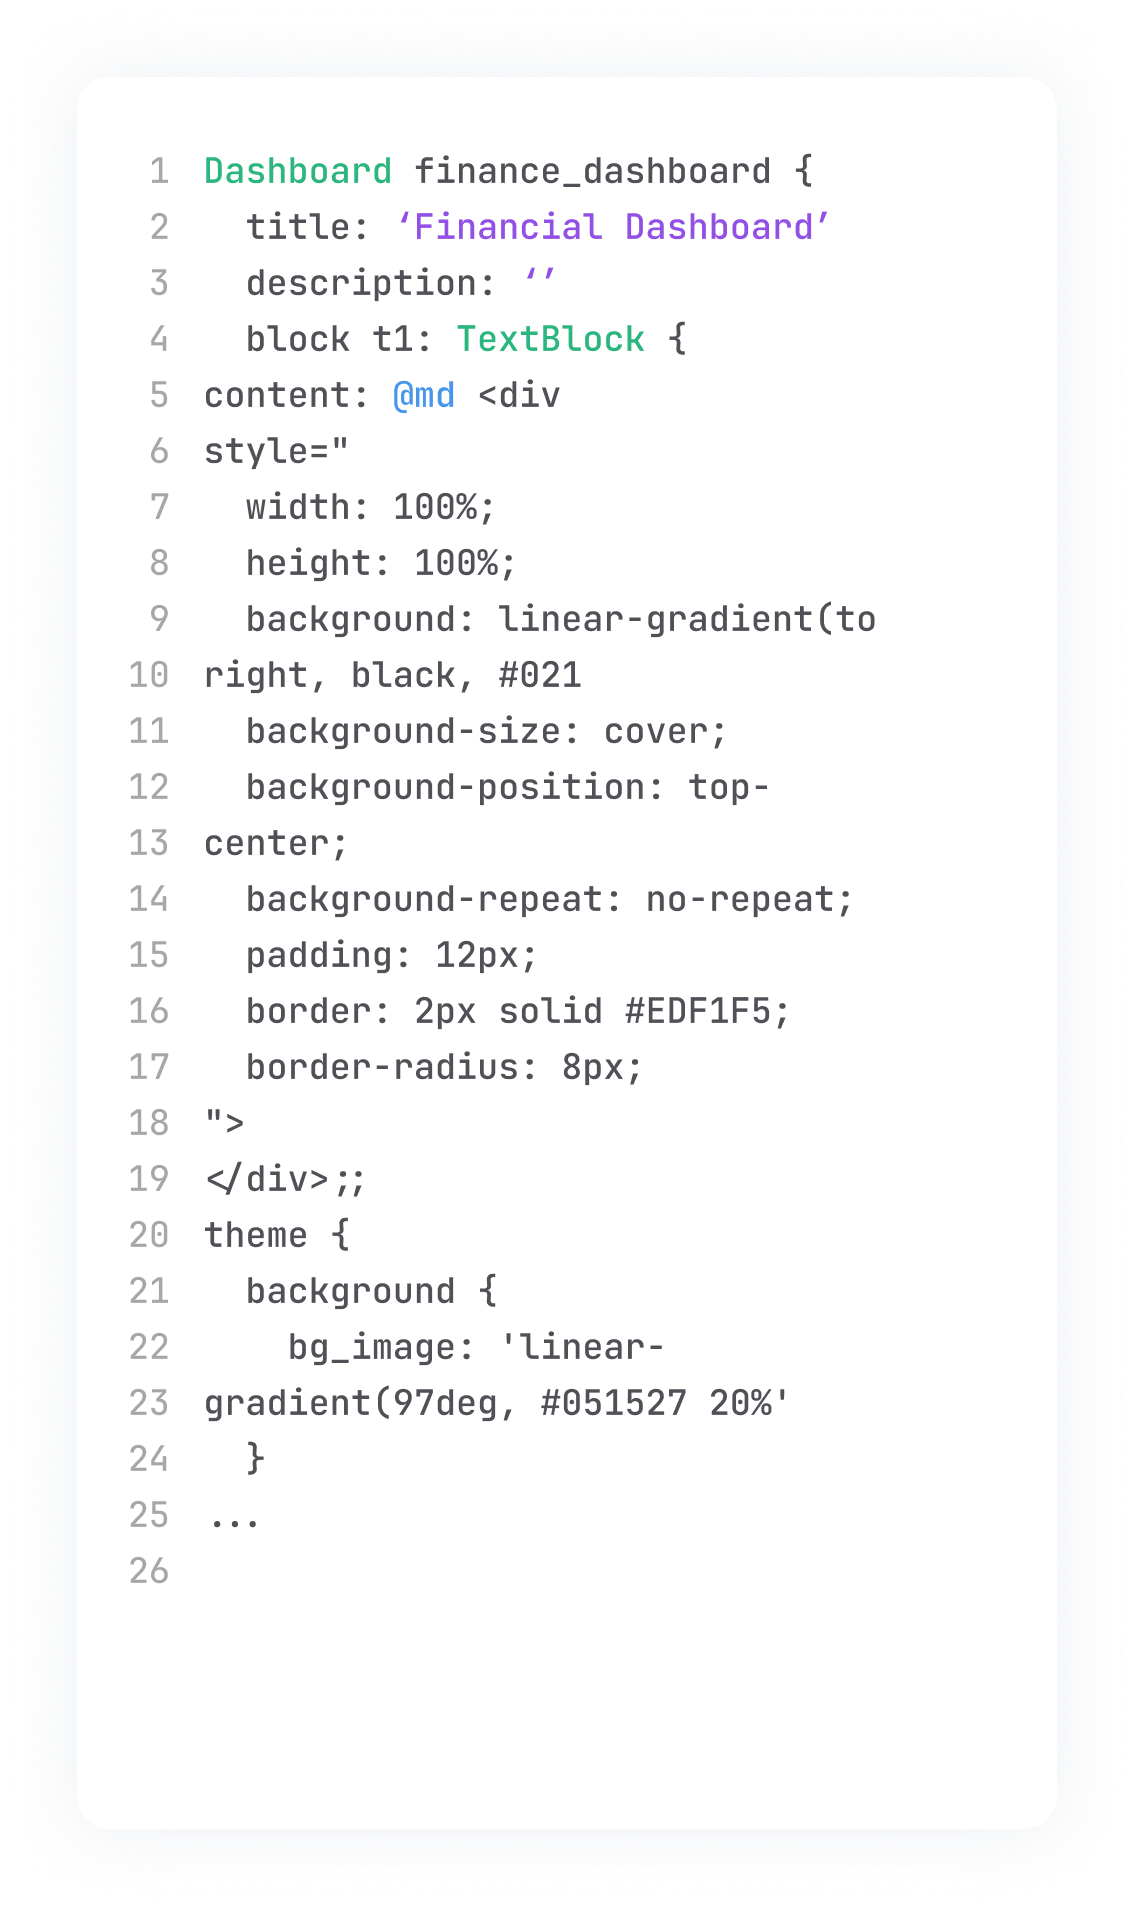
Define everything in AML, from models to dashboards, so your analytics is text you can read, review, and reuse.
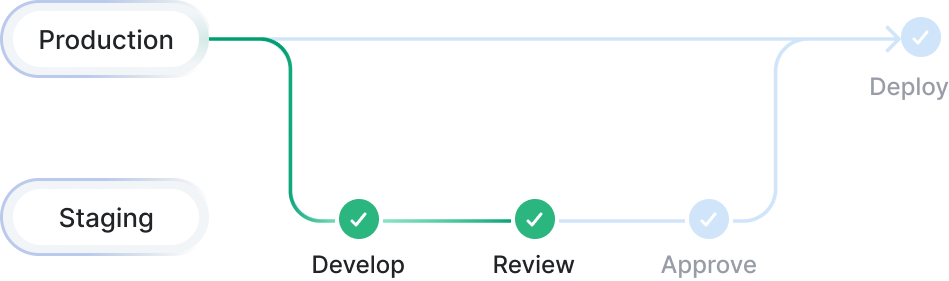
Full history on every change, with one-operation rollback when something breaks.
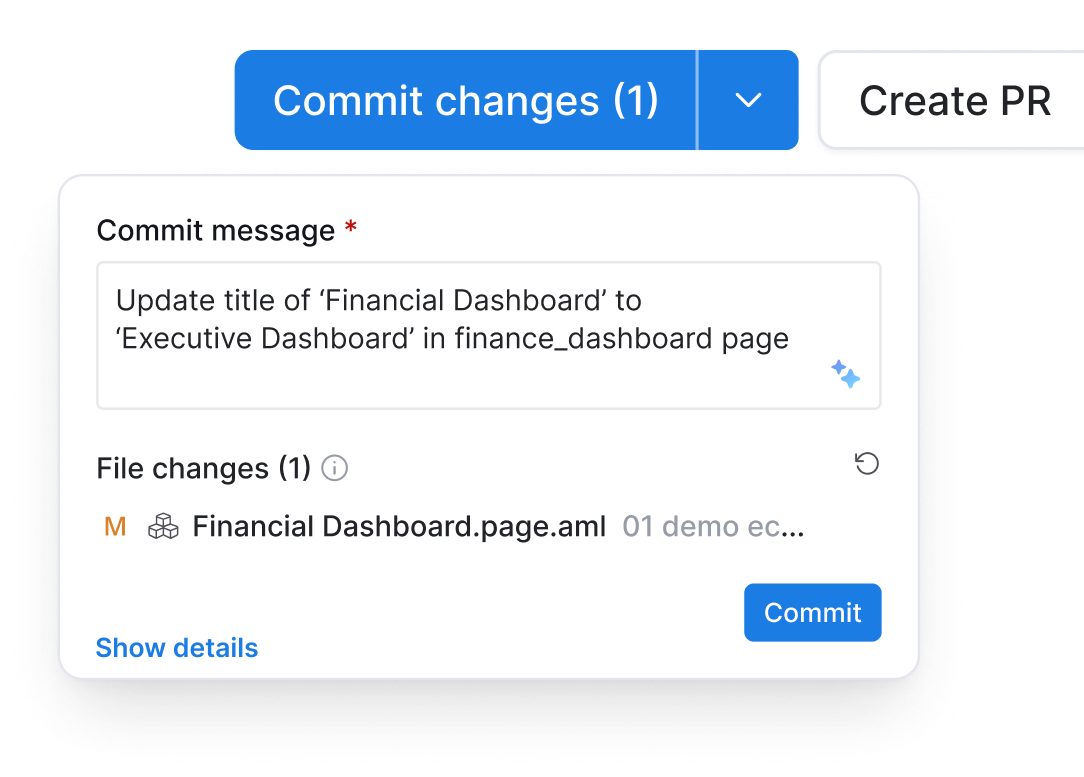
Real pull-request review on your business logic before it hits production.
Point Claude Code, Codex, or Cursor at your BI codebase.
Or use our in-browser Development Copilot to build models, metrics, and dashboards.
Live preview
Your dashboard will build here
Revenue dashboard
LiveSee a change go from a branch to a pull request to production, all in version control.
Ship white-labeled dashboards and self-service inside your own product, with per-tenant security enforced by the same layer that powers the rest of your analytics.
White-label dashboards and portals that match your product's look and feel, from a single dashboard to a full self-serve mini-BI.
Because of the quality of your platform, it really feels native for our end users, and so they're very happy about it.

Let your customers ask questions in plain language inside your product, answered from the same metrics that power their dashboards.
See how product teams ship white-labeled dashboards and AI inside their own apps.
Every modern BI tool claims a semantic layer. But ask for a running total by segment, a rolling window by region, or a custom retention cohort, and most can’t express it. The moment you do, you’ve left the semantic layer behind back to table calculations, raw SQL, or “ask an analyst.”
And once you’re outside the semantic layer, governance breaks down and self-serve stops scaling.
Composable metrics
Running totals, rolling windows, nested aggregations, period-over-period comparisons
Falls back to table calculations or raw SQL for complex logic
First-class composable metric definitions inside the semantic layer
Business-centric self-service
Cohorts, funnels, retention curves, segmented breakdowns: analysis business users actually need
Advanced analysis requires analyst to build custom reports, or users bypass governance with raw SQL
1-click advanced analysis without leaving the semantic layer. Users stay within governed definitions.
AI that reasons over semantics
Ask a follow-up question and get an answer that builds on the last one, not a fresh SQL query from scratch
Generates raw SQL. Context lost between questions; AI ignores governed definitions.
Reasons over semantic layer in AQL. Multi-turn context preserved; AI respects metric governance.
Git version control
Who changed what, when, why, for every metric, model, and dashboard definition
UI-configured, no audit trail, definitions drift
Code-defined, Git-backed, code-reviewed. Full change history.
Programmable semantic layer
Models, metrics, and dashboards defined as code: readable by humans, AI, and automation
Duplicated logic across dashboards, reports, exports
Define once, reuse everywhere: AI, dashboards, embedded analytics
NASDAQ-listed. Autonomous vehicle tech. 1,000 end users.
We evaluated 41 BI tools, including mature companies, startups, open source solutions. During that process, I stumbled upon Holistics, tried it, and liked it a lot.

Replaced Tableau and Looker. Data team of 3.
Working with Holistics is completely different from companies like Tableau or Looker. Your team moves fast, and I can see ideas turn into features in real time.
.svg)
Migrated from Looker Studio. Marketing AI platform.
Holistics has democratized the ability to get the right data at any given point and then visualize it in a very simple way.
White-glove support from people who actually build the product.
From your first dashboard to scaling, the Holistics team is here to make you successful.
The support has been great. We get updates, fixes, or even just helpful advice when it's not a technical issue. That level of responsiveness was a huge factor in our decision.
Even before we were paying customers, we felt important. That engagement, that sense that we matter, is one of the biggest reasons we chose Holistics.

Hear from data-driven teams who've transformed their workflows with Holistics.

We evaluated BI tools across the market. I went through an evaluation process, reviewing around 41 options, including mature companies, startups, open source solutions. During that process, I stumbled upon Holistics, tried it, and liked it.
Staff Data Scientist
Aurora (NASDAQ-listed)
Excellent BI tool for customers looking for a Looker alternative. Coming from a Looker background, I was very familiar with its concepts of analytics-as-code, and we have achieved everything we needed for reporting.
Alex H
Head of Data, Pinter

The metrics dataset component is really critical for companies that don't have a real data team to build everything all the time. In the work I do, I recommend Holistics to people all the time.
Pedram Navid
Consultant/Founder, West Marine Data

The ability for everyone to explore: Massive win. The one feedback we've had over and over again from the whole company is “Man, how did you guys go through your process? Because you choose such a great tool.”
Guido Stark
Head of Data, Optimal Workshop
Holistics is the next big BI Tool. It took me 2 hours to build the same report in Holistics that I took 16 hours to build in Tableau.
Stephen Motherwell
Chief of Product, Ordo

Holistics became an excellent choice to get us going in BI without the typical huge annual expense. We have built visualizations in Holistics that took it way beyond the 'out-of-the-box' tools.
Seth L
Chief of Product, Oxbridge Health

As an analytics engineer, I was looking for a tool that allowed me a lot of data modeling flexibility and reusability. With Analytics as code, Holistics does a great job of being able to define data models and relationships using code.
Sterling P
Chief of Product, Mainspring Energy
They are great. They are continuously improving the platform and releasing new features, so we know that what we don't have right now will be at some point :)
Marta Garrido
Head of Data, MyRealFood

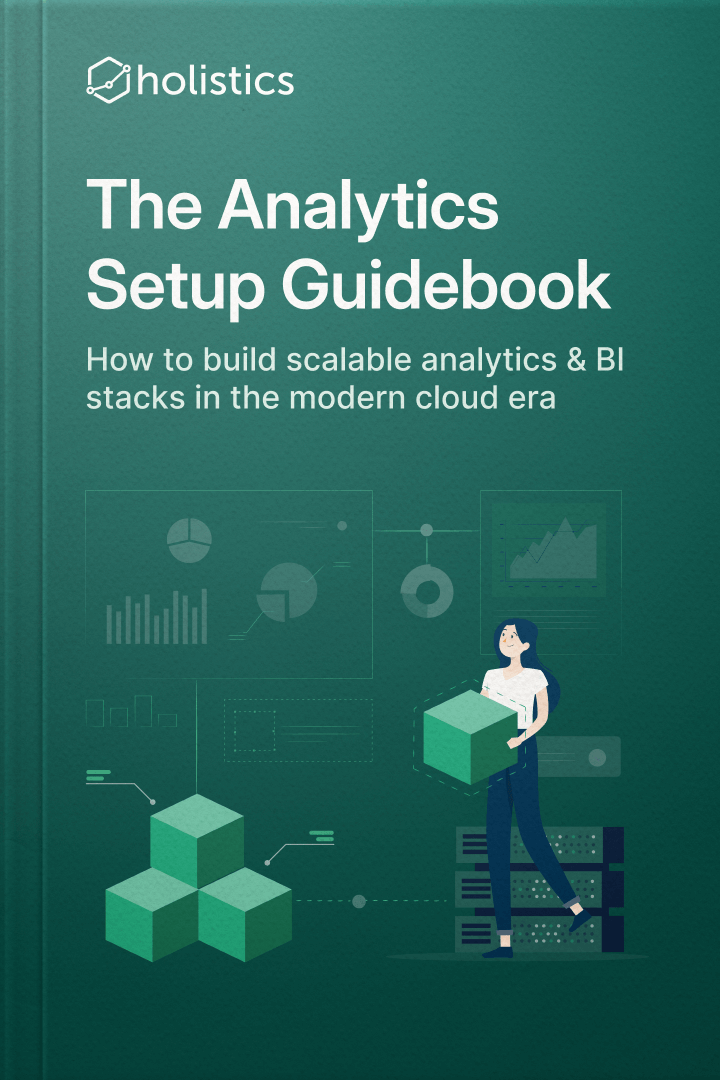
Want a quick primer on the practice of modern data analytics? We wrote The Analytics Setup Guidebook to help you with that.
Get a soup-to-nuts overview of the broader data landscape in less than 200 pages. (Plus we drew all the pictures ourselves!)
I'm shocked to be telling you this next sentence: I read a free ebook from a company and actually loved it.

Mark MacArdle
Data Engineer
Holistics has received positive reviews for its innovative data analytics approach, enabling businesses to make informed, data-driven decisions easily.



![Forbes [translated from Vietnamese]](https://cdn.holistics.io/logos/forbes.png)

Holistics partners with top industry leaders to provide innovative and advanced data analytics solutions that drive success and growth.