Why Google Analytics sucks and what you can do about it
Google Analytics is an incredible tool to have in your toolbox. But it only offers aggregated data, which limits your ability to track visitor behavior. In this post, we discuss a simple, affordable alternative to GA that we've implemented at Holistics.

Google Analytics is an incredibly useful tool to have in your toolbox. It is free for individuals and small businesses, it is fast to set up, it has a (relatively) user-friendly UI, and it provides cool reports about your website's performance out of the box: traffic count, user behavior flow, funnel visualization, and more.
All is well with the world until you want to ask more difficult questions about your traffic and your customer’s journeys. More often than not, this is when you realize you have to pay Google $150k a year to have access to the raw data for your own website.
At Holistics, we hit that roadblock six months ago. We also discovered other serious compromises with Google Analytics that did not sit well with an analytics company like ours.
It was time for us to look for a Google Analytics alternative.
What we used Google Analytics for
Some of the more common questions that came up in our analytics meetings were things like:
- How many people visit our marketing website every month?
- Do they bounce off the site, or do they have some kind of interaction?
- After they visit a site, where do they go next? What do they do on the site? Where do they click?
Or trickier questions:
- How many people are interested in our product after reading this piece of content?
- How many people actually contacted us because of that?
- How many demo calls were generated from the marketing site, and how many are from sales team's outbound efforts?
All of these questions could be answered to some extent using Google Analytics. However, the deeper we wanted to dig into our traffic data, the more problems we encountered.
Our issues with Google Analytics
We had no ownership of the data
You might wonder why we say this. After all, you can still download Google Analytics using their API, right? As it turns out, this isn't true. What you get from GA's API is just aggregated data.
Not owning every hit-level data points of your traffic comes with lots of restrictions in the long run (which we will get into later). More importantly, however, it didn't feel right to pay Google thousands of dollars just to get back the data generated on our own website.
The default Google Analytics API has too many restrictions
If the number of sessions you are querying is over a threshold (500k for the free tier, 100M for GA 360), your data will be sampled, and that reduces the accuracy of your numbers. Also, every query via GA's API is limited to 7 dimensions and 10 metrics at a time.
Google Analytics's aggregated data is too hard to use
From Google Analytics's API, what you can get is not the hit-level raw data of your traffic. Every query via the API is a combination of dimensions and metrics, and the lowest level you can aggregate data to is one minute.
Problems arise when you want to pull this data out and use it on your own internal reporting system. With some metrics that involve COUNT DISTINCT logic (like Users), whenever you want to change the aggregation logic, you need to change the source query to remove/add dimensions so Users are counted correctly.
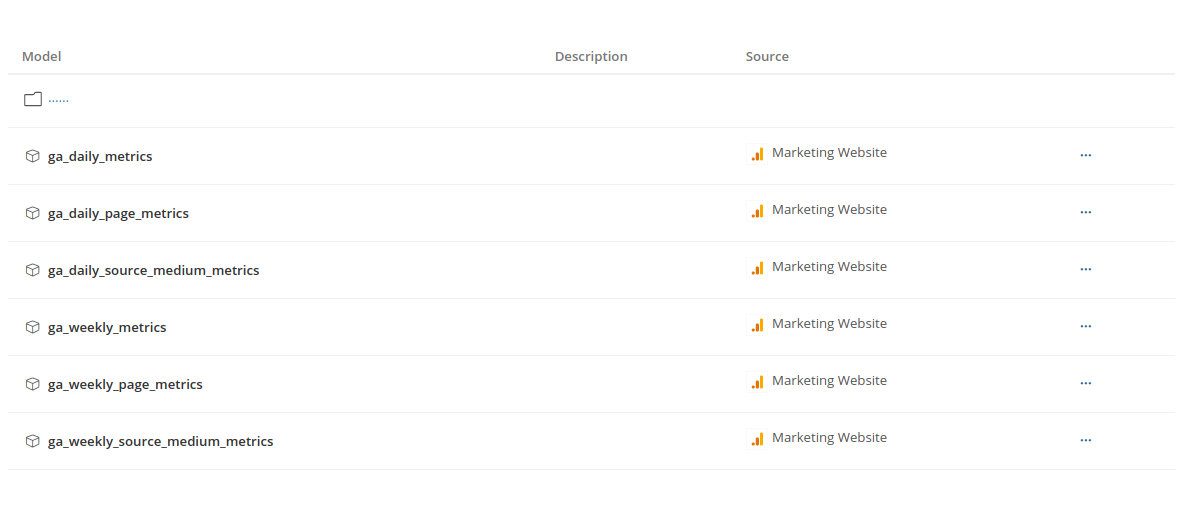
With GA, you simply cannot download a dataset aggregated to the lowest level and then sum up the metrics as you wish — you will risk double-counting your numbers. There is also the problem of dimension-measure incompatibility that you have to pay attention to.
We cannot define our own calculation logic
Each business domain may have its own industry-specific metric definitions, but once you use GA, you're stuck with Google's metric definitions. What if you want to define your own bounced session? What if you want a more accurate count of the time users spend on your page?
For instance, GA's "average time on page" metric does not take into account the time users spend on the very last page of the session. This means the actual time visitors spend on your content may be way higher than what GA reports to you.
We cannot retroactively edit goals and funnels
In Google Analytics, once you set up a funnel to capture certain customer behaviors, you will find that customers that deviate even a little from this set of pre-defined behaviors are indiscriminately left out of the funnel. There is no way for you to retroactively add a visitor to a different funnel when your logic changes.
This is fine if your business is established, with a clearly defined set of procedures. But if you're working in a smaller, more agile company, it's likely that you'll need to tweak your funnels as things change.
The same thing applies to goals in GA. If you edit your goal, the change is not propagated back in time, but is only effective from that time onward. This may confuse your report users if you do not document this change well.
So, with these limitations of GA in mind, we went looking for a better alternative. We seem to have found a great combination that works for us: that is, we use Snowplow to collect event data, and then we model the data ourselves.
Snowplow: A great Google Analytics alternative
We know that ownership of our own data is incredibly important if we want to understand our visitors better, but again ...
Google Analytics 360 will cost you $150,000 a year
That's simply something we cannot afford. And why pay that much when there are great open-source alternatives out there? So, after a bit of research, we decided to go with Snowplow.
Snowplow is an open-source data collection solution that can collect your web analytic tags and pipe it to your storage of choice (AWS, BigQuery, Snowflake) in real-time. With it, you have way more control in designing your data schema and event structure.
We still deploy new tags and triggers via Google Tag Manager, use Google Analytics for simple ad-hoc questions, and explore Snowplow data when we want a deeper understanding of our visitor's journey.
Of course, the initial setup is harder, and we have to spend more effort modeling our data, but in the end we are quite happy with what we achieved using this combination, because ...
We really own our data
Having access to hit-level traffic data solves multiple problems at the same time. We are no longer hampered by Google Analytics' API — no data sampling, no pre-aggregation, and no dimensions and metrics limits.
It also means we do not have to accept GA's definitions unconditionally, and whatever update we make to the measurements today can be propagated back to the past.
We can aggregate data however we want
From hit-level data, we can aggregate it however we want, which we could not do with the data we got from GA's API.
Producing metrics and dimensions is just a matter of writing the right query, so of course, there is no restriction on the number of fields you can pull out, or the issue of incompatible dimensions & metrics. Everything depends on the logic of your query.
We can define our own metrics
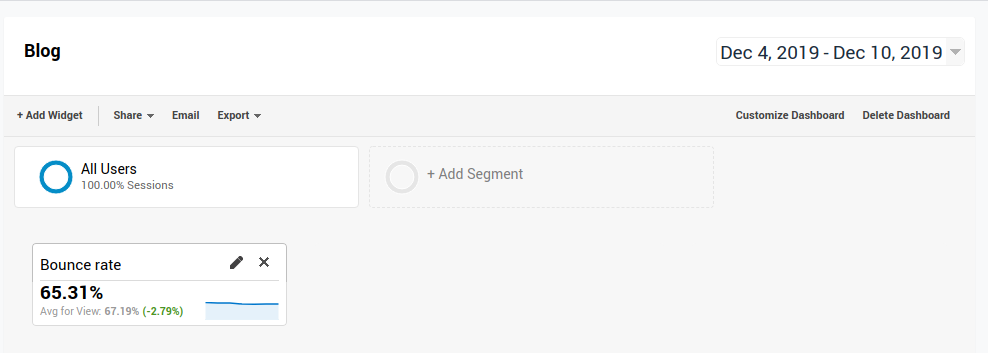
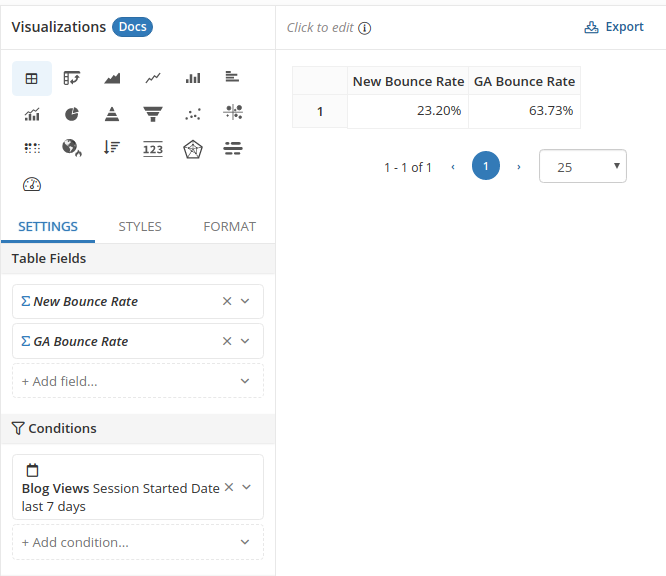
For example, GA defines a "bounce session" as a single-page session (without any interaction hit) on your site. With raw traffic data, you can easily replicate this logic, or apply a stricter definition like "a bounce session is a single-page session where visitors do not scroll down to read your content, or stay on your page for under 10 seconds."
We can retroactively edit our metrics, goals and funnels
As shared above, with raw data you can define metrics, goals and funnels yourself. It means that the changes applied to the calculation logic apply to your whole timeline (as long as the same required data points are available).
If initially you defined a funnel as Page A → Page B → Page C and found that the conversion rate is too low and not realistic, you may want to redefine your funnel as Page A → Page C. In this case your GA report is expected to have a weird sudden increase in the conversion rate time series, but with a report created from raw data, the whole time series will be updated.
Things to consider when moving to Snowplow

As Uncle Ben once said, "With great power comes great responsibility". The amount of data you can get from Snowplow can be overwhelming if you are over-eager and track everything, so lots of thought and consideration should be put in the event-designing step.
Besides, not all data will be in the immediate useful state for your data consumers. The default Snowplow table schema already has more than 100 fields, not including your custom event fields.
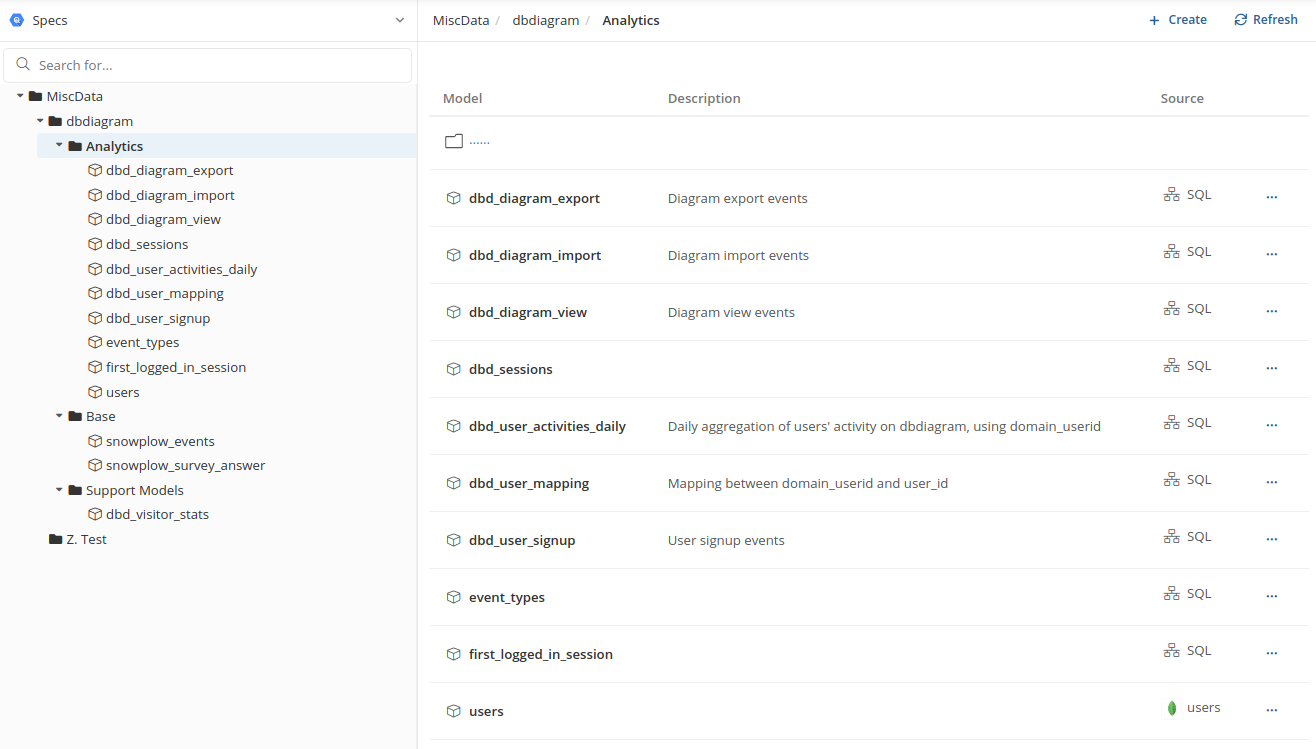
In this GA migration project, most of our effort was spent on modeling the data to reduce the large "fat table" to a dozen of the most relevant fields and metrics. These models and data sets are the "custom portals" for our internal teams to easily access and dig out insights from event data.
An example of a Session model:
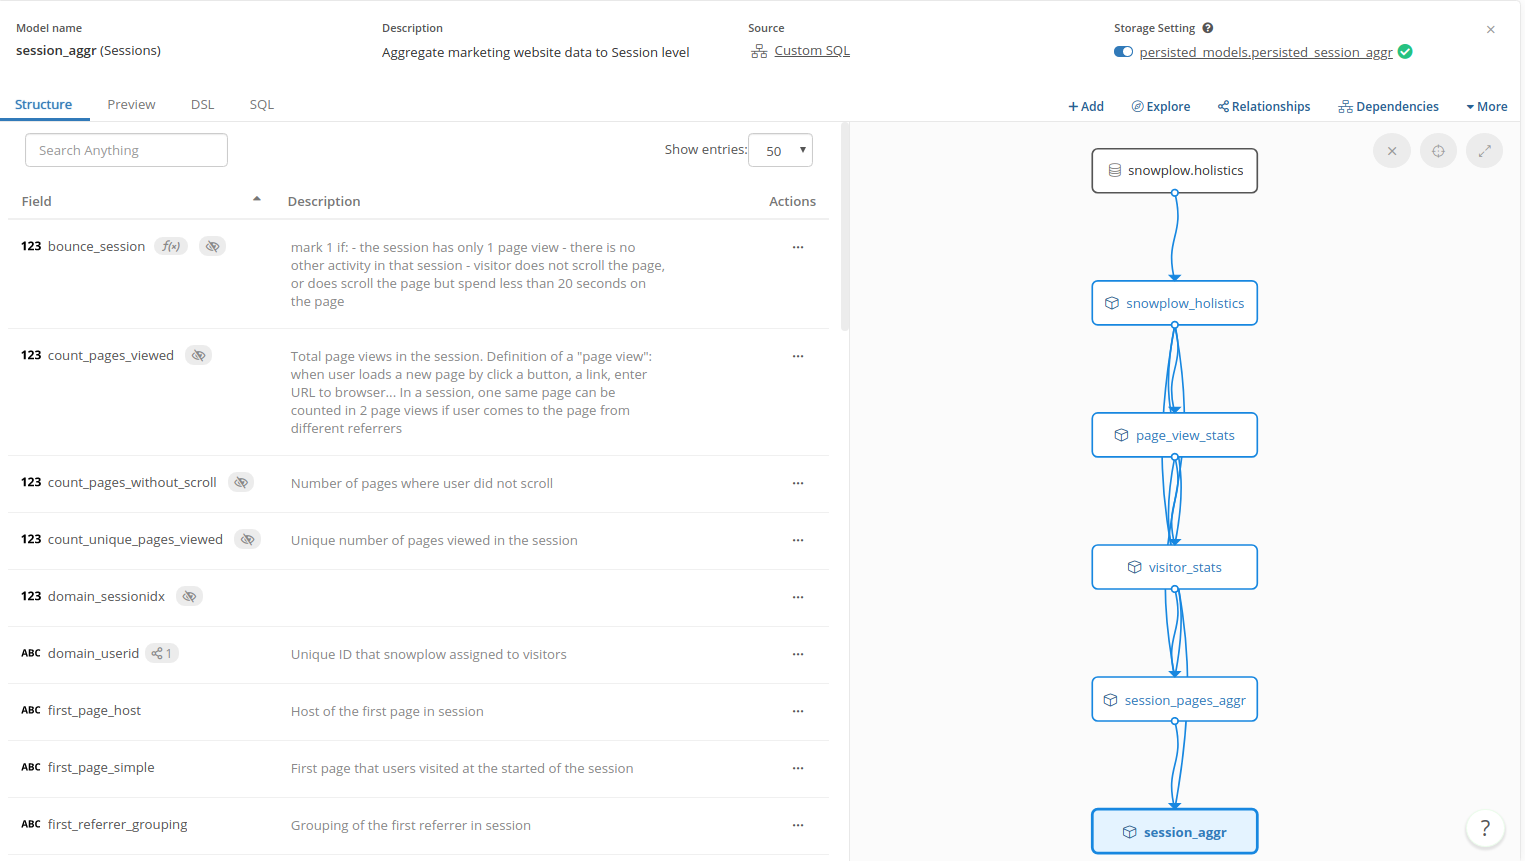
To simplify this process, we make use of Holistics's powerful data modeling feature to model, materialize and manage dependencies between models and reports more easily.
All in all, we are very happy with our current setup. The effort we've put in is much higher, but the reward is also greater — data ownership, flexibility and transparency are the factors that improve our analytics capabilities.
This is not to say that Google Analytics is entirely bad and you should avoid it at all costs. It is still the most popular web analytics tool out there, with the largest community. It is easy and quick to set up, has a convenient built-in reporting capability, and it plays very well with other Google products (for example, with Data Studio). For years, GA has been the gateway that introduced analytics to the masses.
GA was that for us as well — we simply grew out of it. At this point, we believe owning our data and modeling it ourselves is a far superior approach. Occasionally, we do still use GA itself, but the majority of our traffic reports are already replicated with Snowplow and Holistics.
If you're curious about how we modeled our event data to complement and replace Google Analytics — well, subscribe to our newsletter to be alerted to the next post about Event Modeling with Holistics as soon as it is released!
What's happening in the BI world?
Join 30k+ people to get insights from BI practitioners around the globe. In your inbox. Every week. Learn more
No spam, ever. We respect your email privacy. Unsubscribe anytime.

