15 Best AI BI Tools: The Complete List + Comparison (2026)
A structured evaluation of 15 AI business intelligence tools, covering natural-language querying, semantic-layer depth, reliability and governance.
LAST UPDATED October 02, 2026
AUTHOR  Huy Nguyen
Huy Nguyen AI BI tools let people ask questions of company data in plain language and get back charts, numbers and explanations, but the fifteen tools below make very different choices about where the AI gets its business context, and those choices decide how far you can trust the answers. Each card gives the tool's main use case, the one thing that sets it apart and who it suits best, and the full profiles further down cover AI architecture, limitations and best fit.
TL;DR: 15 Best AI BI Tools At A Glance

1. Holistics AI
An AI analytics platform grounded in a programmable semantic layer that the data team manages as code in Git.
Differentiator: The AI writes AQL, a metric-aware query language built for AI reasoning, so it can answer a far wider range of natural-language questions without falling back to raw SQL, and every answer stays governed.
Best for: Engineering-driven companies of 50 to 500 people that want governed, self-service AI analytics.
Search-style questions and answers for large groups of non-technical users.
Differentiator: Spotter Semantics adds a governed model, and the search tokens behind each answer stay visible for checking.
Best for: Enterprises with many non-technical users who need fast, search-style answers.
AI summaries, Q&A and DAX help inside Power BI, Fabric, Teams and Excel.
Differentiator: Copilot runs on the Power BI semantic model and is included with Fabric or Premium capacity, with no separate Copilot license.
Best for: Organizations already standardized on Microsoft 365 and Fabric.

Conversational analytics and AI-assisted dashboards for teams whose data already sits in Databricks.
Differentiator: Genie answers inherit Unity Catalog permissions and lineage, and AI/BI carries no license fee beyond Databricks compute.
Best for: Companies standardized on Databricks and Unity Catalog.
Gemini assistants and BI agents for companies that already model their data in LookML.
Differentiator: Every AI query runs through the LookML model, so answers use the same metric definitions as existing dashboards.
Best for: Large enterprises with existing LookML models, especially on Google Cloud.
Spreadsheet-style analysis with AI assistance, running directly on the cloud warehouse.
Differentiator: Sigma calls warehouse-native LLMs, and Sigma Agents can write data back and trigger actions in tools like Salesforce and Slack.
Best for: Spreadsheet-comfortable teams on Snowflake or Databricks.

7. Tableau AI
Conversational analysis, metric monitoring and forecasting for Tableau and Salesforce customers.
Differentiator: Tableau Agent, Pulse and Einstein Discovery sit on top of the deepest visualization options in this list.
Best for: Salesforce customers who need predictive analytics and rich visualization.

Natural-language Q&A, executive summaries and data stories for AWS-based data stacks.
Differentiator: Quick Sight is part of Amazon Quick Suite, and its per-session reader pricing suits large audiences who view dashboards occasionally.
Best for: AWS-first companies with many occasional dashboard viewers.

9. Hex
AI agents for data teams working in notebooks, plus Threads for business users asking questions in Hex or Slack.
Differentiator: Every Threads answer is backed by a Hex project that an analyst can open and audit as a notebook.
Best for: Data teams that work in SQL and Python notebooks.

10. Qlik
Conversational answers across structured and unstructured data, with no-code machine learning in the same platform.
Differentiator: Qlik Answers, Qlik Predict and a set of specialized agents run on Qlik's associative engine for what-if exploration.
Best for: Organizations that want conversational analytics and no-code ML in one platform.

11. Zenlytic ZOE
An AI data analyst for mid-market teams that want governed answers without a large BI team.
Differentiator: ZOE queries a governed Cognitive Layer and can run Python in a sandbox when a question needs more than a BI query.
Best for: Mid-market teams that want governed AI answers with Python for deeper analysis.

12. Domo
An all-in-one data platform with AI chat, agent building and workflow automation.
Differentiator: The AI Library and Domo MCP Server let agents build cards and trigger workflows inside Domo.
Best for: Companies that want one vendor for data pipelines, dashboards and AI agents.

13. Luzmo IQ
AI chat, search and summaries that SaaS companies embed inside their own products.
Differentiator: Product teams can choose the LLM provider per tenant, which gives control over cost and data residency.
Best for: SaaS companies adding AI analytics to their own products.

14. Julius AI
Conversational statistical analysis for individual analysts working with files or database connections.
Differentiator: Julius generates Python or R code to run t-tests, ANOVA, forecasting and other statistics that most BI tools lack.
Best for: Individual analysts running ad-hoc statistical analysis.

15. Polymer
AI-generated dashboards from spreadsheets and marketing data for small teams.
Differentiator: Plans start at $10 per month, and dashboards can be built without modeling or SQL.
Best for: Small marketing and ecommerce teams working from spreadsheets and ad platforms.
How This Guide Was Put Together
The comparison follows a few rules that we apply to every page in this series:
- Facts come before opinions, and the guide avoids pushing a single recommendation
- Details are backed by official documentation and vendor release notes
- High-level criteria are broken down into specific, measurable sub-points
- Findings are presented in clear, comparable tables
We know we might come across as biased, since we're also a vendor selling an AI BI platform, so the evaluation criteria and sources are laid out below for you to check.
Found an inaccuracy or want your tool added? Use this form.


Comparing The Best AI-powered BI Tools: Side-by-Side Analysis
Scroll to the right to see more
| Dimension | Holistics |  Power BI Power BI |  Looker Looker |  Sigma Computing Sigma Computing | Tableau |  Thoughtspot Thoughtspot | Domo | Zenlytic | Hex |
|---|---|---|---|---|---|---|---|---|---|
| Core Data Exploration Capabilities Learn more Natural-language support for common analytics operations, from simple totals to complex calculations. | |||||||||
| | Holistics AI Supports listing, filtering, breakdowns, aggregations, Top N, reference line, percent-of-total, and period comparison. source | PowerBI Copilot 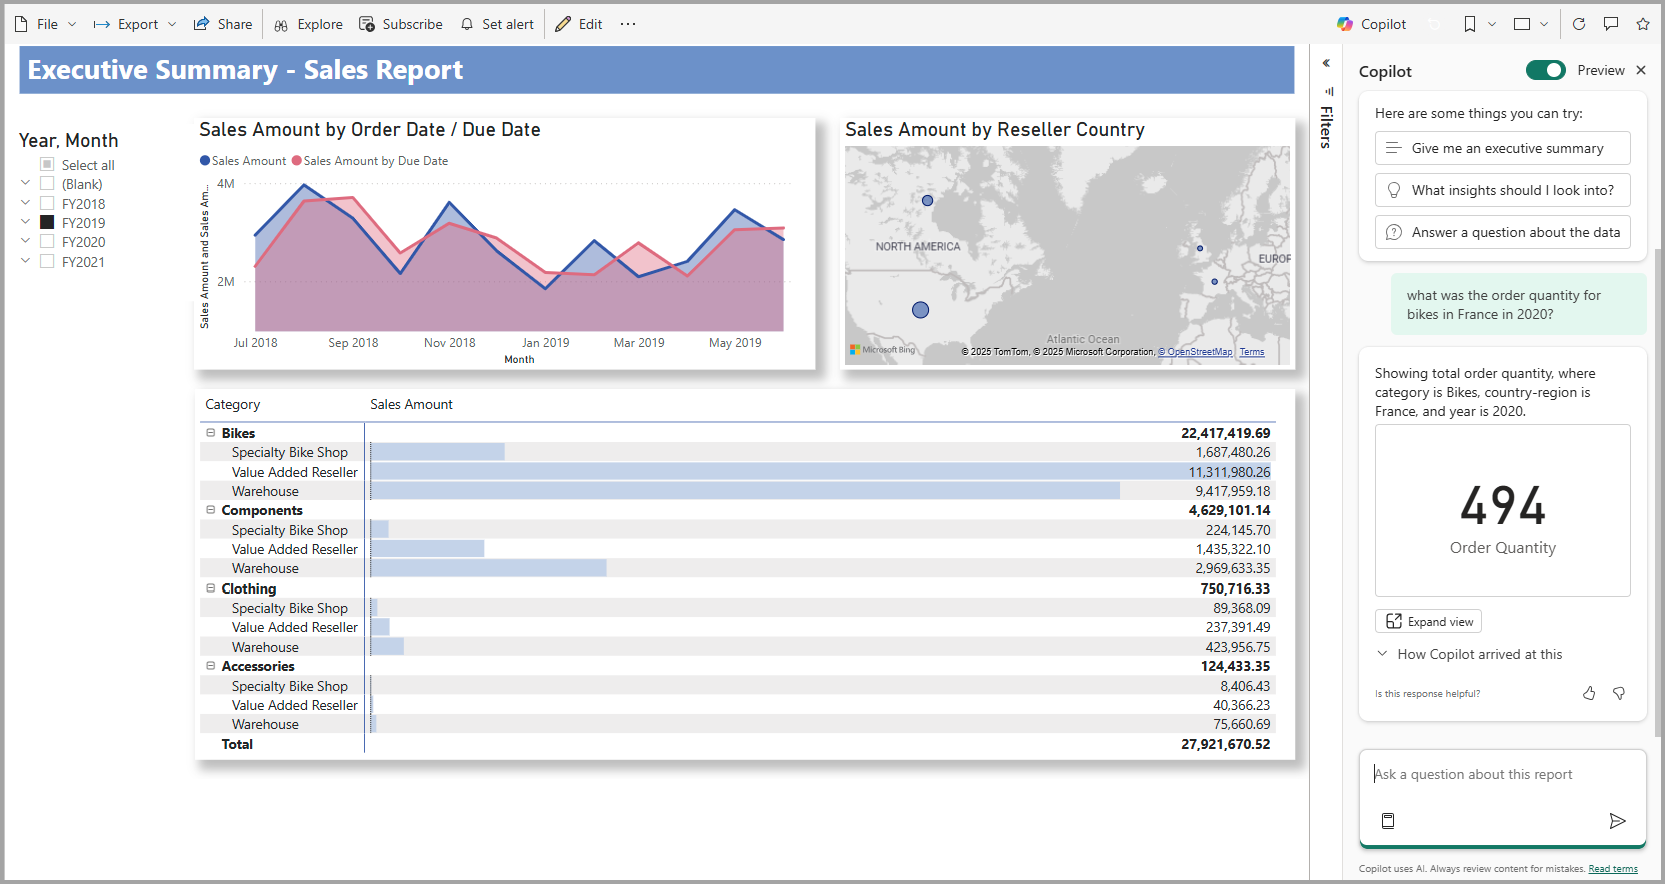 Users can query datasets in natural language to list, filter, and aggregate data. Copilot also supports basic summaries, time comparisons, and ranking based on natural queries. source | Ask Sigma 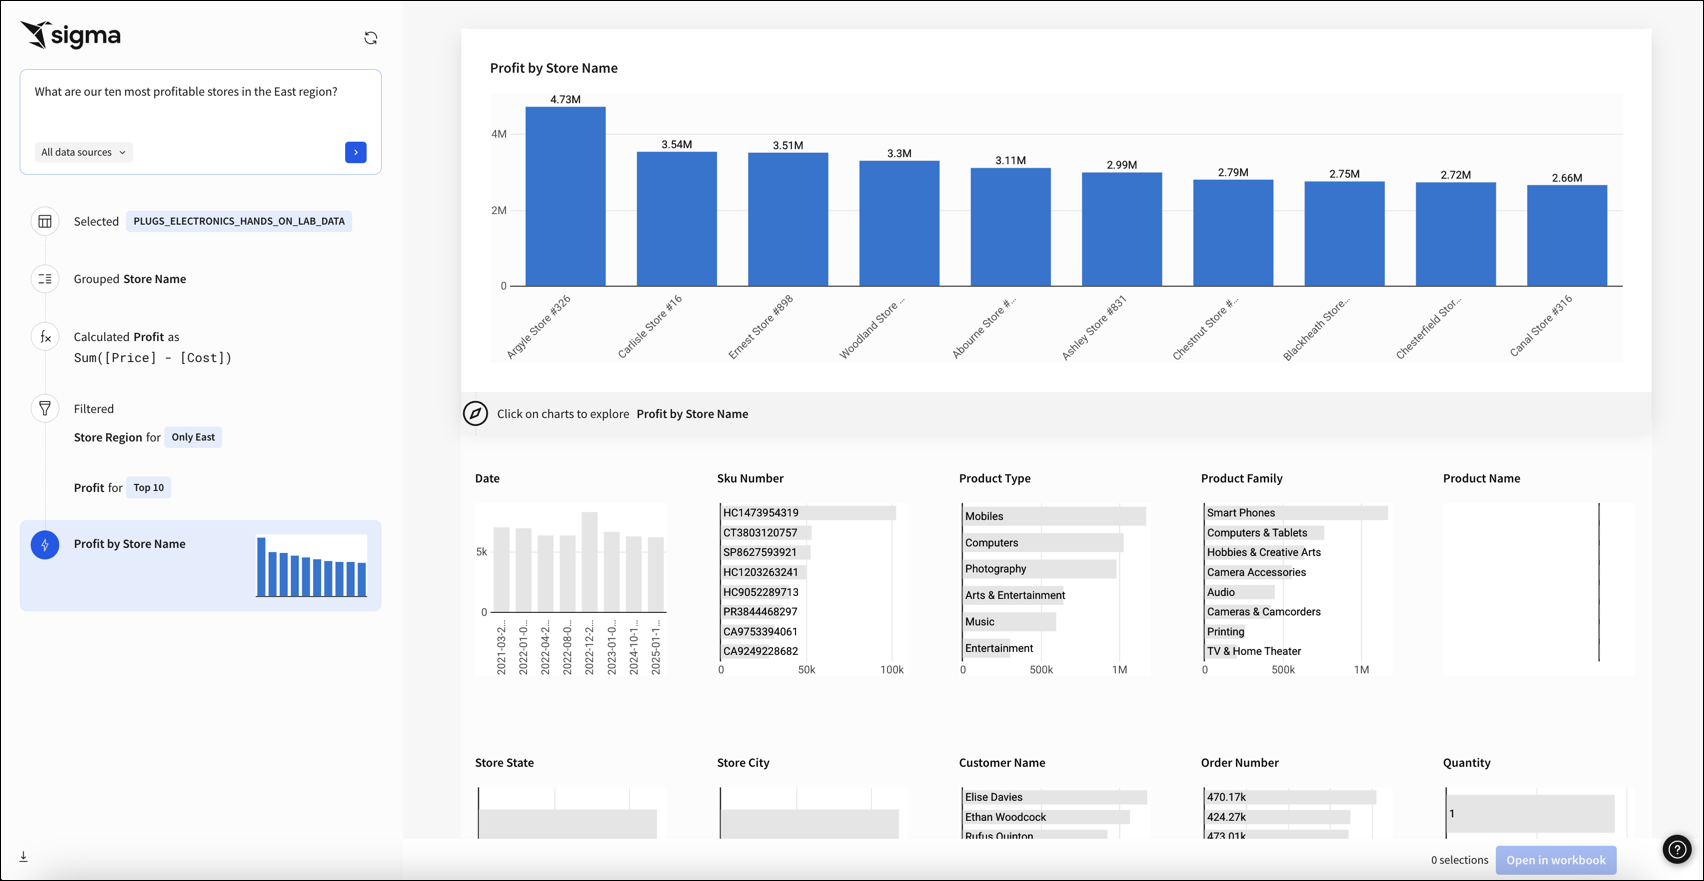 Users can ask questions in natural language using the Ask Sigma agent. All results are interactive and filterable. Period-over-period analysis is available in the platform. Ask Sigma Discovery auto-generates data collections to help users discover available data sources. source | Tableau Agent  Enables users to query data using natural language and receive auto-generated visuals. It supports query for listing, filtering, aggregations, ranking and time series analysis source | Spotter Agent 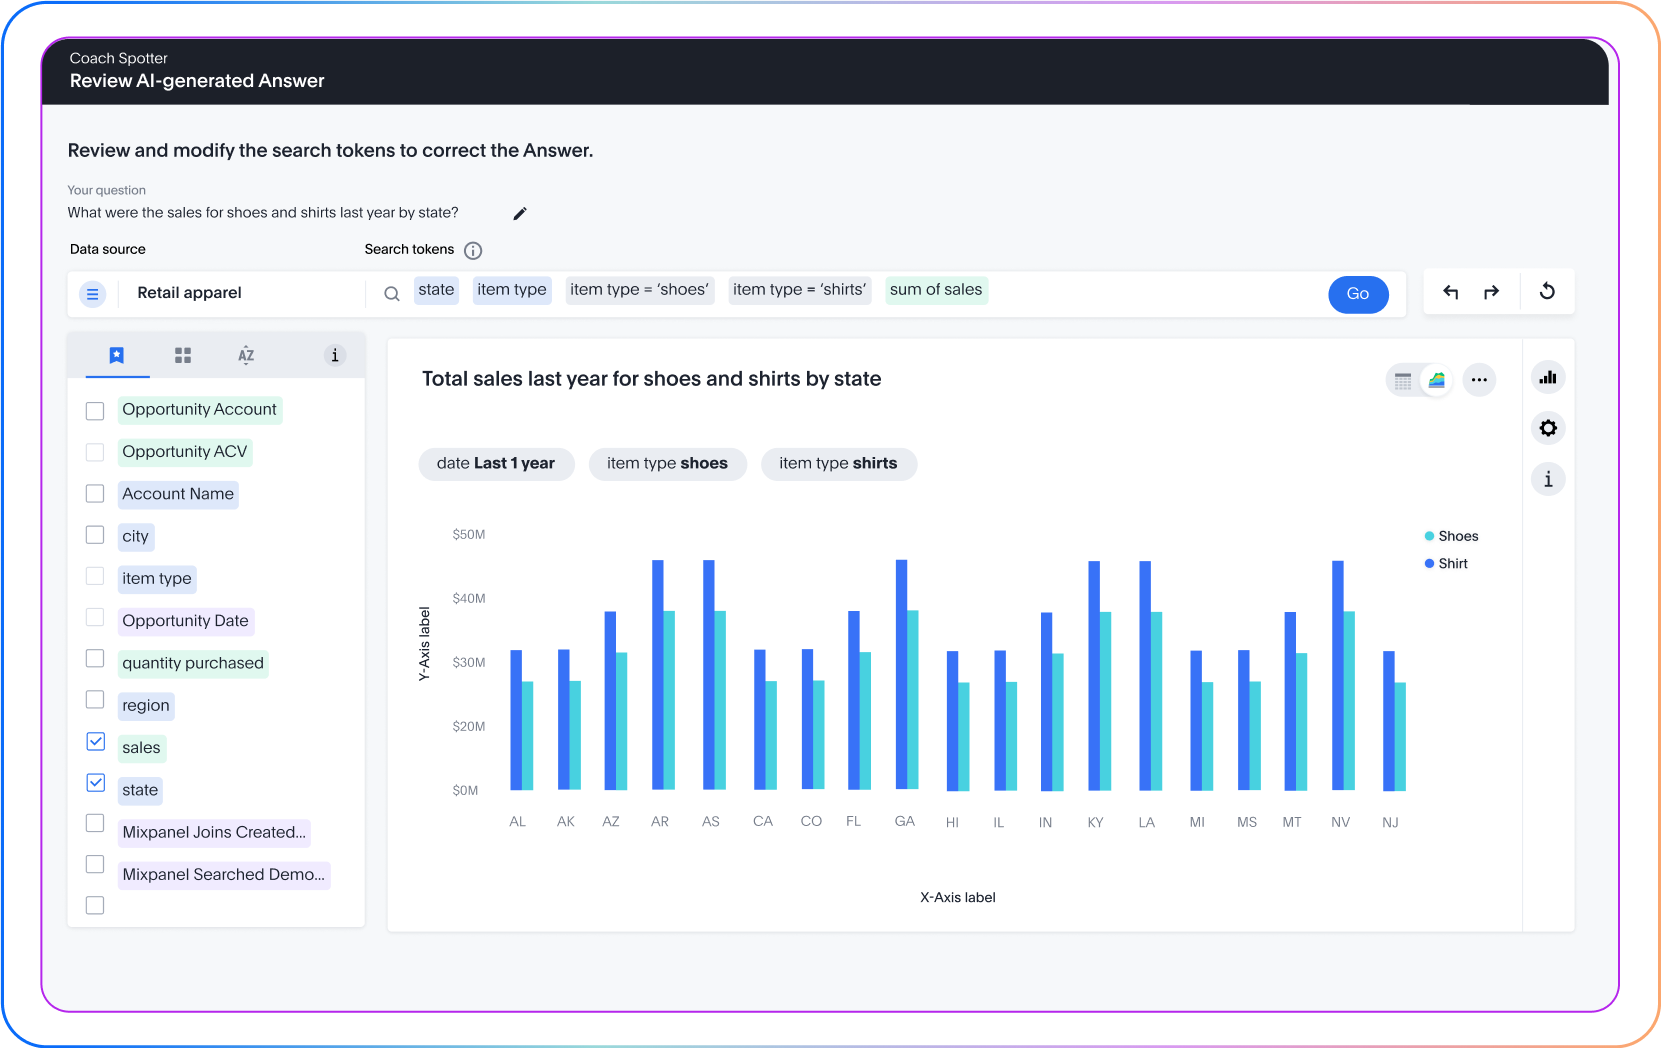 Supports natural language queries for: Listing, filtering dat, aggregations, comparisons, percent of total and ranking source | Natural Language Querying  Ask questions in natural language to generate charts, tables, and insights with follow-up clarifications. source | |||
| | AQL-Enabled  Holistics AI uses AQL, a composable query language that allows complex operations to be broken down into smaller, modular operations and combined together (like Lego blocks). source | ❌ | ❌ | ❌ | ❌ | Beast Mode AI + SQL Assistant Beast Mode AI Writer generates calculated fields from natural language. AI SQL Assistant turns words into precise queries and formulas. Prebuilt Forecasting model detects trends, seasonality, and confidence ranges automatically. source | Code Interpreter Sandboxed Python environment for complex analyses on governed query results and decision-making guidance. source | Notebook Operations Chained cell operations combining SQL, Python, and charts with one-prompt solutions for data workflows. source | |
| | WIP Features | Via Copilot Narrative 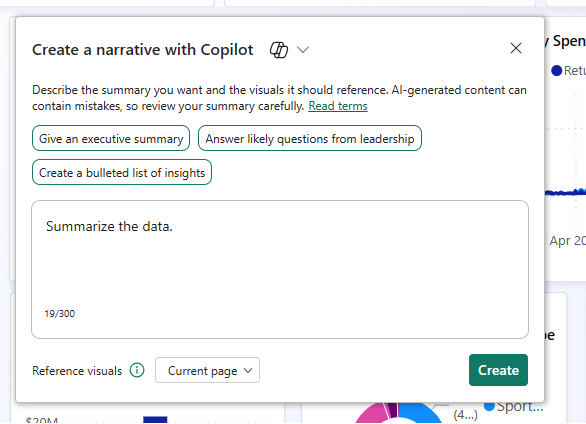 Copilot can summarize visuals and explain trends, but explanations are templated and don't expose query logic behind the scenes. source | Explain Charts with AI 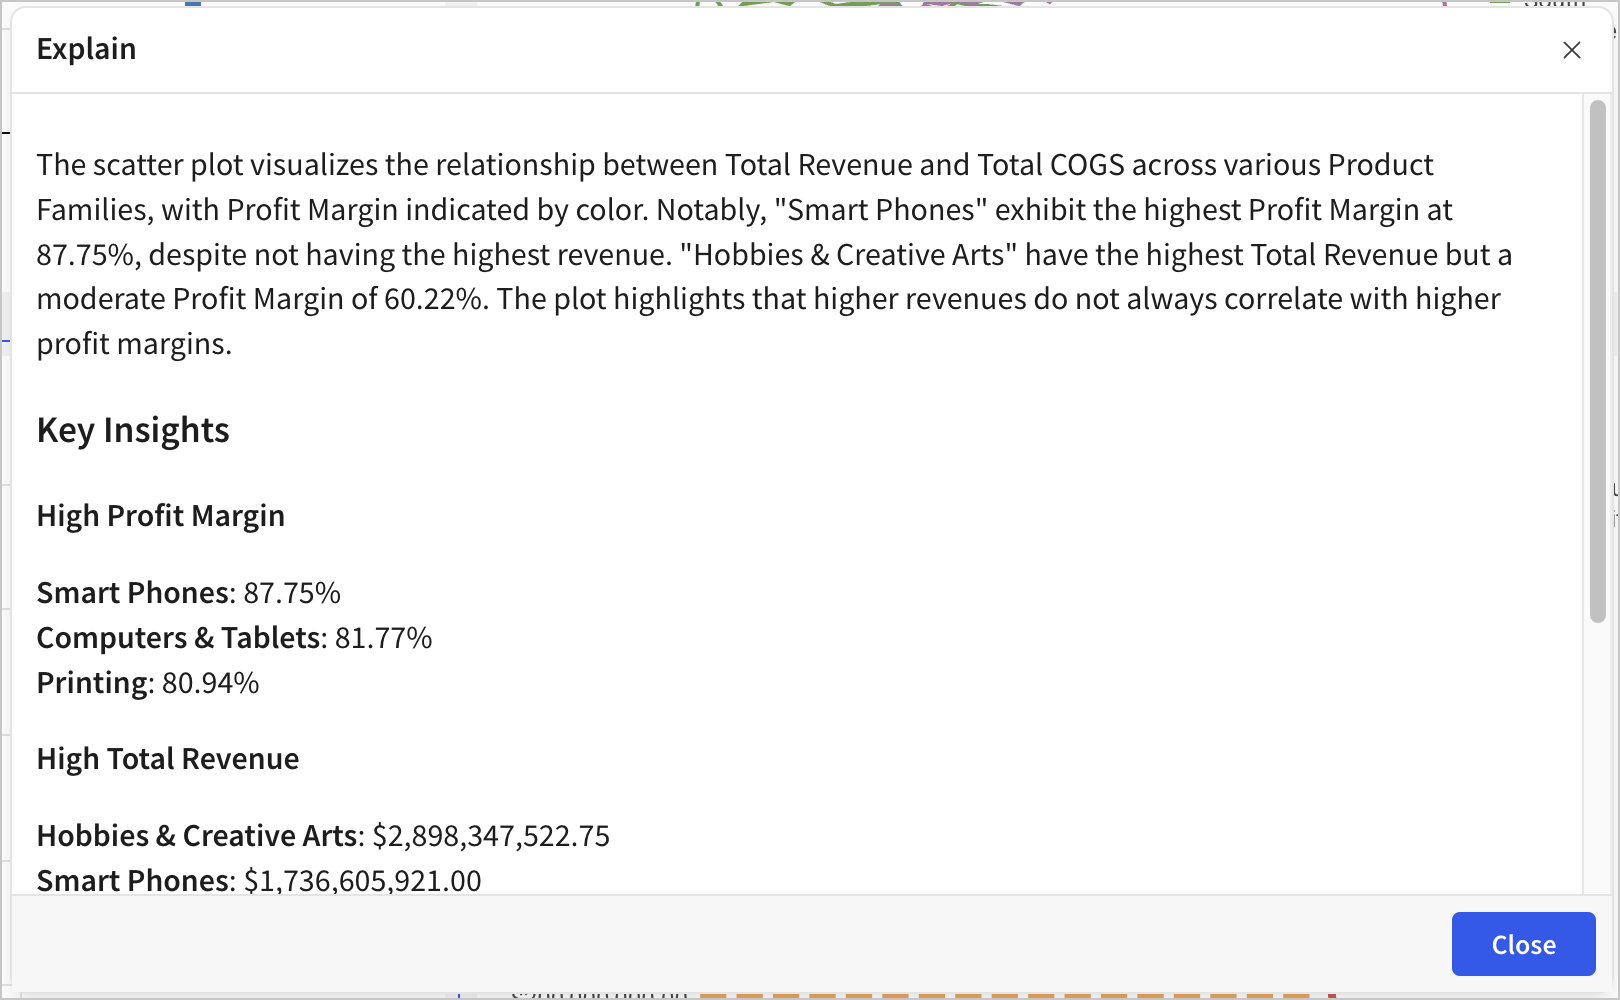 Sigma can describe charts and analysis results via Explain Charts with AI, generating insights, summaries, and contextual interpretations. source | Calculation Explanations + Dashboard Narratives Tableau Agent explains any calculated field (e.g., "Explain the 'Days to Ship' calculation"). Dashboard Narratives (Beta) generates summaries of dashboard content and chart insights for consumers. source | Visual + NL Summary Spotter can summarise results, show underlying logic, and surface key facts. source | Simple Summaries Turns long feedback and data into simple summaries for reports and automated writing tasks. source | Summaries with Citations ZOE builds text summaries and insightful visualizations from data. Inline citations provide data lineage: any numbers referenced in text summaries are cited with serially indexed elements linking back to the underlying query values. source | ||
| | WIP Features | ❌ | JSON Formatting Natural language prompts generate JSON formatting options for Looker visualization customization. source | WIP Feature  Users can edit any of the steps Ask Sigma took by browsing and selecting a different data source, applying a new formula, changing the filter, or altering the prompt. | Via UI Tableau Agent can create initial visuals, and users can manually customize them in the UI. | ❌ | Plot Configuration via NL Users can change chart type, fields, filters, sorts, and limits through the query drawer. ZOE supports plot configuration tips and tricks for customizing visualizations via natural language. source | Natural Language Charts Modify charts based on natural language requests through simple commands. source | |
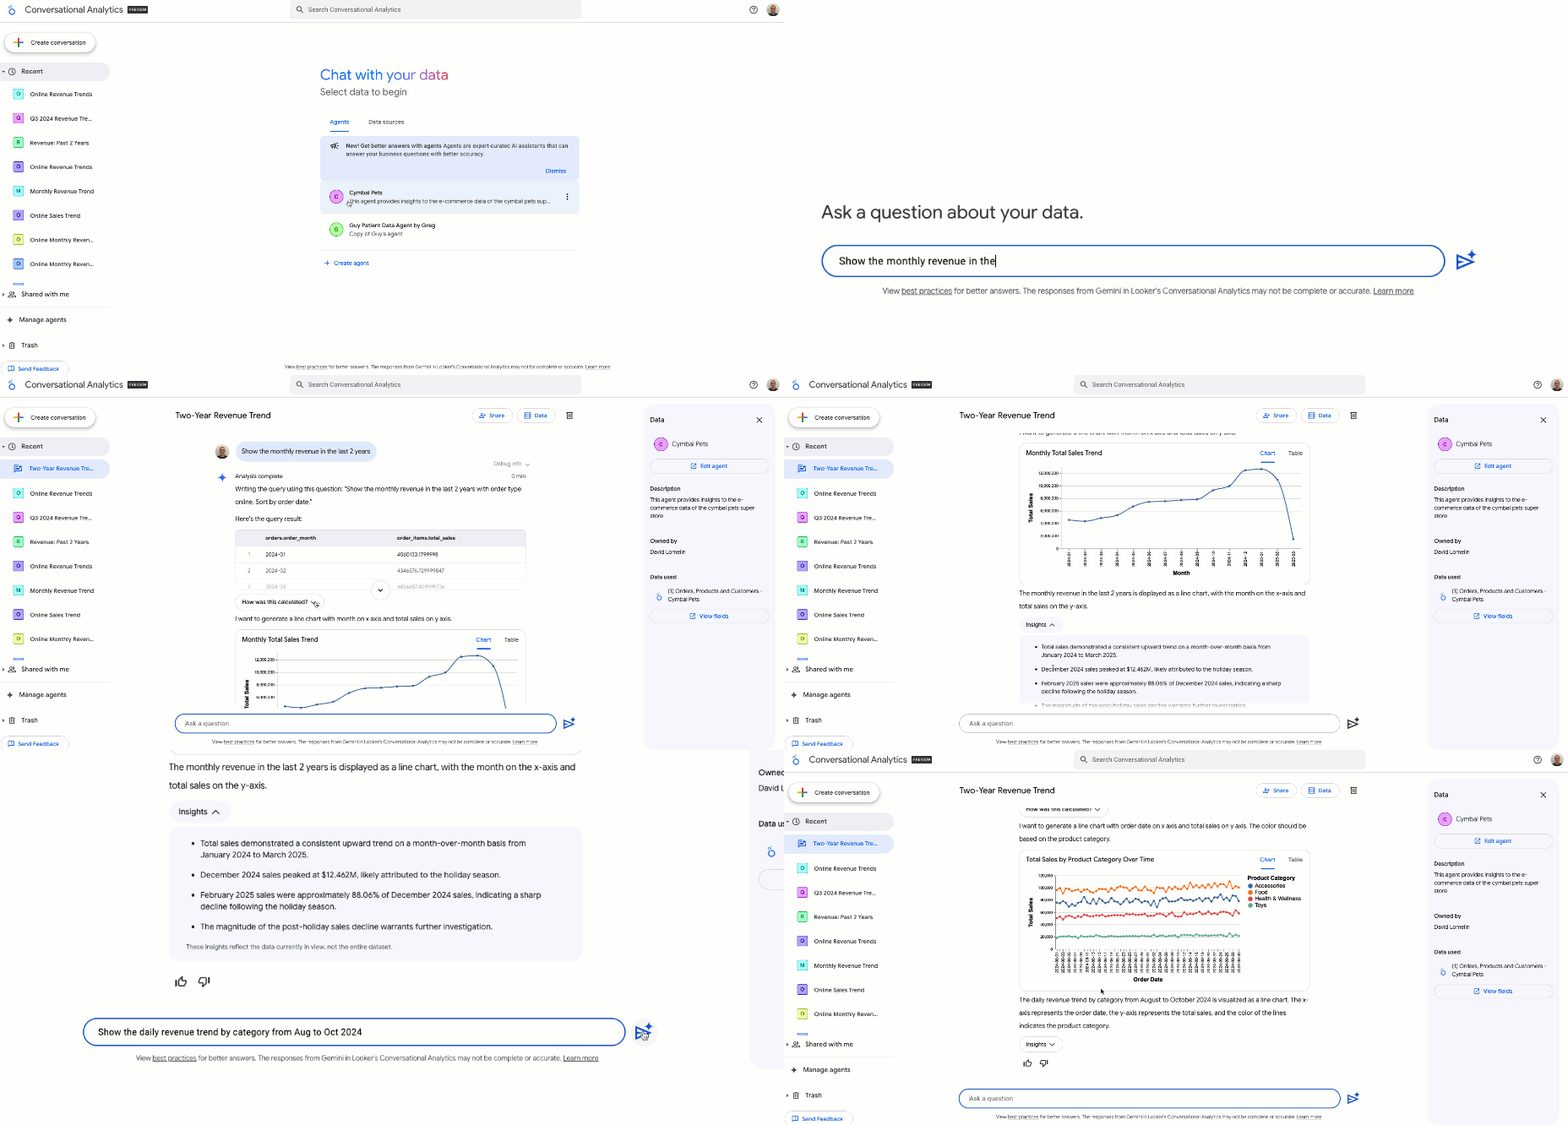
| | Suggest Next Steps Offers follow-up prompts and contextual suggestions mid-conversation. source | Suggest Content 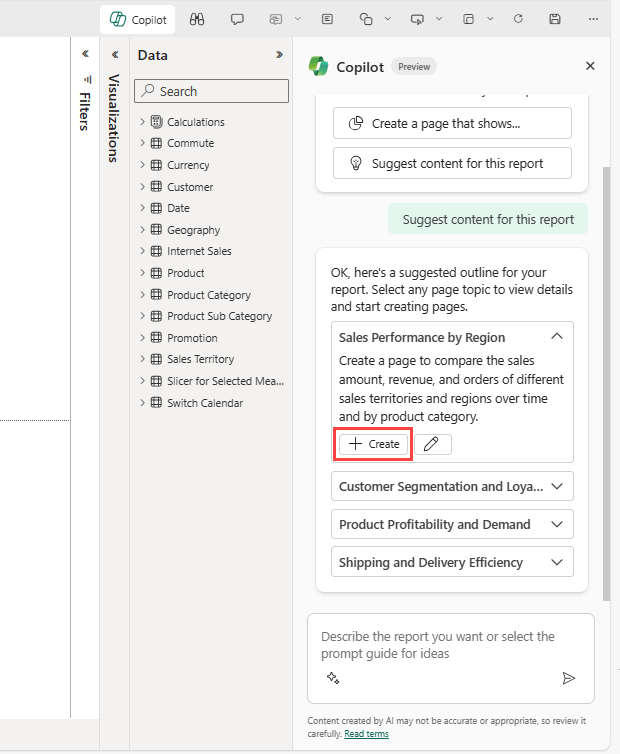 Copilot suggests possible report pages and summaries. source | Agent Collaboration Conversational Analytics (now GA) supports multi-turn conversations with reasoning transparency. Users can share built agents with colleagues for faster access to a single source of truth. Step-by-step reasoning is exposed in agent responses. source | Suggest Additional Analysis (WIP)  Show the answers to related questions, which users can explore further in a Sigma workbook. | Suggest Additional Analyses  After creating a chart or calculation, Agent suggests additional analyses. source | AI-suggested Searches 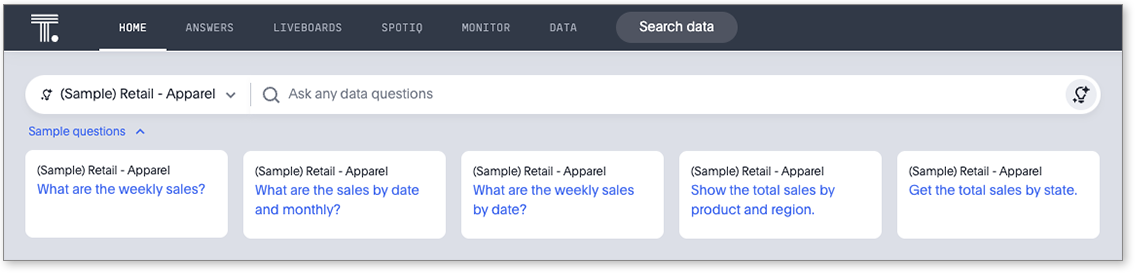 Spotter suggests follow-up questions based on context, ambiguity, or partial matches. source | Recommended Questions Suggests next steps and relevant questions to guide data exploration with recommended sections. source | Follow-up Questions Guides users through complex decision-making with contextual follow-up questions for clarification and refinement. source | |
| | Generate Charts Holistics AI auto-generates visualizations based on query context. Dashboard creation and auto-generated trends and analyses are WIP feature. source | Generate Report Pages  Copilot generates report pages with summary and charts from prompts source | Generate Basic Charts Ask Sigma provides answers to natural language queries with basics charts. source | Generate Charts Tableau Agent support all chart types: bar, line, map, scatter, pie, tree map, etc, but only works on worksheets; not available in dashboards or stories. source | Auto-Chart Generation Ask questions in plain language and get instant answers with suggested visuals and charts. source | Dashboard Creation Generate charts and tables from natural language. Create new dashboards and add visualizations. source | |||
| | Search Documentation Built-in feature to query Holistics documentation within the UI. source | Standalone Copilot (Preview) Standalone Copilot experience (preview) can find and analyze any report, semantic model, and Fabric data agent the user has access to. Also answers from the LLM's general knowledge for non-data questions. source | ❌ No documentation search capability mentioned in Looker Gemini interface. | ❌ | ❌ | ❌ | ❌ No documentation search capability mentioned within Domo AI interface. | ❌ | ❌ |
| Core Semantic Layer Capabilities Learn more Underlying semantic-layer features that ensure consistent metrics, reusable logic, and governed definitions. | |||||||||
| | Generate Semantic Content (WIP) AI can generate model logic, relationships, and formulas grounded in the Holistics semantic modeling layer. source | ❌ Copilot does not generate data models or define relationships. All modeling must be done via Power BI Desktop using tools like Power Query or DAX. source | ❌ | ❌ | SpotterModel (New) SpotterModel is a new agent for automated semantic modeling. Available as an add-on. Enables automated creation of data models and relationships. source | ❌ No explicit automated semantic model generation or relationship creation mentioned for Domo AI. | ❌ | ❌ | |
| | Metadata Enrichment Holistics AI enriches metadata through automatic generation of labels and detailed descriptions, which helps increase reliability. source | Generate Measure Descriptions Only 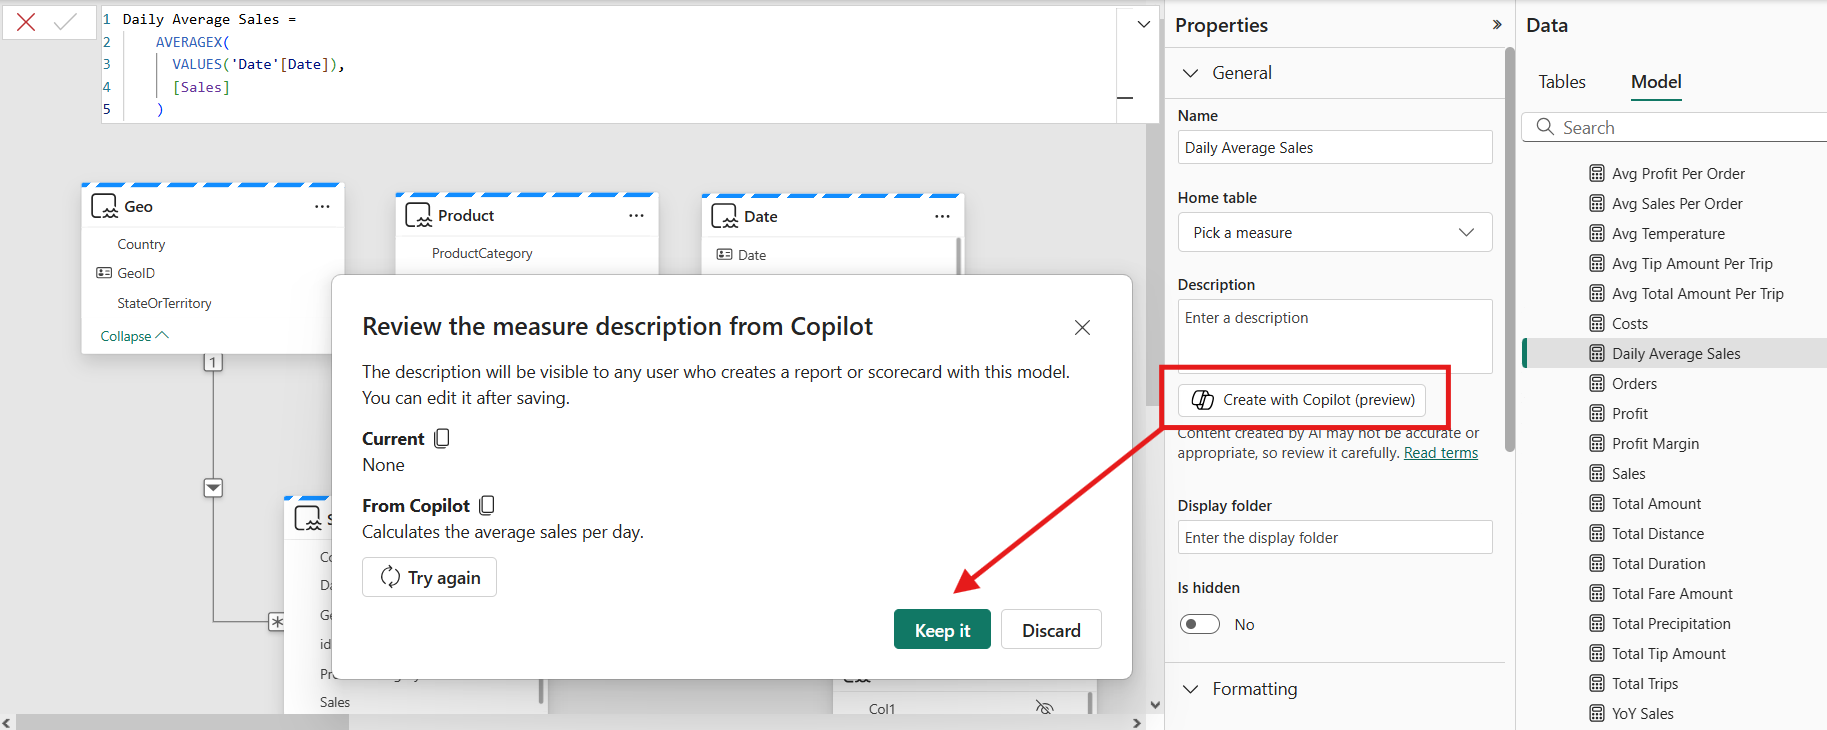 Copilot can add descriptions to your semantic model measures. source | Semantic Foundation LookML semantic layer provides LLM context and ensures centralized metric definitions preventing inconsistencies. source | ❌ | ❌ | ❌ | AI Readiness + FileSets Metadata optimization and contextualization for "AI readiness." FileSets turns images, documents, transcripts, and reviews into actionable intelligence for knowledge management. source | ❌ | |
| | Generate Reusable Metrics AI-generated metrics can be refined in the GUI and promoted into the reusable semantic modeling layer. | Ad-hoc DAX Queries Copilot can generate DAX queries to answer questions that require ad hoc calculations. No reuse of ad-hoc calculations. | Centralized Metrics LookML provides centralized metric definitions. Future roadmap includes enhanced automated metric generation capabilities. source | Limited Support Metrics created by Ask Sigma are temporary expressions; cannot be promoted to a governed semantic layer. | Persistent Calculated Fields Tableau Agent creates calculated fields from natural language that are added to the Data pane and persist in the workbook. Includes naming, syntax generation, and post-calculation suggestions. However, these live in the workbook, not a centralized governed semantic layer. source | Limited Support Metrics created by Spotter are temporary expressions; cannot be promoted to governed semantic layer. | ❌ No explicit AI-generated reusable metrics or semantic layer metric creation mentioned in sources. | ❌ | ❌ |
| Data Context and Literacy Learn more Evaluate whether AI understand business context. | |||||||||
| | AML Semantic Modeling Layer Business metrics, dimensions, and relationships are defined in code-based semantic layer to provide comprehensive business context for AI. source | Strong Foundational Literacy Copilot interprets terms like “metrics”, “trends”, “drivers”, and “repeat visitors” correctly, applying standard analytical logic. source | Semantic Foundation LookML semantic layer aligns data and provides LLM context ensuring centralized metric definitions. source | Strong Foundational Literacy Ask Sigma interprets common analytical concepts correctly. | Strong Foundational Literacy Understands common analytical concepts such as: “break down”, “sum”, “growth”, “profit”. | Supported via Spotter Coach Spotter understands common analytical terms and operators and allows further enrichment. source | Platform-Driven Literacy End-to-end data platform supporting cleaning and loading provides foundation for AI analytical concepts. source | ||
| | Programmable AI Context Analysts can add common business contexts in the whole repo/organization, customize AI preferences and instructions, and add programmable logic based on dynamic conditions and user attributes. source | Via PowerBI Semantic Models Require updating semantic models with work with Copilot. source | LookML Alignment LookML semantic layer ensures AI outputs align with governed metrics and business definitions. source | Partial Support AI understands and reuses field names, measures, and models defined in Sigma. However, it doesn’t have deep semantic layer awareness or centralized business logic reuse. | Support with Data Index Tableau Agent indexes your data to understand the context, including field metadata (field captions, field descriptions (comments), data roles, and data types). source | Supported via Worksheets Built on governed Worksheets and enhanced with synonyms, user prompts, and SpotApps metadata. | Business Language Adaptation Understands business questions in organizational language, adapts to context and asks for clarity. source | ||
| | Strong Support Uses modeling schema and formulas, not raw data, to understand data structure. | Not Available | Knowledge Graph 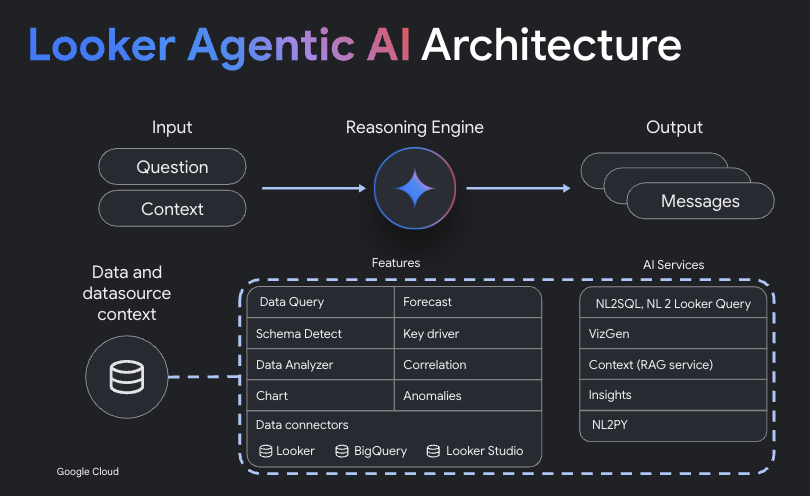 LookML provides database context. AI architecture utilizes dynamic knowledge graph for RAG. source | Not Available | Not Available | Not Available | 1000+ Connectors Connects to over 1000 sources and databases but no explicit AI schema understanding detailed. source | Schema Understanding Uses modeling schema and formulas rather than raw data to understand structure for trustworthy results. source | |
| Reliability Learn more Controls for inspecting, revising, and versioning NL-generated content. | |||||||||
| | Show Thinking Steps  Displays AI “thinking steps” to explain how a result was generated. Follows multi-turn queries and allows clarifications mid-session. source | Explanation Provided 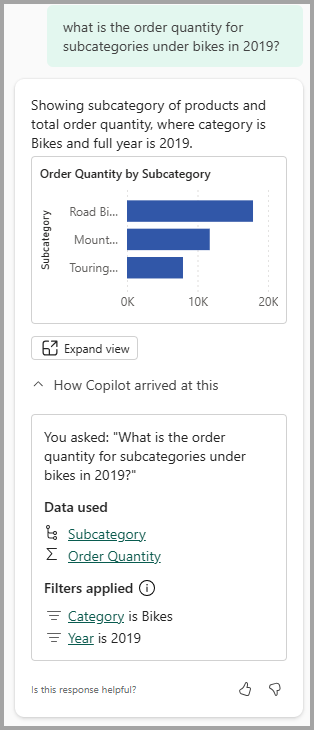 Copilot describes the visual it produced, including the fields it used to build or filter the visual. source | Show Execution Steps  Users can inspect and edit every exeuction step the AI takes during analysis. | Calculation Explanations Tableau Agent explains calculations when asked, showing syntax and logic. However, it does not expose step-by-step reasoning for chart generation like Sigma or Holistics. source | Matching Panel Shows how NL intent was mapped to data and which columns matched which tokens. | Basic Explanations Provides conversational interfaces with explanations but no detailed logic trees or query steps. source | Explainable AI Steps Clearly explains every step taken using traceable enterprise-grade logic, avoiding black-box answers. source | ||
| | Refine Metrics Every operation is visible and editable. Users have the option to tweak the step in the GUI without to start over. source | Undo/Accept After Copilot generates reports, then users have the option to start over by selecting the Undo button. source | Manual Updates Users manually update formatting options after Gemini generates JSON prompts and calculated formulas. source | Strong Support Support undo/redo/acceptand discard AI-generated content. | Recreate + Retry Recreate button returns to a previous viz without re-querying the LLM. Retry button regenerates the response. Not full undo/redo, but supports iterative refinement. source | Refine Queries Users can refine queries or change dimensions directly through follow-up. | ❌ No explicit undo/redo functionality for AI-generated steps mentioned in documentation. | Edit & Retry Users can edit prompts and retry responses mid-conversation. Dynamic Fields can be refined before promotion to the global model. source | |
| | Git Version Control Analytics definitions are stored as code with built-in versioning. | ❌ | Conversation History Users save conversations for future reference. No explicit version control for AI steps. source | Limited Support Changes are managed via Version Tagging. | ❌ | ❌ | ❌ No explicit version control or history tracking for AI-generated content mentioned. | ❌ | Modern Version Control Offers modern version control capabilities for efficient change management. source |
| Optimization Capabilities Learn more Features that improve business understanding and analytical accuracy. | |||||||||
| | Refine and Reuse Metrics AI-generated metrics and insights can be promoted back into the semantic layer to improve business understanding and self-service layer. | ❌ There’s no mechanism to promote Copilot-generated logic to a shared semantic layer or reuse generated metrics across models. | ❌ Future automated semantic model generation to democratize LookML creation with iterative business updates. source | ❌ | ❌ Users cannot refine and promote AI-generated outputs into reusable semantic assets. There’s no flywheel between exploration and modeling. | ❌ | ❌ No explicit mechanism to promote AI-generated insights back into semantic layer mentioned. | Metric Promotion AI-generated metrics can be promoted back into semantic layer to improve business understanding and self-service. source | |
| | Via AQL Metrics Provides composable, declarative AQL metrics. AI can operate at the high-level language without worrying about lower-level details (like database-specific syntaxes, or specific SQL aerobics to achieve common analytic use cases). source | Prep Data for AI 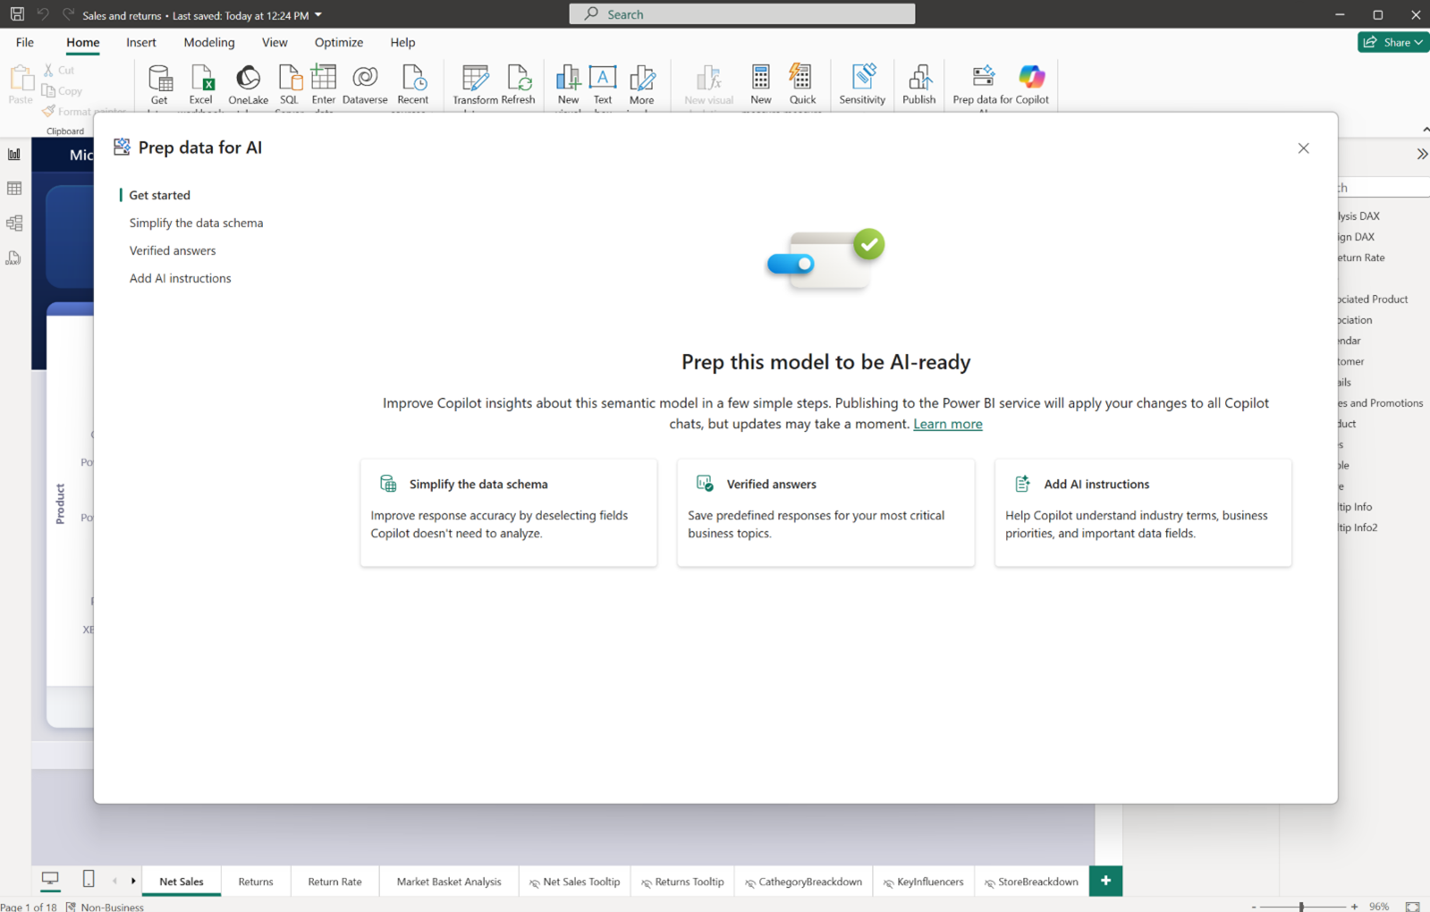 Manually add context to data models and descriptions to DAX measures. Define dedicated schemas to help Copilot understand relevant tables, fields, and relationships. source | Data Governance LookML semantic layer enables governance integration maintaining compliance. Centralized metrics prevent inconsistencies. source | Via Input Tables (WIP) Users can Input Tables to correct the AI-generated outputs, and then securely write these corrections back to the warehouse, which trains the AI model continuously on live user. | Curate Data For AI 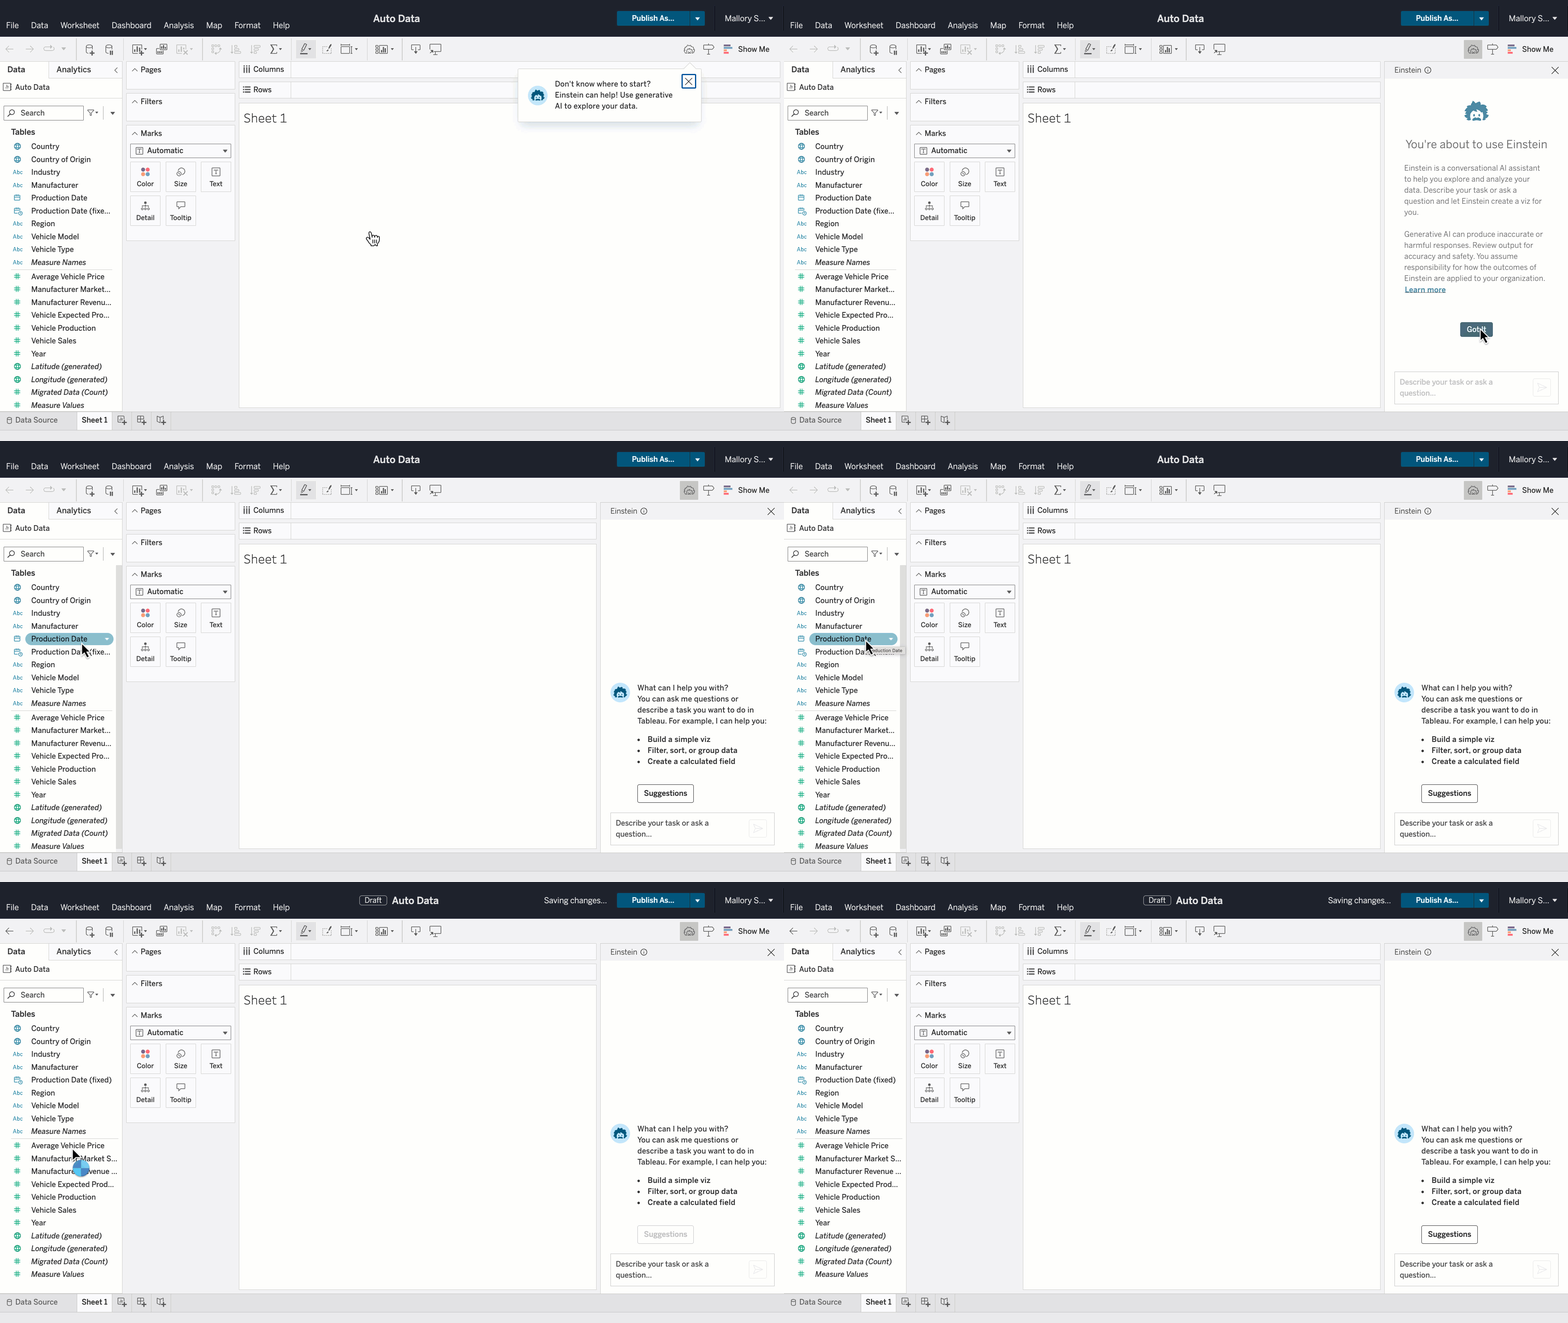 Manually hide unnecessary fields, add clear labels and field descriptions, and specify data types. source | Via Spotter Coach 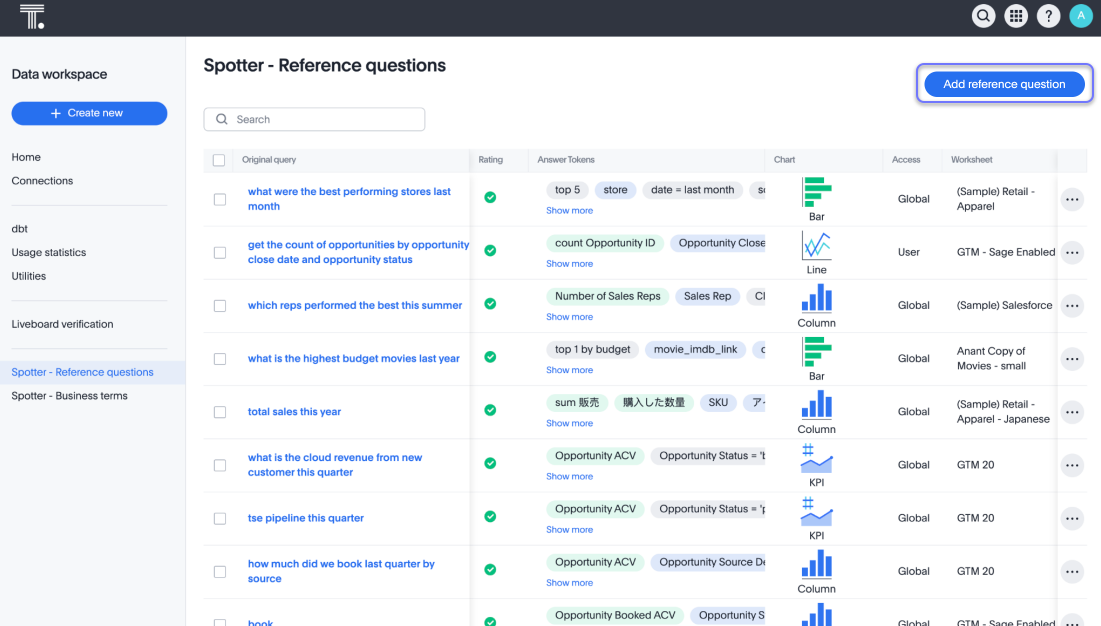 Spotter Coach help improves accuracy over time via curated synonyms, prompts, and feedback interactions. source | ❌ No explicit AI accuracy improvement features or composable metrics mentioned in documentation. | Personal Fields Create user-specific measures and dimensions that can be promoted into global data model via UI. source | |
| | AI Skills Reusable, programmable AI capabilities that admins define and assign to teams or users. Skills include custom instructions, tool definitions, and context that shape how the AI responds, enabling per-team or per-user AI customization. source | Fabric Data Agents Developers create conversational AI agents within Microsoft Fabric, each configured with custom instructions, defined data scope, and context. Agents can be published and shared with users. Previously called "AI Skills." source | ❌ | Custom Agents (Partial) Admins create custom AI agents for workbook-level assistance via a bidirectional MCP hub. Agents connect to external AI services and can produce live AI apps, but the focus is workbook-level rather than a centralized skills library. source | Agentforce (Partial) Admins can build AI agents incorporating Tableau capabilities through the Salesforce Agentforce platform. However, the skill definition layer lives in Salesforce, not in Tableau itself. source | Spotter Coach (Limited) Spotter Coach lets admins save reference question/answer pairs that train the AI on correct query patterns. Useful for improving accuracy, but not programmable: no custom tools, instructions, or per-team assignment. source | Custom Assistants (Partial) Domo's AI Service Layer supports custom assistants for workflow automation, and external model integration (OpenAI, Anthropic). More focused on workflow automation than analytics-context skill authoring. source | ❌ | ❌ |
| Security and Control Learn more Security frameworks and fine-grained access controls for embedded BI. | |||||||||
| | Query Execution Control AI queries are compiled from AQL (Analytics Query Language) using defined, strict access-controlled models. source | Power BI Security Power BI enforces RLS, CLS, and dataset-level access rules during Copilot interactions. Admins can control where Copilot is enabled. | Supported Sigma respects user permissions inherited from the data warehouse. | Einstein Trust Layer Tableau Agents operate on governed content and respect data access rules defined in Tableau Cloud or Server. | Adhere to Thoughtspot Security Sage respects governed Worksheets and adheres to user roles and permissions. | Trusted Governance Built-in governance with user-level control and trusted security framework for AI deployment. source | SSO + Access Grants Supports SSO via Microsoft Entra, Okta, and Google Workload Identity Federation. Includes IP whitelisting, access grants in data modeling, user attributes, user roles, and workspace groups with permissions. source | ||
| | Metadata Only AI only accesses modeling metadata, not raw data. source | Information Not Available | Via Warehouse Roles Admins control data access via warehouse roles; LLMs are only exposed to queried results, not raw datasets. | Einstein Trust Layer RLS and CLS respected via workbook permissions. source | Strong Support Admins control what data is sent to the GPT layer, including metadata and sample values. | FGAC Support Fine-Grained Access Control to content-based security using Domo PDP with flexible security features. source | ❌ | ❌ | |
| | Claude, Gemini, OpenAI Organizations can bring their own LLM provider (Anthropic Claude, Google Gemini, or OpenAI) for governance, cost control, and data residency. source | ❌ Copilot runs on Microsoft-hosted Azure OpenAI infrastructure. Customers cannot plug in their own models or keys. | ❌ No documentation for custom OpenAI keys or models support mentioned in sources. | Use Your Own Agentic AI Write a simple SQL function in Sigma to call an AI model from your cloud data warehouse and run it on data columns. | ❌ | Flexible LLM Selection Pro and Enterprise plans support flexible LLM selection, allowing organizations to choose their LLM provider. Previously limited to Azure OpenAI only. source | External Models Connect to any model safely including OpenAI and Anthropic. Bring external models to work. source | ❌ | ❌ |
| | Code-based Change Management Changes and model definitions are versioned as code and governed with Git, supporting traceability. | Via PowerBI Service Activity is logged in the Power BI service for auditing purposes. | ❌ No explicit documentation for AI interaction logging or auditability features found. | Logging and Auditing Sigma’s enterprise controls include logging via warehouse and platform audit trails. | Salesforce Admin Tools Supported via Salesforce Admin tools | Sage Logging ThoughtSpot logs Sage interactions and disables prompt persistence and model retraining. | Usage Analytics Built-in governance and usage analytics with platform stats for responsible AI deployment monitoring. source | ❌ | ❌ |

Three Waves of AI Analytics Tools
Before comparing features, it helps to understand the architectural differences between AI BI tools, so you don't fall for demos that don't hold up in real use.
The first wave, text-to-SQL tools like Julius AI and early Power BI Copilot implementations, translated natural language directly into database queries. They're fast to ship, but fragile. The AI had no understanding of business definitions, so "revenue" might pull gross revenue in one query and net revenue in the next. It was guessing which tables and columns to join, with no way to know if the output was right.
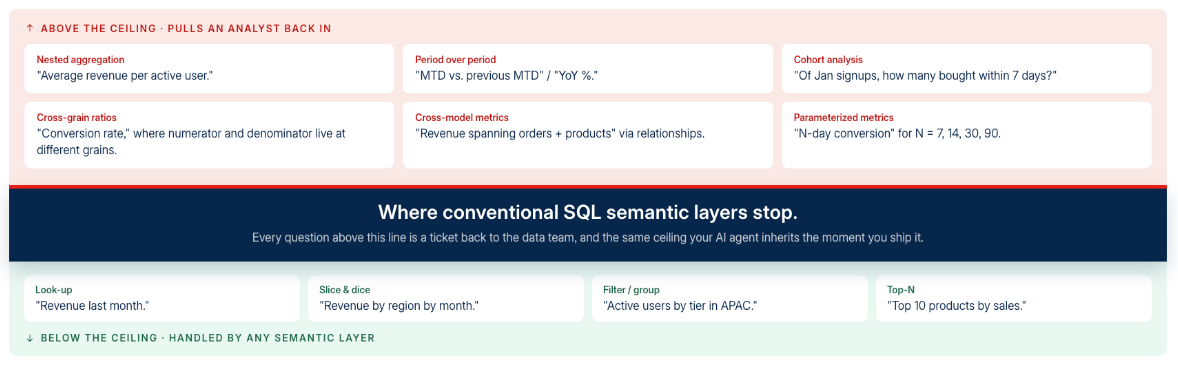
The second wave added a semantic layer on top. Looker Gemini queries LookML definitions. ThoughtSpot Spotter queries its Spotter Semantics layer. Zenlytic ZOE queries its Cognitive Layer. By giving the AI governed metric definitions and business logic to work against, consistency improved. But the intermediary query formats these tools use are often too simple to express complex analytical operations: period-over-period comparisons, nested aggregations, percent-of-total calculations. The AI hits a semantic ceiling on exactly the questions that matter most.
The third wave is AI-native architecture, where the semantic layer is designed from the ground up to be machine-readable. Holistics AI generates AQL (Analytics Query Language), a composable, analytics-specific query language that encodes analytical intent as first-class operations. The AI reasons about analytical patterns rather than translating intent into low-level SQL. Every analytics artifact (models, metrics, dashboards) is code, version-controlled in Git, making AI outputs inspectable and auditable.
By now, you're probably thinking, "This is obviously biased, and calling yourself the third wave of anything is overconfident." But we have good reason to believe that not all semantic layers are the same. Conventional SQL-based semantic layers handle simple lookups and top-N questions, but a substantial share of real user questions need more complex analytical operations, such as nested aggregations ("average revenue per active user"), period-over-period analysis ("MTD vs. previous MTD", "YoY %") or cross-model metrics ("revenue spanning orders + products" via relationships). When the semantic layer can't answer these natively, the answer has to be generated from scratch somewhere else, and the system ends up in the exact failure mode the semantic layer was meant to prevent. (We map out exactly where that ceiling sits in Not all semantic layers are equal.)
How to Evaluate AI BI Tools
Evaluating these tools requires criteria that go beyond feature checklists and demo polish. The question is whether a tool can produce trustworthy, governed results at scale. Here are the seven dimensions we use:
- Semantic layer depth. How rich is the semantic foundation the AI operates on? The depth of the semantic layer sets the ceiling of what AI can reliably answer.
- Core AI capabilities. Can the AI handle the full analytics workflow: querying, enriching the data model, and generating visual outputs?
- Data context depth. Does the AI understand business definitions, schema structure, and conversational history, or is it guessing from column names?
- Optimizability. Can teams improve the AI's understanding of the business over time by feeding corrections and new definitions back in?
- Output reliability. Are AI-generated outputs inspectable, modifiable, and version-controlled to the same standard as human-built analytics?
- Operational scalability. Does the AI help teams grow analytical output without multiplying manual work or creating inconsistent logic?
- Security controls. Does the AI respect existing permissions and enforce access boundaries?
Semantic layer depth
A semantic layer is a centralized definition of business metrics, dimensions, and logic that sits between the data warehouse and the user-facing BI interface. In AI analytics, the semantic layer is the AI's understanding of the business. It determines what the AI can reliably answer.
Without one, two users asking the same question get different numbers, trust erodes, the organization reverts to manual analysis.
The catch: semantic layers vary wildly in depth. That depth directly determines the ceiling of AI capabilities:
| Semantic layer depth | What AI can answer | Example tools |
|---|---|---|
| No semantic layer | Simple queries against raw tables; high hallucination risk | Julius AI, Polymer |
| Basic semantic layer | First-order questions (metrics by dimensions); breaks on follow-ups | Power BI Copilot (DAX-based), Tableau AI |
| Rich semantic layer | Multi-step analytical reasoning, composable metrics, period comparisons | Holistics AI (AQL), Looker Gemini (LookML), ThoughtSpot Spotter |
| AI-native semantic layer | Full analytical workflows; AI generates governed, inspectable code | Holistics AI (analytics-as-code + AQL) |
For a deeper comparison of semantic layer expressiveness, including nested aggregations, cross-grain ratios, and composability, see the semantic layer BI tools comparison.
--
Core AI capabilities
An AI-powered BI tool should support the full workflow: querying data, enriching the data model, and generating visual outputs.
- Data exploration. The AI should handle filters, aggregations, period-over-period comparisons, percent-of-total calculations, and rankings. It should support multi-step analytical questions: "show me revenue by region, compare to last quarter, and highlight the top 5 by growth rate." Holistics AI handles these through AQL's composable metric logic. ThoughtSpot Spotter uses natural language search against its Spotter Semantics layer. Power BI Copilot generates DAX queries and narrative visuals.
- Semantic layer enrichment. The AI should help data teams build and improve the semantic model: auto-generating data models, suggesting metric definitions, adding descriptions and annotations. This is where tools diverge sharply. Holistics AI can generate AQL-based metric definitions that data teams review and promote into the governed model. Looker Gemini generates LookML parameters and visualization configurations from natural language. Most other tools treat the semantic layer as read-only for AI purposes.
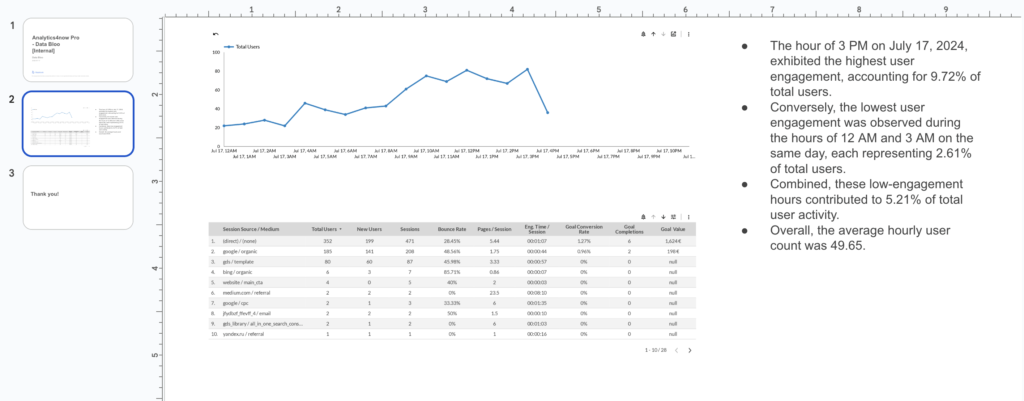
- Analytical content generation. The AI should generate charts, dashboards, and narrative insights from natural language prompts. Sigma Computing's Sigma Agents trigger agentic workflows that locate data sources and build multi-step analyses. Tableau AI uses predictive models and automated discovery through Tableau Agent. Julius AI generates Python code and statistical analyses. The key question: is generated content governed (traceable, editable, version-controlled) or ephemeral?
Data context depth
AI in BI only works if the system understands business context beyond language syntax. This dimension separates tools that produce reliable answers from tools that produce plausible guesses.
Five levels of data context matter:
- Base data literacy. Can the AI parse analytical concepts like "growth," "breakdown," "top 10 by revenue"? Every tool in this guide handles basic analytical terms, though accuracy varies.
- Business context. Does the AI interpret questions using the semantic model (dataset relationships, field descriptions, naming conventions) or does it guess from column names? Holistics AI, Looker Gemini, ThoughtSpot Spotter, and Zenlytic ZOE all use semantic definitions for business-aligned query generation.
- Database context. Does the AI understand schema structure, data types, join paths, and granularity? Tools with deep semantic layers (Holistics, Looker) handle this natively. Text-to-SQL tools (Julius AI) rely on schema inference, which is less reliable.
- Result context. Can the AI explain what a chart means, beyond just displaying it? Sigma Computing, Holistics AI, and ThoughtSpot Spotter offer AI-generated explanations of query results.
- Conversational context. Does the AI handle multi-turn questions and mid-query corrections? Holistics AI, ThoughtSpot Spotter, Power BI Copilot, and Zenlytic ZOE support multi-turn conversational analytics. Tableau AI's Tableau Agent supports multi-step workflows, though its conversational depth is still maturing.
Optimizability
A useful AI BI tool should improve with use. Teams should be able to feed corrections and new definitions back into the semantic model so future queries benefit from past work.
Three capabilities define an optimizable system:
- Semantic enrichment loop. Users define new logic and promote it into the governed layer. Holistics AI supports this through AQL: analysts refine AI-generated metrics and promote them into the shared semantic model. Zenlytic ZOE allows "Personal Fields" that can be promoted to the global model.
- Composable metric logic. The AI should support reusable analytical patterns. "Top 5 customers by revenue growth" should be a composable query that other queries can reference. Holistics AI's AQL and Looker's LookML both support composable metrics, though through different mechanisms.
- Guided learning. The system surfaces working examples that help users build complex queries. ThoughtSpot Spotter suggests searches. Holistics AI provides programmable context: analysts define organization-level instructions, business logic, and workflow guidance that shape how the AI generates queries. Holistics also supports AI Skills: reusable, admin-defined capabilities that customize AI behavior per team or user, so different departments get context-appropriate responses without duplicating the underlying model. Microsoft Fabric offers a comparable concept with Fabric Data Agents.
The result: an AI system that gets faster and more accurate as institutional knowledge accumulates. Future users benefit from past corrections without repeating them.
Output reliability
AI-generated metrics, dashboards, and models must meet the same reliability standards as human-built analytics. Three capabilities determine whether they do:
- Inspectability. Every AI output should show which metrics were used, how filters were applied, and how results were calculated. Holistics AI makes every step visible and editable. Looker Gemini shows the generated LookML. ThoughtSpot Spotter displays matched search tokens for verification.
- Modifiability. Users should be able to accept, reject, or modify individual elements of AI output without starting over. Sigma Computing and Holistics AI both support fine-grained human-in-the-loop refinement.
- Version control. Changes to AI-generated content should be tracked: who modified what, when, and why. Holistics and Looker both support Git-based version control for analytics definitions. This is critical for audit trails, rollback capability, and regulatory compliance.
Operational scalability
An AI BI tool must scale operationally, helping teams grow analytical output without multiplying manual work or creating inconsistent logic.
Three dimensions to evaluate:
- Contextual scaling. The AI uses semantic metadata to consistently interpret new queries across datasets. As the data model grows, AI accuracy should improve rather than degrade. Tools with rich semantic layers (Holistics AI, Looker Gemini) handle this better than text-to-SQL approaches.
- Metric generation at scale. The AI recommends standardized metric logic (year-over-year growth, percent-of-total) across data domains and enforces consistency at query time. Holistics AI's AQL enables composable metrics that prevent metric fragmentation.
- Cross-team workflows. The system supports workflows where business users define new metrics and data teams validate or promote them. Zenlytic ZOE and Holistics AI both support this explorer-to-modeler promotion pattern.
Security controls
AI in BI introduces new security considerations beyond traditional access controls. The AI must respect existing permissions and enforce access boundaries.
Four capabilities to check:
- Query execution control. The AI enforces dataset-level, row-level (RLS), and column-level (CLS) security. It should never generate queries that access data the requesting user is unauthorized to see. Holistics, Looker, and ThoughtSpot enforce permission-aware query generation.
- Input control. Administrators control which metadata, sample data, or query results are visible to the AI. This prevents unintentional exposure of sensitive context. Holistics AI provides fine-grained controls over what data the AI can access.
- Bring Your Own Model (BYOM). Organizations can use their own LLM provider for cost tracking, privacy control, and data residency. Holistics AI supports Claude, Gemini, and OpenAI as custom AI providers. Sigma Computing allows warehouse-native LLM calls. Microsoft Fabric Data Agents and ThoughtSpot offer flexible LLM selection on higher-tier plans.
- Logging and auditing. All AI actions (what was suggested, accepted, rejected, edited) are tracked for compliance and debugging.
The common thread across all seven dimensions: the semantic layer is the load-bearing structure. Every other capability, from AI accuracy to security enforcement, inherits the quality and depth of the semantic foundation underneath it.
15 Best AI BI Tools: Pros, Cons and Pricing
These fifteen AI business intelligence tools take different bets on how AI should work inside a BI product, from search interfaces on a governed model to warehouse-native assistants and spreadsheet-first dashboard generators. The order is mixed on purpose, because the right choice depends more on your data stack and your users than on any single ranking, and each profile covers the AI approach, key differentiators, limitations and the buyer context where the tool fits best. For deeper capability breakdowns and pricing, see our Best AI Analytics Platforms guide.
1. Holistics AI
Holistics AI is the AI layer of Holistics, a BI platform built on three foundations: a semantic modeling layer, AQL (Analytics Query Language) for composable metric logic, and analytics-as-code for version control and governance.
AI architecture: Holistics AI generates AQL, an analytics-specific query language, instead of SQL. AQL treats analytical intent such as period comparisons, nested aggregations and percent-of-total as built-in operations, so the AI composes analytical patterns rather than guessing SQL joins. Models, datasets, metrics and dashboards are all text-based code in Git, which makes AI outputs inspectable and auditable.
Key differentiators:
- Semantic-layer-first AI. The AI queries a semantic model where metrics, dimensions and business logic are defined once and reused, which avoids the "different numbers in different dashboards" problem common in text-to-SQL tools.
- AQL composability. Running totals, percent-of-total, nested aggregations and period-over-period comparisons are native AQL operations, so the AI can build complex logic without falling back to raw SQL.
- Five-level context system. The AI draws on semantic and reporting layer definitions, organization-level custom context, AI Skills assigned per team or user, conversation history and built-in analytical knowledge, so it works with the business's vocabulary and each team's conventions.
- AI Skills. Admins define reusable AI capabilities, each with custom instructions, tool definitions and context, and assign them to specific teams or users, which tailors the AI per team without duplicating the data model.
- MCP Server. Holistics exposes governed querying through the Model Context Protocol, so Claude, Cursor or any MCP-compatible client can query governed metrics, which makes Holistics a data backend for AI workflows outside its own interface.
- Metric promotion loop. Analysts review and refine AI-generated metrics and promote them into the governed model, so later users and later AI queries benefit from past corrections.
- Dashboard summaries and chat history. The AI summarizes dashboard content in natural language and keeps conversation history across sessions, so users can pick up where they left off.
- Analytics-as-code. Models, datasets and dashboards live in Git with review, testing and CI/CD workflows, which applies software engineering practices to the full BI lifecycle.
Limitations: The modeling layer has a learning curve for teams used to GUI-only BI tools. Visualizations cover dependable charts and tables but sit below Tableau's level of visual polish, and some advanced patterns, such as role-playing dimensions and cross-model calculations, need extra modeling work. Holistics holds a 4.6/5 rating on Capterra from about 89 reviews.
Best fit: Data teams that want AI analytics grounded in a governed semantic layer. Organizations that want inspectability and version control over AI outputs. Companies of 50 to 500 people that want Looker-grade governance without Looker-grade cost and overhead.
2. ThoughtSpot Spotter
ThoughtSpot Spotter is the AI agent at the center of ThoughtSpot, which the company now positions as an "Agentic Analytics Platform." Spotter combines natural-language understanding with deterministic reasoning, and it keeps the search-style interface ThoughtSpot is known for.
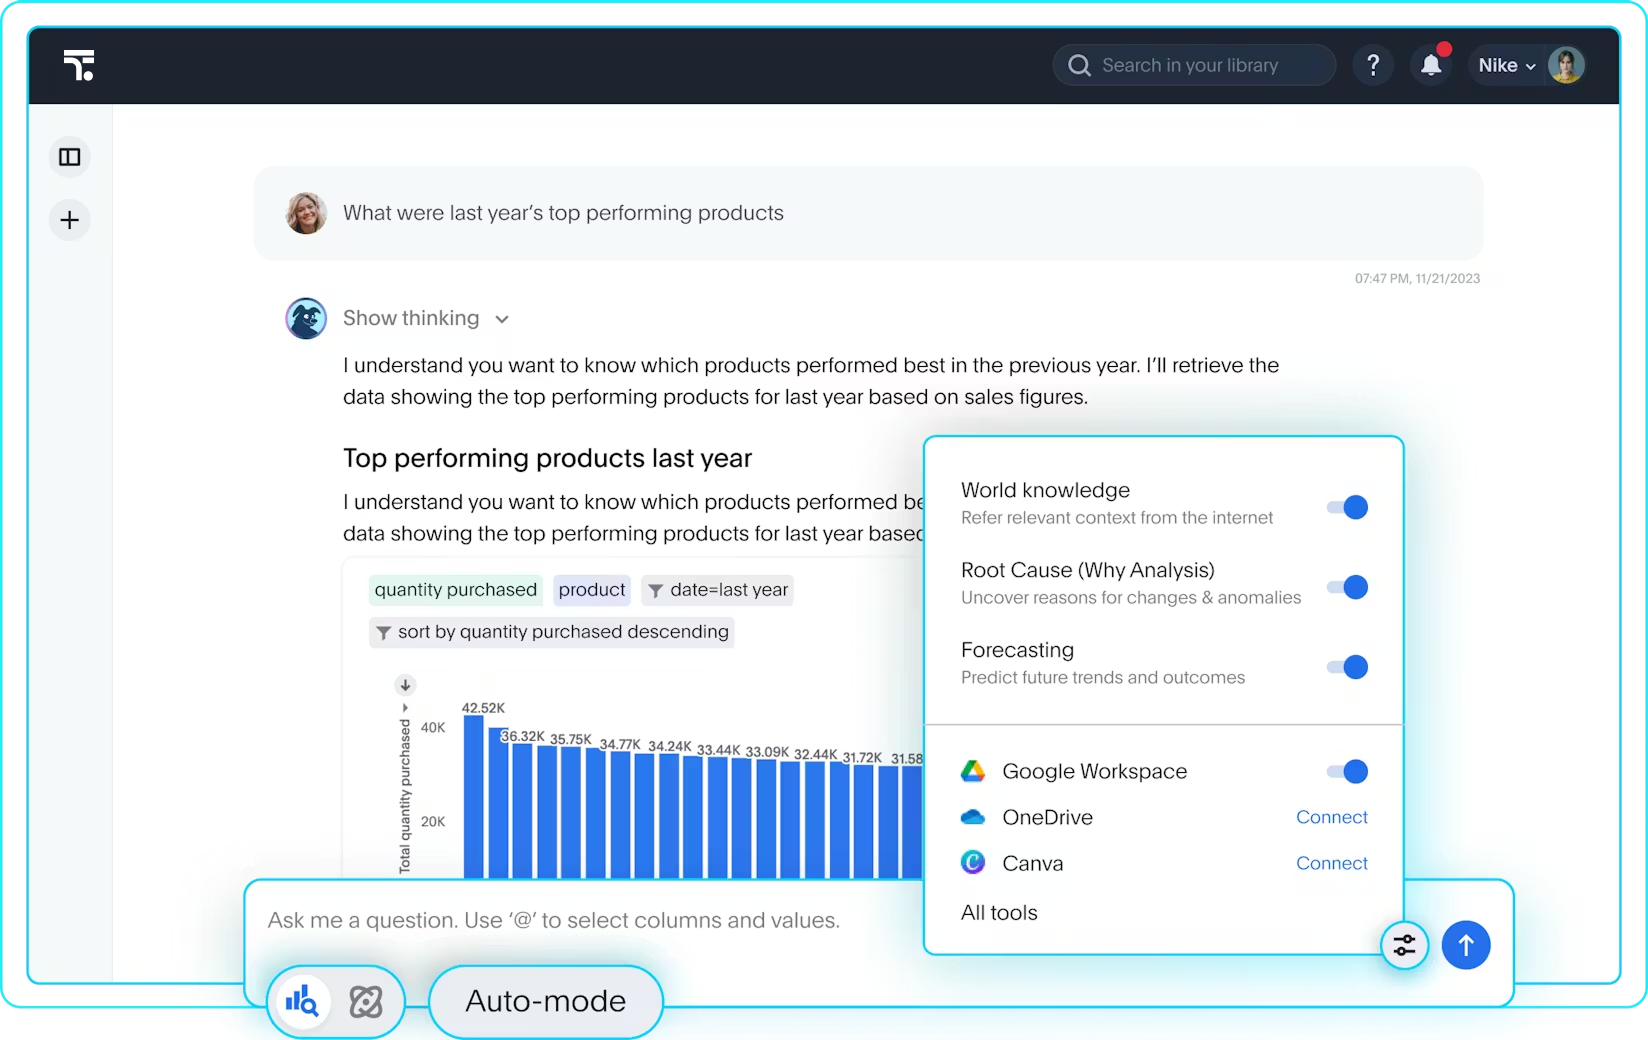
AI architecture: Spotter translates natural-language questions into relational searches against ThoughtSpot's semantic layer, which was rebuilt as Spotter Semantics in March 2026. Spotter Semantics adds deterministic reasoning, aggregate awareness and governed business definitions on top of the original Worksheet model. Spotter pairs LLMs with proprietary reasoning, and the search tokens behind each answer stay visible for checking. ThoughtSpot acquired Mode Analytics in 2023, and Mode now runs inside ThoughtSpot as Analyst Studio, with agentic data preparation.
Key differentiators:
- Search-first interface. The search bar takes non-technical users from a question to a chart quickly, in an experience closer to a search engine than to a traditional BI tool.
- Spotter Semantics. The semantic layer launched in March 2026 replaces the Worksheet-based model with deterministic reasoning, a new generation of search tokens and machine-readable business context.
- Spotter for Industries. Vertical analytics agents for healthcare, retail, financial services, tech and software, logistics and travel each come with industry terminology, data models and regulatory context.
- SpotIQ automated insights. SpotIQ surfaces anomalies, trends and correlations without the user having to ask for them.
- Agentic Data Prep. Analyst Studio adds AI-driven data preparation and connects to external semantic layers, including dbt and Looker.
Limitations: Spotter Semantics is newer than LookML or Holistics' AQL and has less production history with complex multi-step analyses. Pricing is a barrier for smaller teams: Essentials costs $25 per user per month, Pro costs $50 per user per month with 25 Spotter queries included, and Enterprise is custom-priced, typically between $150k and $350k a year. ThoughtSpot holds a 4.5/5 rating on Capterra from 282 reviews.
Best fit: Organizations with many non-technical users who need fast ad-hoc answers. Enterprise teams willing to invest in data modeling up front to support search-driven self-service. Companies interested in industry-specific analytics agents.
3. Power BI Copilot
Power BI Copilot is Microsoft's generative AI assistant for Power BI. It runs on Azure OpenAI and adds natural-language questions, report summaries and DAX generation, and Power BI itself is now a core workload of Microsoft Fabric.
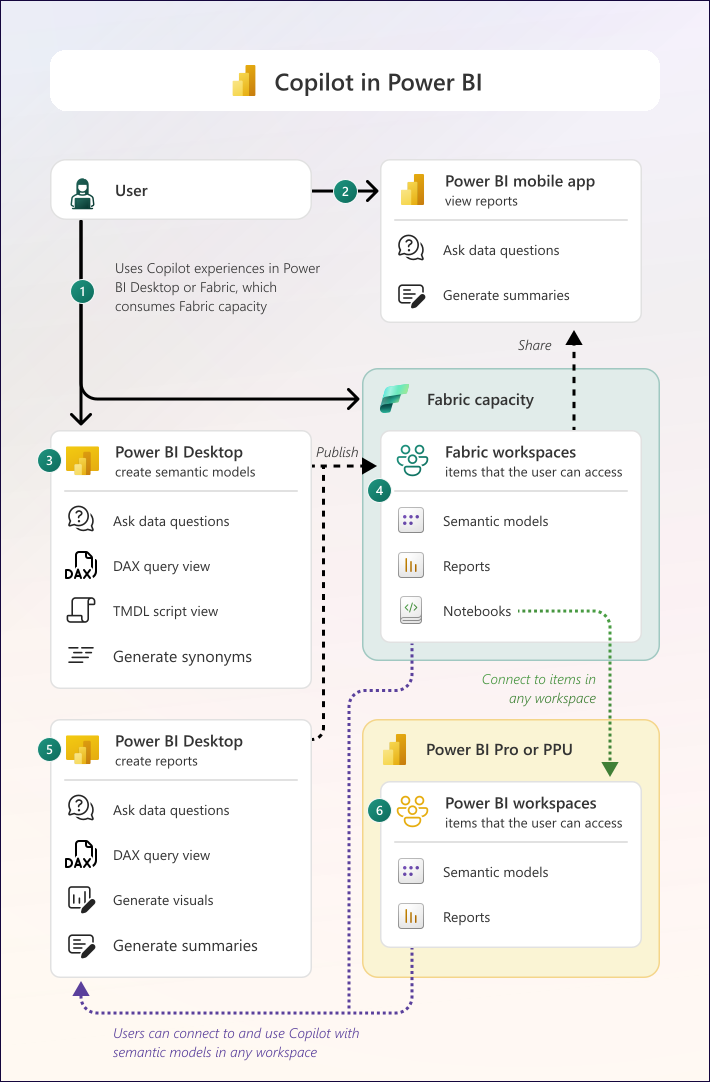
AI architecture: Copilot generates DAX (Data Analysis Expressions) queries and narrative visuals from natural-language prompts, using the Power BI semantic model for context. It runs as an assistant inside a report and, since March 2026, as a standalone full-screen experience for finding and analyzing any report, semantic model or dataset. Multi-turn chat became generally available on desktop and mobile in April 2026.
Key differentiators:
- Microsoft ecosystem integration. Copilot works natively with Excel, Teams, SharePoint and Azure data sources, so organizations already on Microsoft 365 need less new setup than with any other tool on this list.
- Report summaries. Copilot summarizes report pages, visuals and the underlying semantic model, which helps executives who read dashboards more than they build them.
- DAX assistance. Copilot writes DAX from natural language, which lowers the learning curve of a formula language many analysts find hard to master.
- Multi-turn conversations. Copilot holds back-and-forth chats grounded in the report's context, replacing its earlier single-turn design.
Limitations: Copilot is strongest at summaries and single-scope questions. Multi-step reasoning, such as "show me revenue by region, then drill into the top 3 by growth rate," is less reliable than in tools built for analytical AI. DAX measures add some abstraction but stop short of a full semantic layer, and cross-table calculations can return inconsistent results when the model is poorly governed. Copilot requires Fabric capacity (F2 or higher) or Power BI Premium capacity (P1 or higher), and no separate Microsoft 365 Copilot license is needed.
Best fit: Organizations deep in the Microsoft ecosystem that want AI help with reading reports. Teams whose main AI use cases are summaries and DAX generation rather than exploratory analysis.
4. Databricks AI/BI Genie
Databricks AI/BI is the business intelligence layer built into the Databricks Data Intelligence Platform, made up of AI/BI Dashboards for AI-assisted dashboard authoring and Genie for conversational questions and answers. Both products run on data governed by Unity Catalog, so they share the permissions, lineage and business definitions that the data team has already set up in the lakehouse.
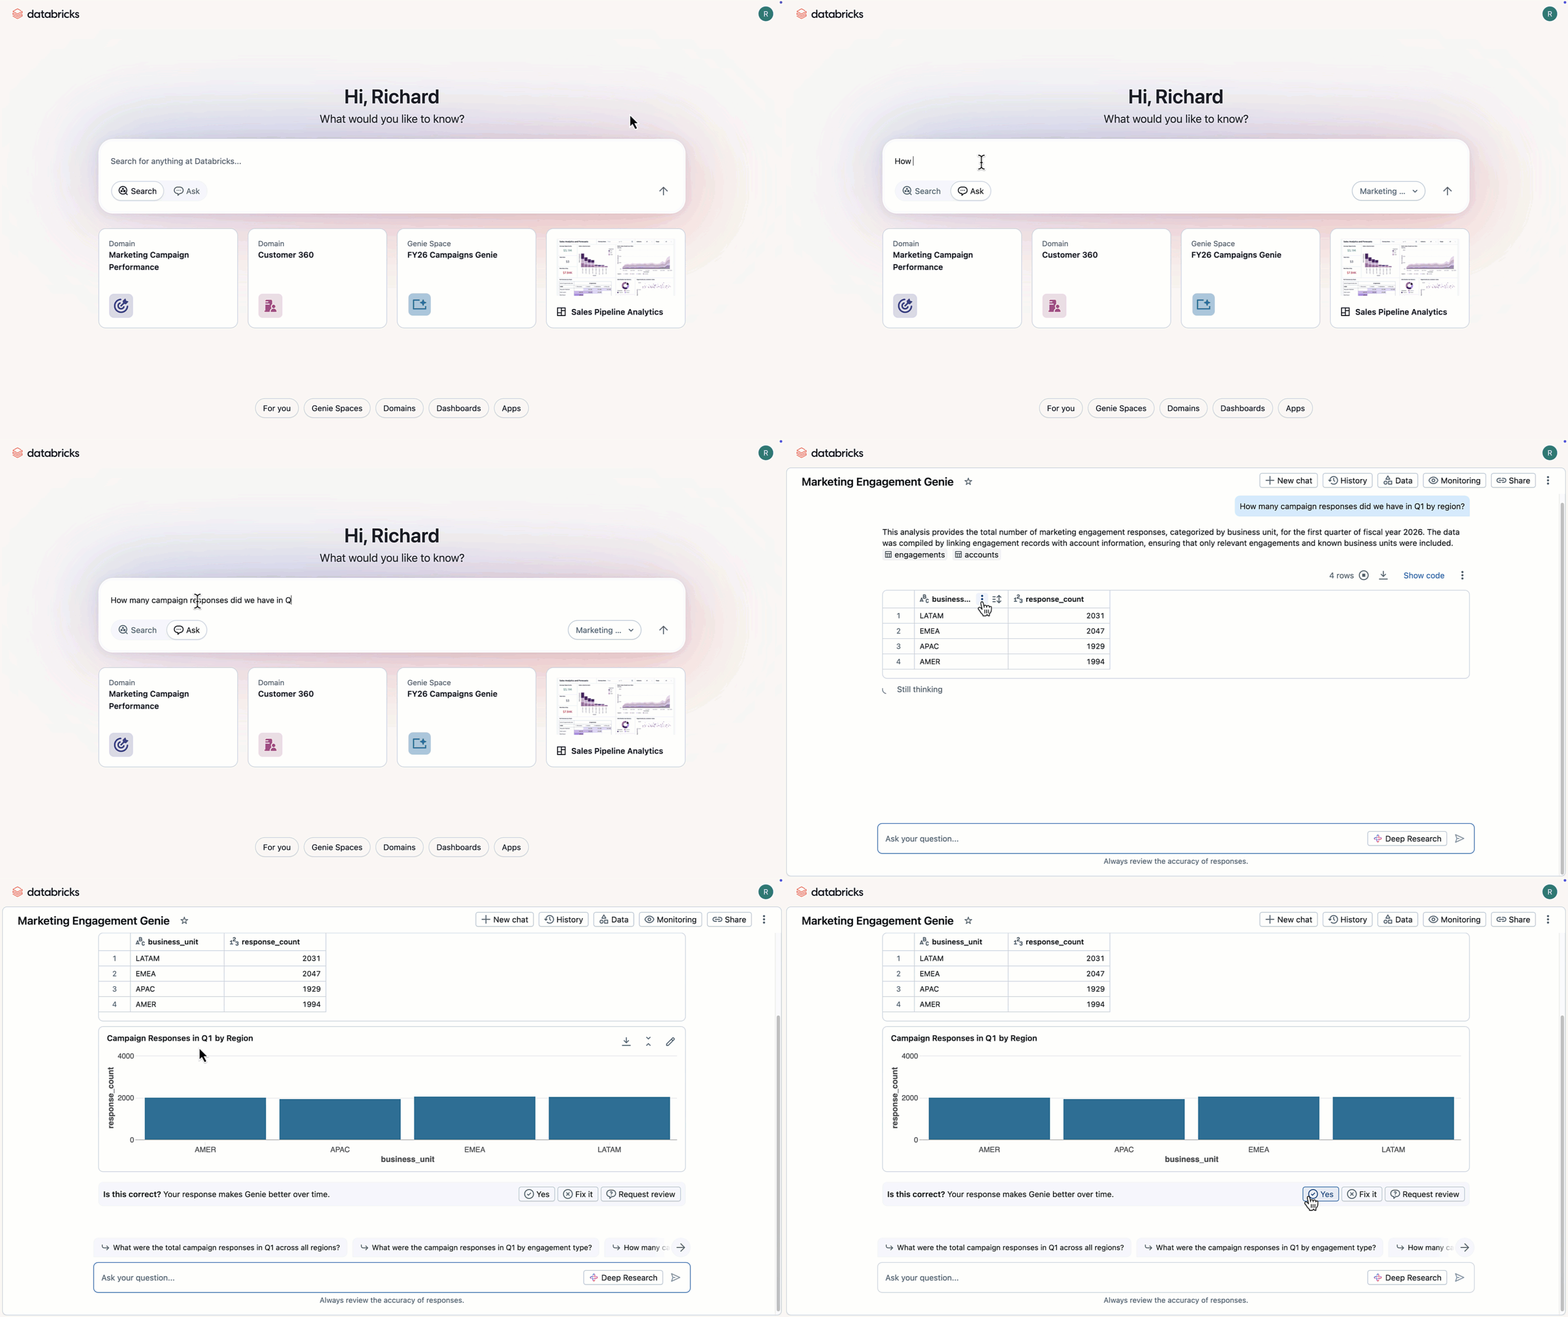
AI architecture: Genie translates natural-language questions into SQL against tables registered in Unity Catalog. Data teams curate each Genie space by choosing its tables, writing instructions, adding example SQL queries and defining trusted assets, and Unity Catalog metric views give Genie governed metric definitions to query. The generated SQL is visible with each answer, and space authors can run benchmark questions to measure accuracy before opening a space to business users.
Key differentiators:
- Lakehouse-native governance. Genie and AI/BI Dashboards read the same Unity Catalog permissions, lineage and metric views as every other Databricks workload, which spares the data team from copying data or re-creating access rules in a separate BI tool.
- Curated Genie spaces. Each space is scoped to a set of tables, instructions and example queries, which lets the data team tune accuracy for one domain (finance, sales operations) at a time.
- Benchmarks. Space authors can test Genie against known questions and expected answers, which gives a measurable accuracy check before rollout.
- No separate license. Databricks states that AI/BI carries no additional license fee, and usage is billed as standard Databricks compute (DBUs).
Limitations: AI/BI requires data registered in Unity Catalog, and while external sources can be federated, every query still runs on Databricks compute, which makes the tool a poor match for companies built on Snowflake, BigQuery or several warehouses. The dashboarding side is younger than Tableau or Power BI and offers fewer layout and formatting options. Accuracy depends heavily on how carefully each Genie space is curated, and compute costs grow with question volume because every answer runs a warehouse query.
Best fit: Companies that have standardized on Databricks and Unity Catalog and want conversational analytics without adding another vendor. Data teams willing to curate Genie spaces domain by domain.
5. Looker Gemini
Looker's Gemini integration brings Google's AI into the LookML-governed analytics experience. Google now positions Looker as an "Agentic BI" platform, with autonomous agents and embedded AI experiences alongside conversational querying.
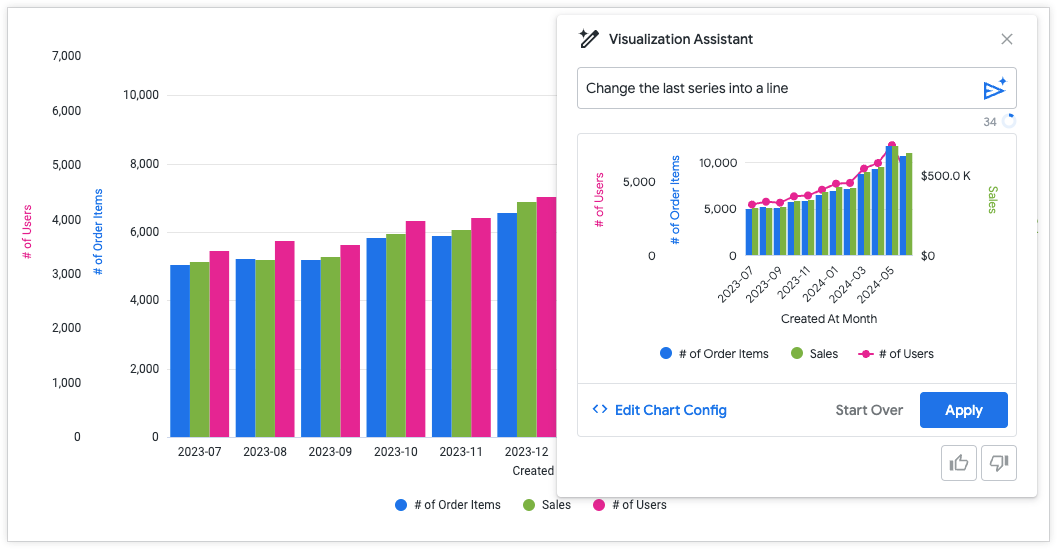
AI architecture: Gemini queries Looker's LookML semantic layer, one of the longest-established semantic modeling languages on the market, so AI-generated queries stay within governed metric definitions and hallucination risk drops. Since April 2026, Looker has added BI Agents, Dashboard Agents and Agentic Workflows that monitor metrics, find correlations and recommend actions.
Key differentiators:
- LookML-governed AI. Every AI query runs against the LookML model, which keeps AI answers consistent with existing dashboards and reuses the governance model that made Looker a standard for semantic-layer BI.
- Agentic BI. BI Agents (Preview) trigger downstream business actions grounded in the semantic layer, Dashboard Agents add conversational AI inside dashboards, and Agentic Workflows automate metric monitoring and suggest next steps.
- Developer productivity. Gemini generates LookML parameters and visualization configurations from natural language, and the VS Code extension includes a LookML AI agent for writing LookML projects with AI help.
- MCP support. An open-source MCP Toolbox and a managed MCP server native to Looker (Preview) connect Looker's data agents to external AI applications.
- Google Cloud ecosystem. Looker integrates natively with BigQuery and Looker Studio and carries Google Cloud's compliance certifications.
Limitations: Looker needs a dedicated data team to build and maintain LookML models. Enterprise contracts average about $150,000 a year, according to Vendr, although Gemini features are included at no extra fee through September 30, 2026. LookML projects can become file-heavy and dependent on specialists as they grow, and many of the agentic features (BI Agents, Dashboard Agents, MCP) are still in Preview.
Best fit: Large enterprises (500+ employees) with existing Looker deployments and LookML expertise. Organizations on Google Cloud. Teams that prioritize semantic governance and plan to adopt agentic BI workflows as they mature.
6. Sigma Computing
Sigma puts AI at the cloud data warehouse layer. Instead of building a separate semantic layer, it lets users call warehouse-native LLMs and build spreadsheet-style analyses with AI help.
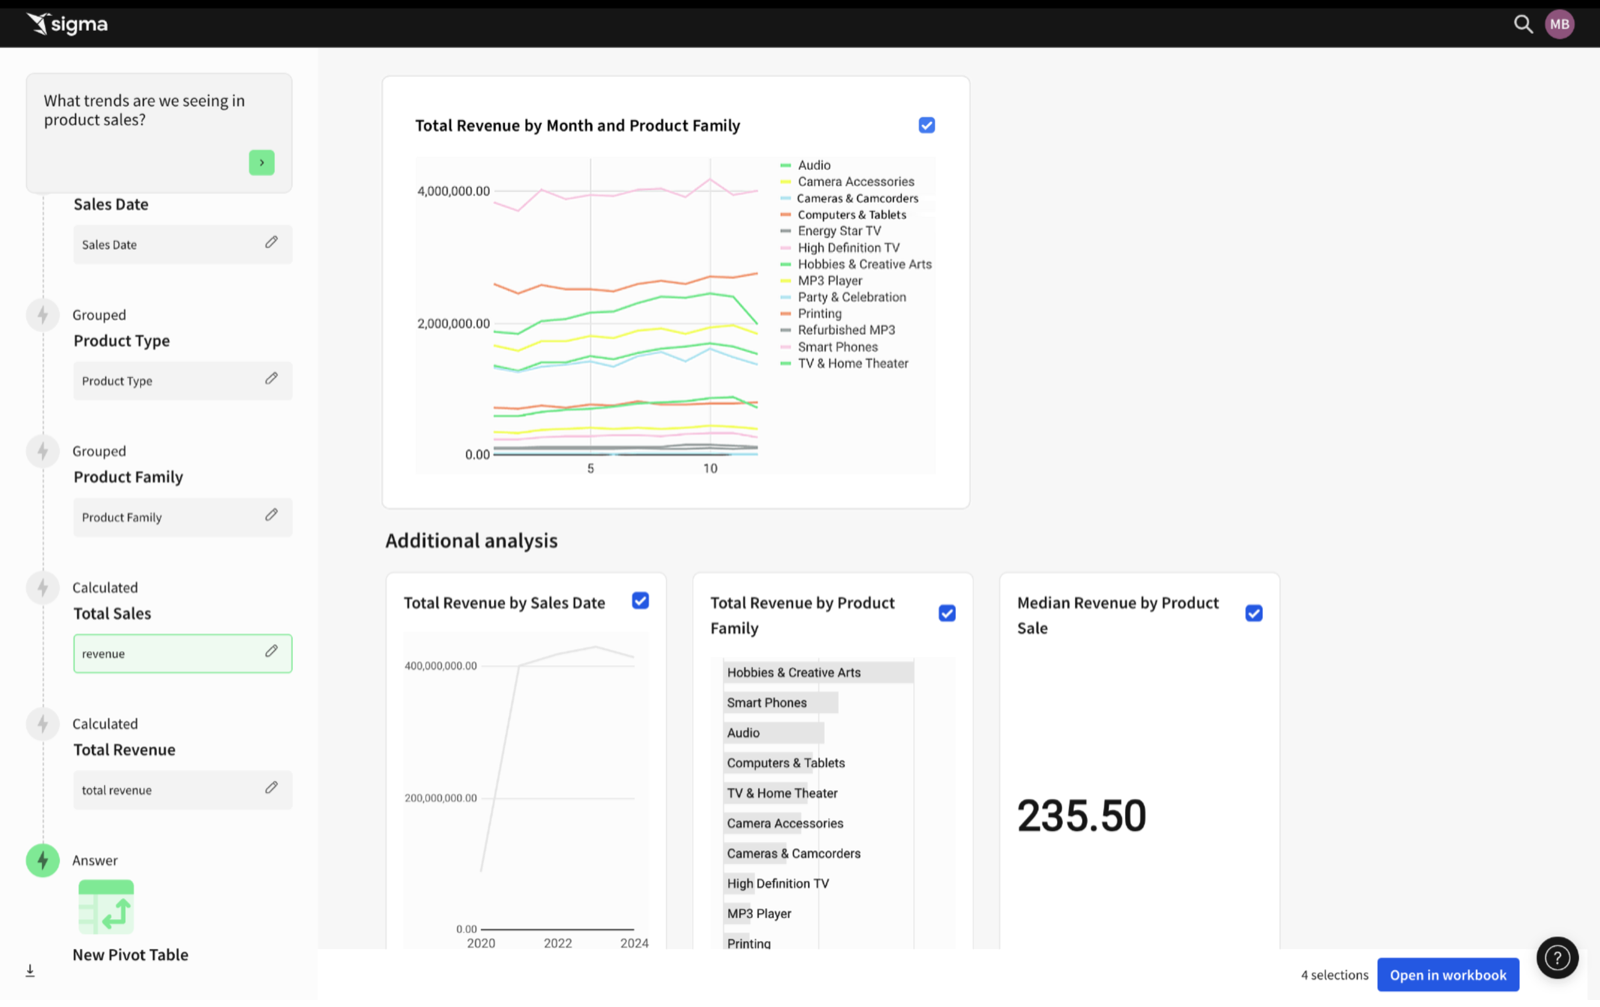
AI architecture: Users can call LLMs from Snowflake, Databricks, BigQuery and Redshift directly in Sigma through SQL functions. The AI has three parts: Sigma Assistant (formerly Ask Sigma) for natural-language questions and analysis, AI Query (December 2025) for calling warehouse-native LLMs in cells and workflows, and Sigma Agents (April 2026), which write data, call REST APIs, fire webhooks and work with external systems like Salesforce, Jira and Slack.
Key differentiators:
- Warehouse-native AI. Calling LLMs through the warehouse avoids moving data and inherits the warehouse's existing security and governance.
- Sigma Agents. Agents go past surfacing insights to writing data, calling APIs and working with external systems, so they act on data while Sigma's other AI features inform.
- Sigma Assistant. The assistant finds data sources and builds multi-step analyses, showing each step of its reasoning.
- MCP server support. Any AI assistant that supports MCP can search, describe and query data in Sigma.
- Spreadsheet-style interface. Business users work in an Excel-like environment with AI formula help, which shortens the learning curve.
Limitations: Sigma's AI depends on each warehouse's LLM offerings, so features vary by vendor. Without a traditional semantic layer, metric consistency relies on careful worksheet management, and the spreadsheet model that works well for individual analysis can create governance problems at scale.
Best fit: Organizations with strong warehouse investments (Snowflake, Databricks) that want AI without adding a separate semantic layer. Teams of spreadsheet-comfortable users who want AI-assisted analysis and workflows that connect analytics to action.
7. Tableau AI
Tableau's AI features sit under the Tableau AI umbrella: Tableau Agent for conversational analytics, Tableau Next as an agentic analytics platform and Tableau Pulse for AI-driven metric monitoring. Einstein Discovery still provides predictive analytics within the Salesforce ecosystem.
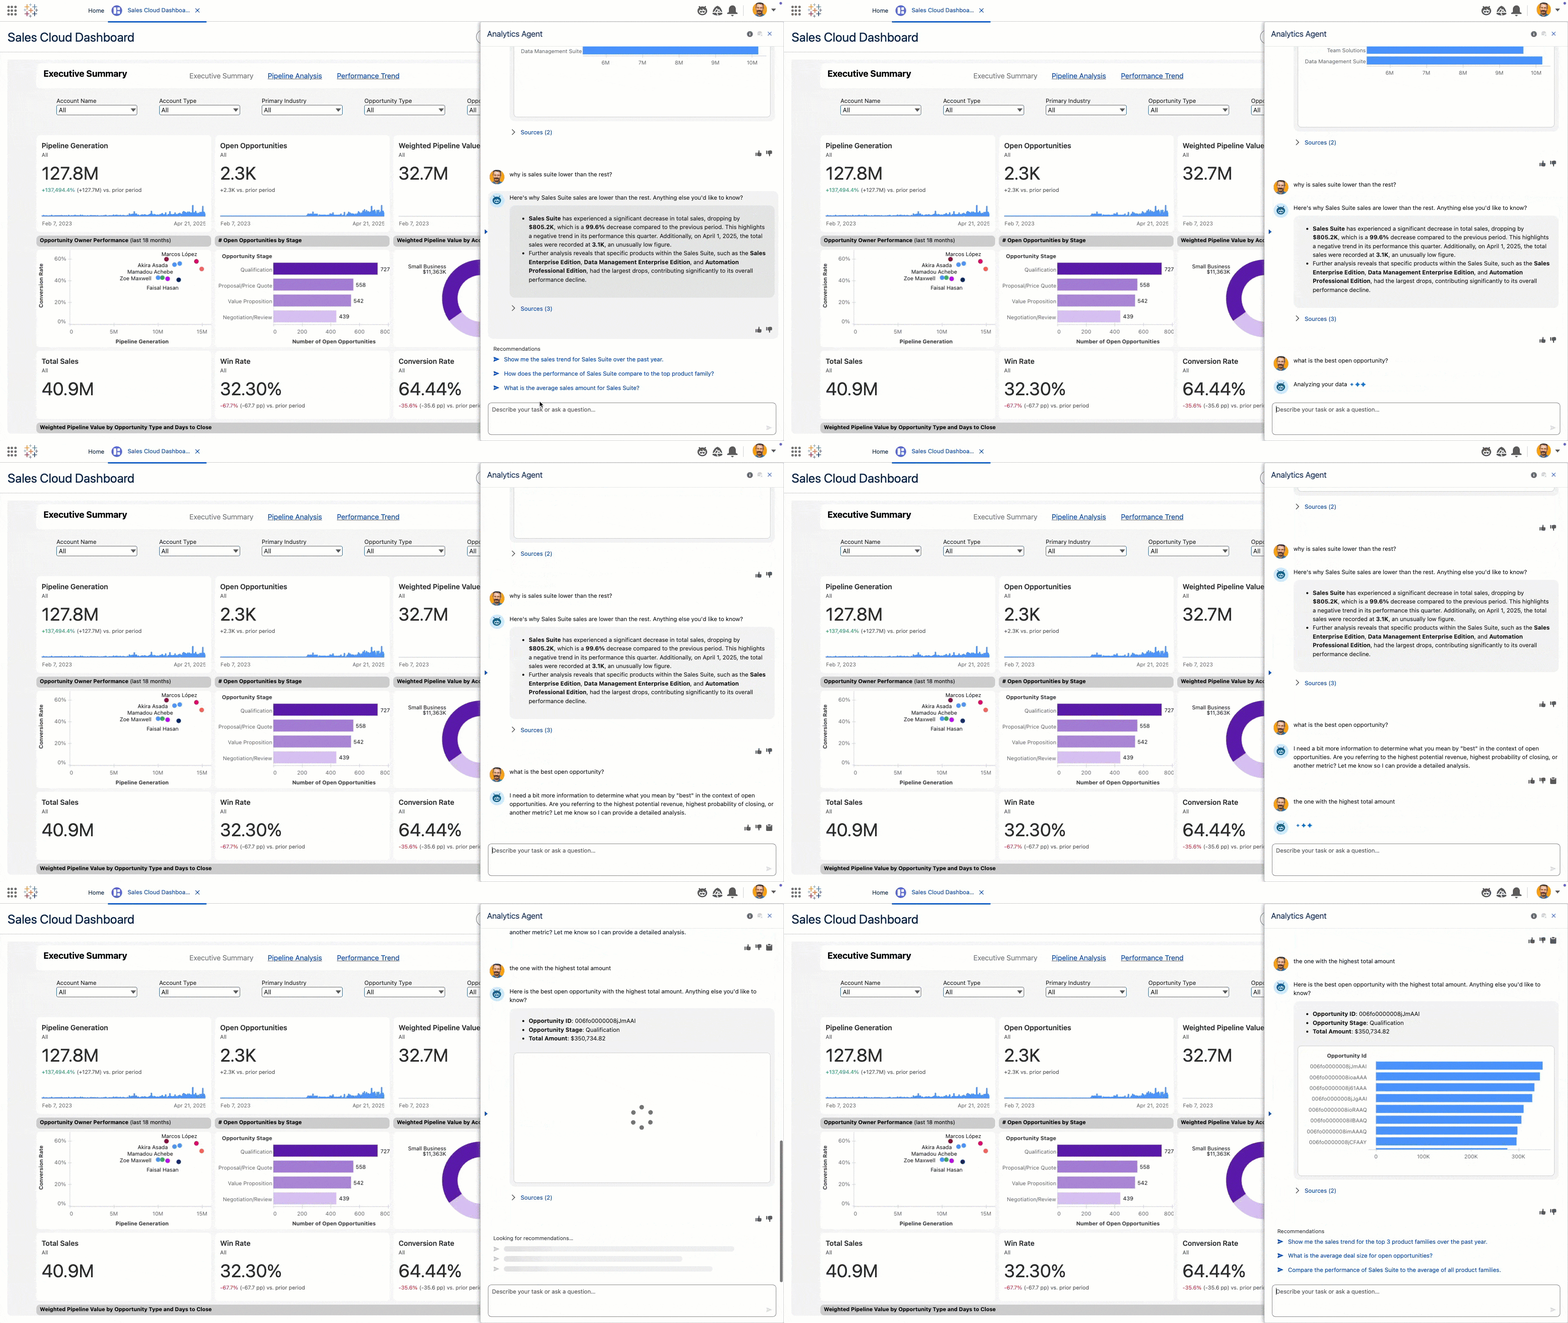
AI architecture: Tableau Agent (formerly Einstein Copilot for Tableau) is the main AI interface, supporting conversational exploration, calculation writing and visualization building. Tableau Next (GA 2026) is a separate agentic platform that can generate semantic models from workspaces and supports MCP (Model Context Protocol) for connecting external AI tools. Tableau Pulse writes metric summaries, pace-to-goal insights and anomaly alerts, and Einstein Discovery handles predictive modeling and driver analysis.
Key differentiators:
- Predictive analytics. Einstein Discovery provides forecasting, anomaly detection and driver analysis with explainable AI (XAI), which few other tools on this list offer built in.
- Tableau Agent. The conversational assistant handles data exploration, chart creation and multi-step analytical workflows, and it supports multiple languages as of the 2026.1 release.
- Tableau Next and MCP. Tableau Next adds generated semantic models, an "Analyze with AI" entry point for business users and MCP support for external AI tools.
- Tableau Pulse. Pulse monitors metrics and explains changes in natural language, replacing the retired Metrics feature.
- Visualization depth. Tableau offers the widest range of visualization and design options among the tools on this list.
- Free Desktop edition. Since March 2026, Tableau Desktop has a free edition with unlimited data connections, though it cannot publish to Tableau Cloud or Server.
Limitations: Tableau's semantic layer is thinner than Looker's or Holistics', and AI answers are less consistent when business logic lives in calculated fields scattered across workbooks instead of a central model. The portfolio (Agent, Next, Pulse, Einstein Discovery) is broad and can be confusing to navigate. Tableau Cloud is enterprise-priced, at $35 per user per month for Viewer, $70 for Explorer and $115 for Creator, billed annually, and Tableau Agent is billed separately.
Best fit: Organizations already in the Salesforce ecosystem. Teams whose main AI use cases are predictive analytics and visualization quality. Enterprises with dedicated Tableau developers who can keep data models consistent across the growing product portfolio.
8. Amazon Quick Sight
Amazon Quick Sight is the BI component of Amazon Quick Suite, the AWS workspace launched in October 2025 that also includes research, automation and chat agents. Quick Sight (formerly Amazon QuickSight) keeps the dashboards, SPICE in-memory engine and per-session reader pricing of the original product, and its generative BI features come through Amazon Q.
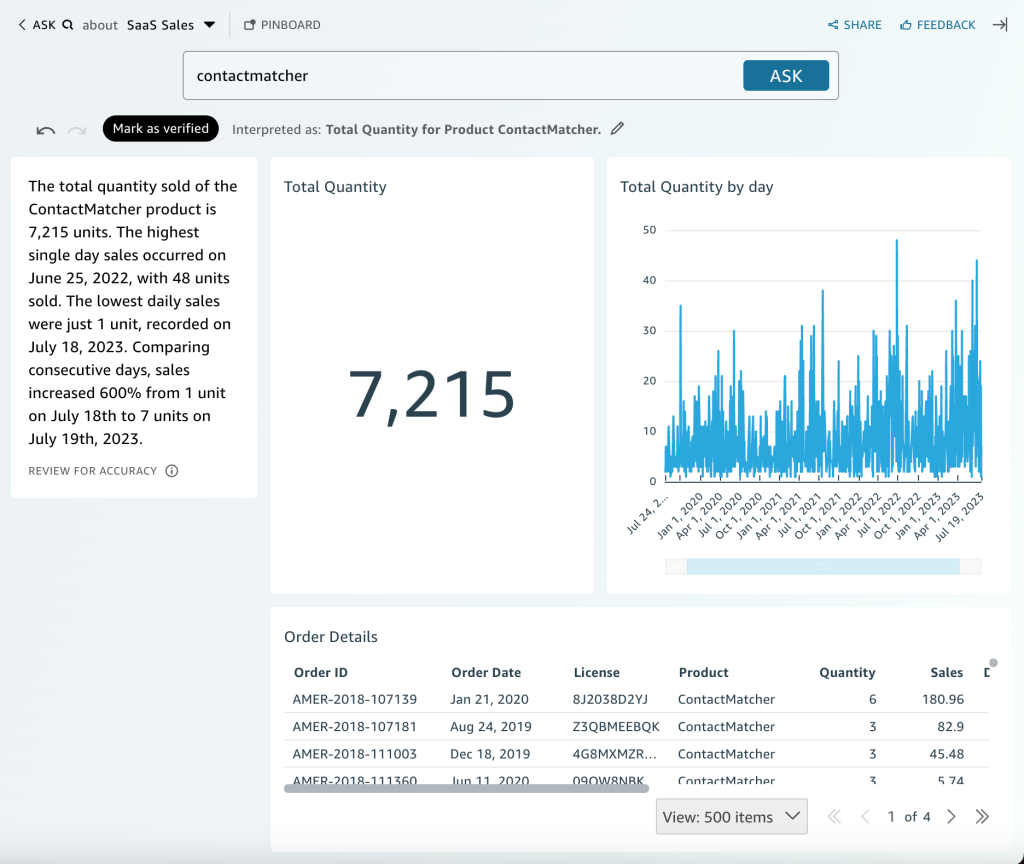
AI architecture: Amazon Q in Quick Sight answers natural-language questions, writes executive summaries of dashboards, generates data stories and helps authors build visuals and calculations from a prompt. Q relies on topics, which are curated datasets where authors define field names, synonyms, default aggregations and semantic types, so answer quality tracks how well each topic is configured.
Key differentiators:
- AWS integration. Quick Sight connects natively to Redshift, Athena, S3, RDS and Aurora and uses IAM-based access control, which keeps data and permissions inside the AWS account.
- Usage-shaped pricing. Readers can be billed per session, which suits large audiences that open dashboards occasionally, and embedded analytics capacity is sold in blocks of sessions.
- Data stories and summaries. Q turns a dashboard or a prompt into a narrative document with charts, which helps executives who read reports more than they explore data.
- Quick Suite agents. Quick Sight dashboards and topics are available to the wider Quick Suite chat agents and automation flows, which carries BI data into other workflows.
Limitations: The generative features require the Pro tiers (Author Pro at $40 and Reader Pro at $20 per user per month) plus an account-level fee of $250 per month, according to AWS's Quick Sight pricing page. Topics add a modeling step that sits apart from any semantic layer the data team already maintains, and the visualization and formatting options are narrower than Tableau or Power BI. Organizations outside AWS gain little from its integration advantages.
Best fit: AWS-first companies with many occasional dashboard viewers. SaaS teams embedding dashboards in AWS-hosted products.
9. Hex
Hex started as a collaborative notebook for SQL and Python and has grown into an AI analytics platform with agents for data teams and a conversational interface, Threads, for business users. The two halves share one workspace, so a question that starts with a business user can be picked up and finished by an analyst in the same project.
AI architecture: The Notebook Agent works inside a Hex project with access to its code, cells and warehouse tables, and it writes and edits SQL and Python as part of the analysis. Threads answers business users' questions in Hex, in Slack or through Hex's MCP server, and it prioritizes endorsed data and semantic models when it builds an answer. Hex has its own semantic models, can import definitions from external semantic layers such as dbt MetricFlow and Cube, and includes a Modeling Agent that turns logic from existing projects into semantic models.
Key differentiators:
- Auditable answers. Every Thread is backed by a Hex project that an analyst can open as a notebook, which shows exactly which queries and code produced an answer.
- Shared workspace for analysts and business users. Data teams build in notebooks and apps while business users ask questions in Threads, so both groups work from the same governed data and logic.
- Slack and MCP access. Business users can mention @Hex in Slack, and the MCP server exposes Hex answers to external AI tools.
- Endorsed data. Data teams mark trusted tables and semantic models, and the agents weigh endorsed sources first.
Limitations: Hex's roots are in code-first analysis, so its dashboarding and report layout options are lighter than those of traditional BI tools, and much of its value assumes analysts who write SQL or Python. The semantic modeling features are newer than LookML or other dedicated semantic layers, and governed self-service depends on the data team actively endorsing data and building models. Pricing is per editor seat, so costs rise as more people need to build analyses.
Best fit: Data teams that already work in SQL and Python notebooks and want to extend their analysis to business users through a conversational interface. Companies where analysts, data scientists and stakeholders collaborate on the same analysis.
10. Qlik
Qlik has grown from an AI offering centered on machine learning into an agentic analytics platform. The suite covers Qlik Answers for conversational analytics, Qlik Predict (formerly Qlik AutoML) for automated machine learning and a growing set of specialized AI agents.
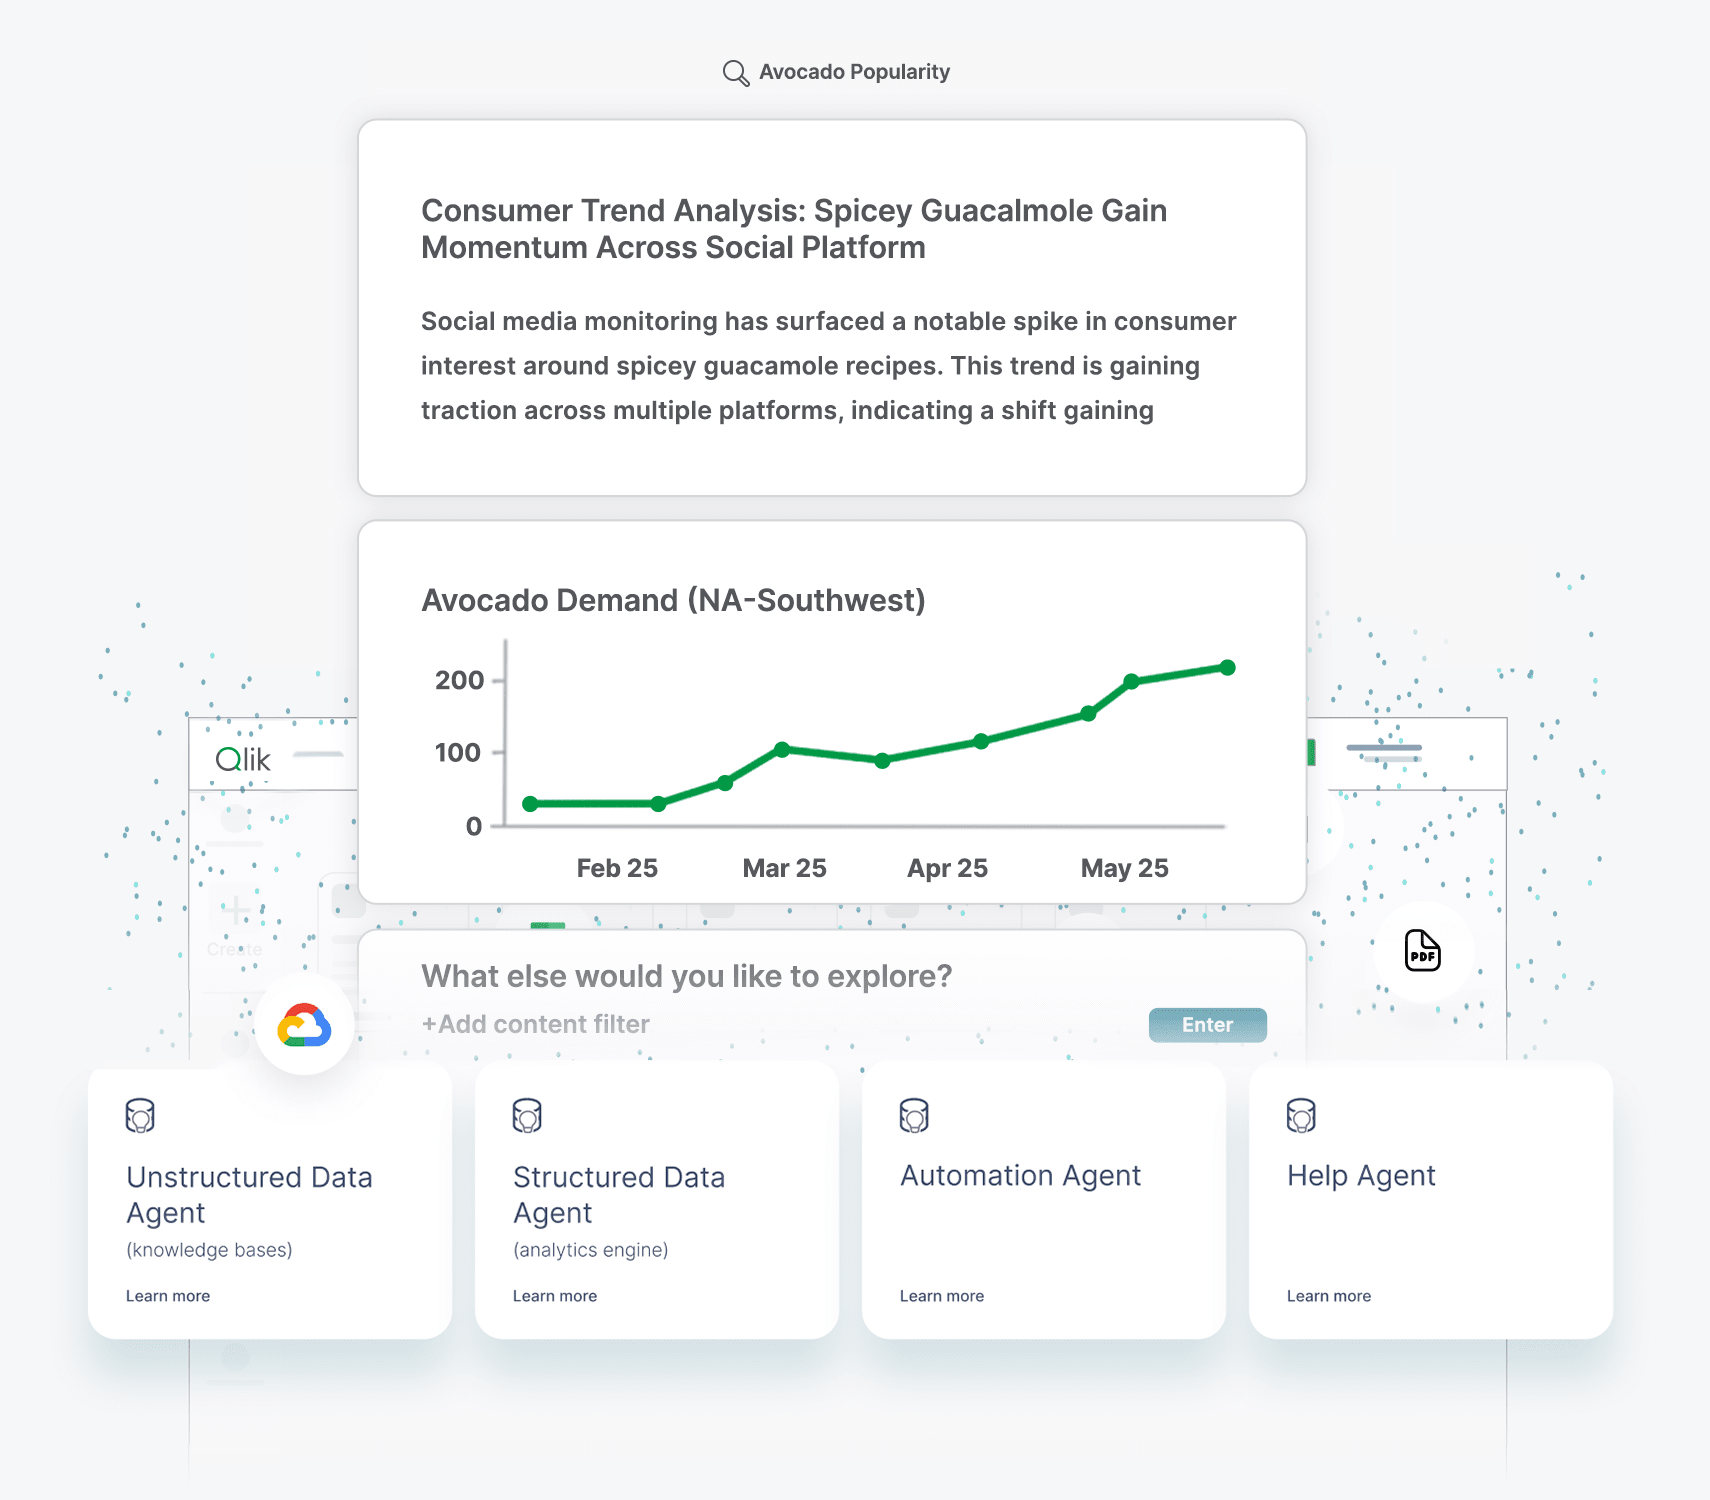
AI architecture: Qlik Answers (GA February 2026) is the conversational entry point, and it combines structured and unstructured data to answer questions in natural language. Qlik Predict covers the machine learning lifecycle, from model generation to prediction and what-if planning, on top of Qlik's Associative Engine. At Qlik Connect 2026, Qlik announced four specialized agents: Discovery Agent for anomaly detection, Predict Agent for building models through natural language, Automate Agent for workflow automation and Analytics Agent for extended analytics.
Key differentiators:
- Qlik Answers. The conversational analytics product queries both structured analytics data and unstructured content, adding the conversational layer that Qlik's earlier, ML-focused AI lacked.
- AI agent suite. Discovery Agent watches metrics and surfaces anomalies in a feed (GA March 2026), Predict Agent lets analysts build ML models through natural language, and Automate Agent triggers workflows from AI insights.
- No-code ML. Qlik Predict offers code-free model generation, prediction and scenario planning, with record-level explainable AI (XAI).
- Qlik Trust Score. A data quality indicator, launched in July 2025, shows users how trustworthy the data behind each agentic answer is.
- MCP server. Launched in February 2026, it lets any modern LLM connect to Qlik's analytics and data.
- Associative Engine. Qlik's associative data model supports real-time what-if exploration.
Limitations: Qlik has a steeper learning curve than newer tools. Qlik Answers and the agent suite arrived in 2026, so their maturity against longer-established conversational tools such as ThoughtSpot Spotter is still unproven. Pricing follows an enterprise SaaS model.
Best fit: Organizations that want conversational analytics and machine learning in one platform. Teams focused on predictive analytics, scenario planning and agentic workflows across structured and unstructured data.
11. Zenlytic ZOE
Zenlytic ZOE is an AI data analyst built on the Zenlytic Cognitive Layer, a governed model of metrics and dimensions. ZOE queries this layer for consistent results and can run Python in a sandbox when a question needs more than a BI query.
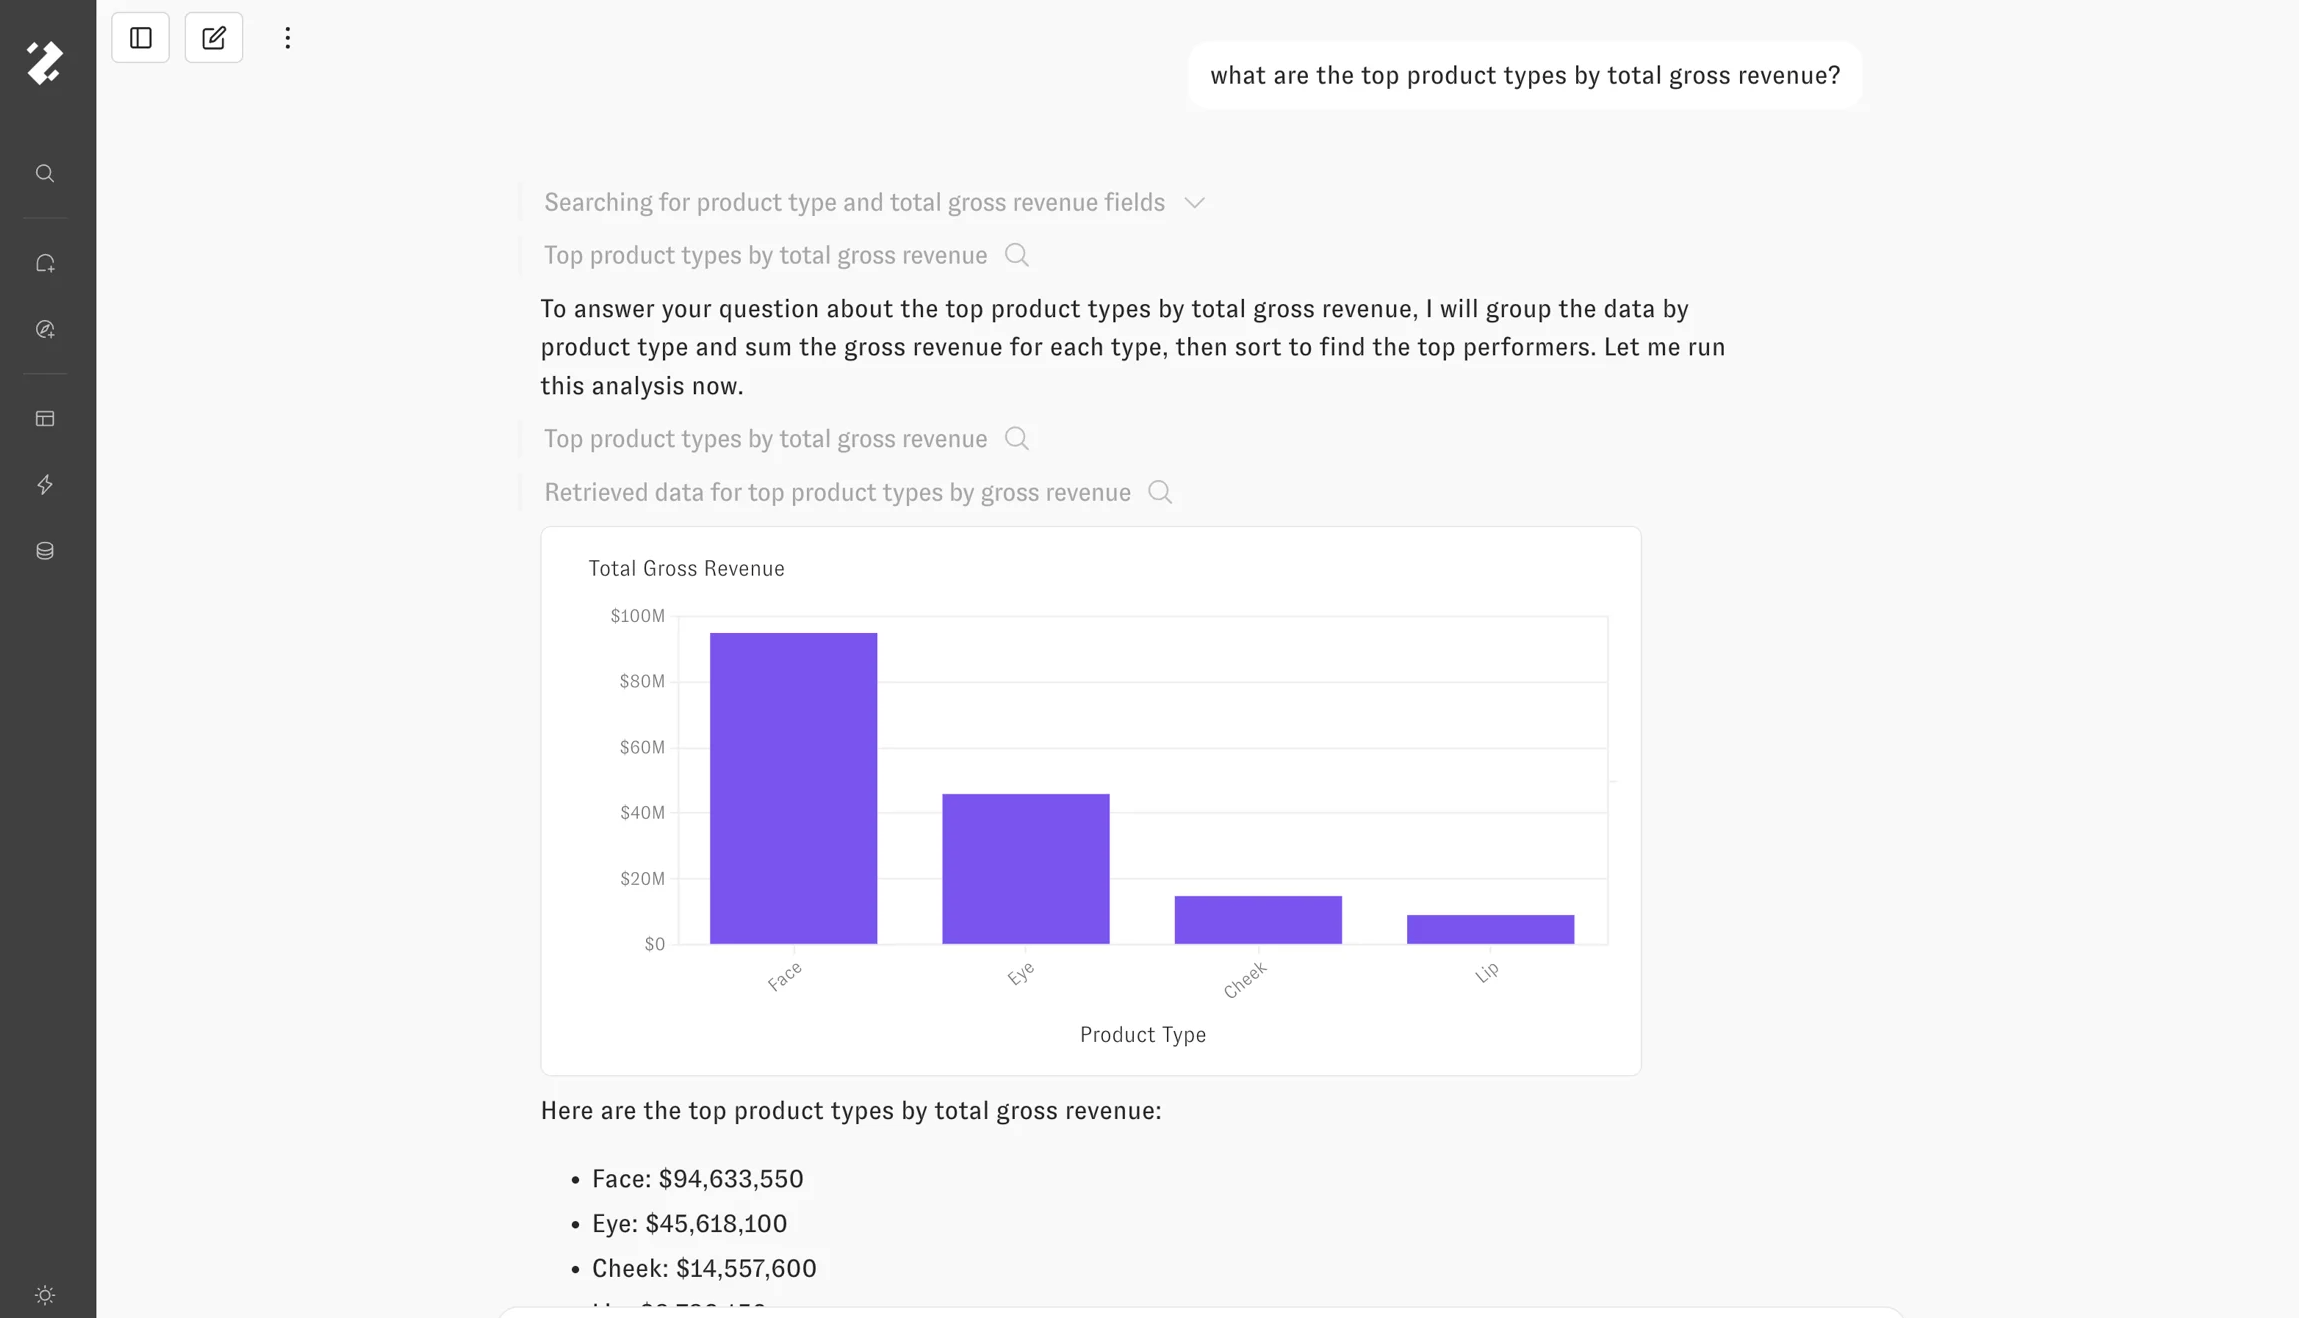
AI architecture: ZOE queries governed measures and dimensions in the Cognitive Layer instead of translating text directly into SQL, which keeps metrics consistent. For analyses that go beyond standard BI queries, it runs Python in a sandboxed environment. Patterns, launched in February 2026, lets ZOE learn from Snowflake query history in a single sync instead of through lengthy manual configuration.
Key differentiators:
- Cognitive Layer querying. Like Holistics AI and Looker Gemini, ZOE queries a governed semantic model instead of raw tables, which gives more consistent results than text-to-SQL.
- Patterns. ZOE ingests past queries and dashboards to learn the organization's analytical patterns, which shortens setup compared with manual configuration (February 2026).
- Artifacts. AI-generated documents, such as presentations, financial models and data apps, refresh as the underlying data changes (March 2026).
- Python sandbox. ZOE runs Python on governed query results for statistical analysis, custom calculations and data manipulation.
- Web Search. ZOE can combine real-time web context with private company data, without direct HTML parsing and with zero-day retention (April 2026).
- Personal Fields. Users create personal metrics and dimensions that can be promoted to the global model through a review process.
Limitations: Zenlytic is a small vendor (about 20 employees and $14.4M in total funding), with a smaller community and ecosystem than larger platforms. The Cognitive Layer needs setup and maintenance, though Patterns reduces the work, and review-site coverage is still thin compared with enterprise incumbents.
Best fit: Mid-market teams that want governed AI analytics with Python for deeper analysis. Organizations that want a review process for promoting business users' metrics into the shared model.
12. Domo
Domo is an all-in-one cloud data platform that covers data connectors, ETL, dashboards and apps, and its AI features now include AI Chat, an agent builder and an MCP server. The breadth means a company can run ingestion, transformation and reporting with one vendor, and the AI layer can act on all of it.
AI architecture: Domo's AI Library manages the models, agents and AI Toolkits used across the platform, with access to DomoGPT and to third-party models including Anthropic's. AI Chat answers questions across multiple DataSets and holds longer conversations for deeper analysis. The agent builder (launched March 2026) lets teams create conversational agents with defined roles, or goal-driven agents that run a series of tasks on demand or when an event fires, and the Domo MCP Server lets external AI assistants build cards and trigger workflows inside Domo.
Key differentiators:
- Full data stack in one platform. Domo bundles prebuilt connectors, Magic ETL for visual transformation and app building, so the AI works on data that Domo itself ingests and prepares.
- Agents that act. Domo agents can trigger workflows and move processes forward, which ties analysis to operational steps.
- Domo MCP Server. Assistants such as Claude can take actions inside Domo, from building a card to starting a workflow.
- Central AI management. The AI Library gives administrators one place to control which models, agents and toolkits are available and to whom.
Limitations: Domo's business logic is spread across DataSets, Magic ETL flows and Beast Mode calculated fields instead of a single code-defined semantic model, so AI answers can drift when the same metric is defined in several places. Pricing is consumption-based with credits, which makes costs harder to forecast as AI and query usage grows. Teams that already run a separate warehouse and transformation stack end up paying for platform features they may not use.
Best fit: Mid-size and enterprise companies that want one vendor for connectors, transformation, dashboards and AI agents. Business teams that want automation tied directly to their reports.
13. Luzmo IQ
Luzmo IQ is built for embedding AI analytics in software products. Instead of standalone BI dashboards, Luzmo gives SaaS companies AI chat, search and executive summaries that run inside their own applications.
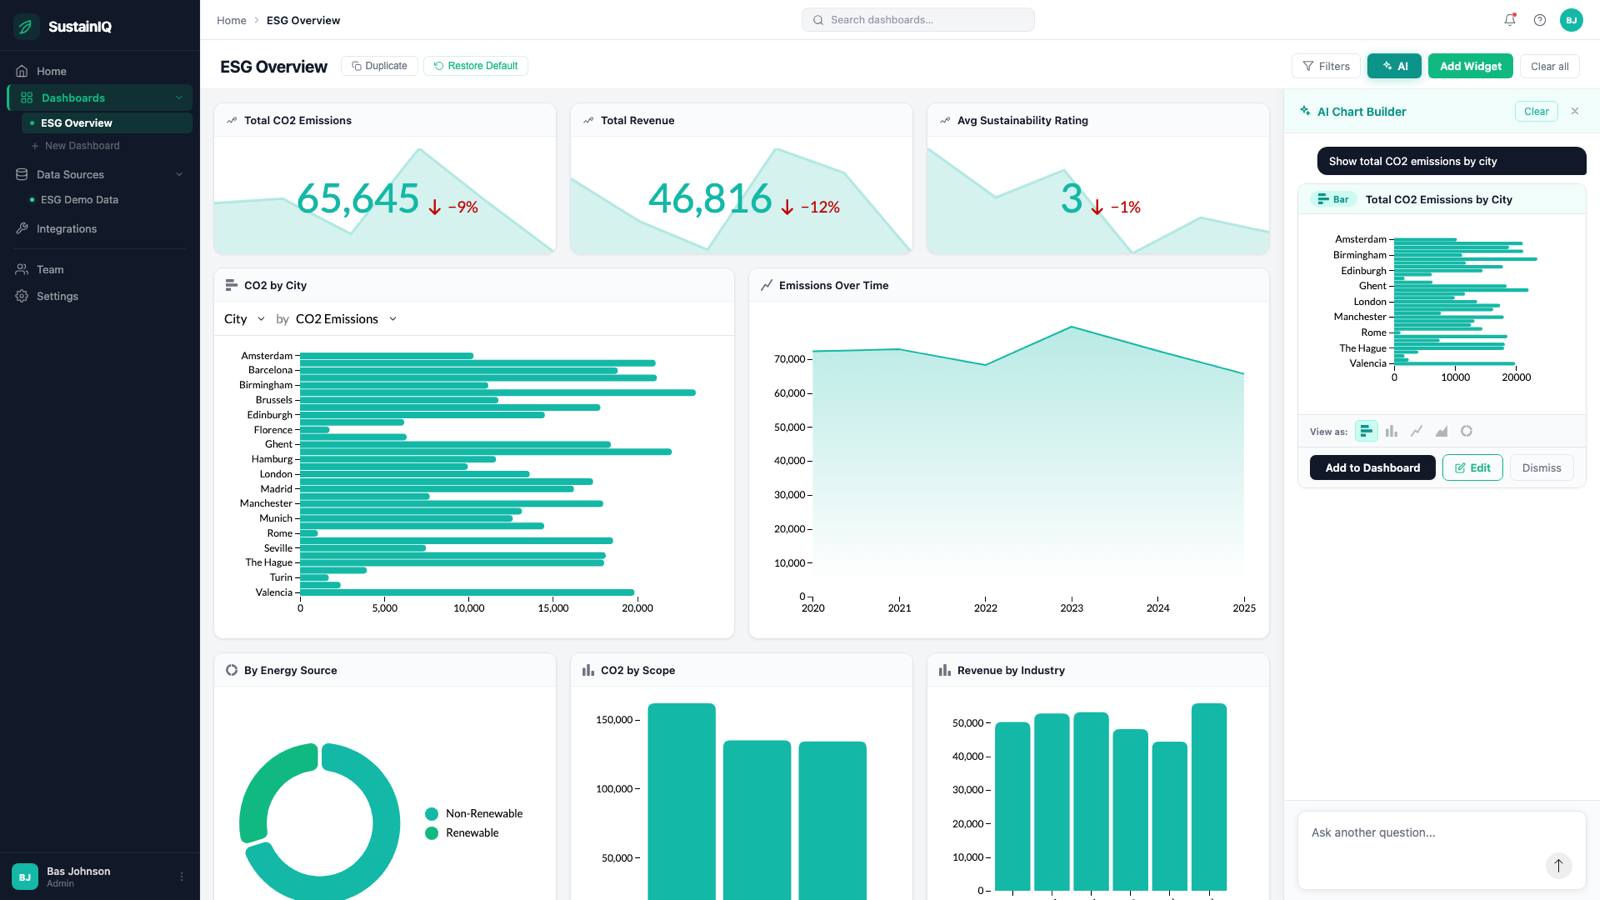
AI architecture: Luzmo IQ V3 (April 2026) uses a hybrid workflow that combines agentic and deterministic steps for more predictable results. It supports several LLM providers, including OpenAI (GPT-4, GPT-4o, o1), Anthropic (Claude 3.5 Sonnet and Haiku), Meta (Llama 3.2), Google Gemini, Mistral and Cohere, and customers can choose and configure models per tenant. The wider Luzmo AI suite includes Creator Agents for product teams (metadata, visualization and logic), Agent APIs for developers and Analyst Agents (conversation and summary) for end users.
Key differentiators:
- Embedded-first AI. Luzmo is built for SaaS companies that embed analytics in their products, with ready-made chat interfaces, executive summaries and search widgets.
- Multi-LLM support. Product teams choose the model provider and steer AI behavior per tenant, which gives control over cost, performance and data residency.
- Composable Analytics. An embeddable web component library (10 components at its April 2026 launch) inherits the host product's CSS variables.
- Accuracy gains. According to Luzmo, IQ V3 improved text-answer accuracy by 7% and chart-answer accuracy by 20% over the previous version.
- Agent APIs. Metadata, Discovery, Visualization, Formula, Chat and Chat History APIs support custom integrations.
Limitations: Luzmo IQ serves embedded use cases only, and its semantic modeling is thinner than that of dedicated BI platforms, so AI accuracy depends on how well the data model is configured in Luzmo. Luzmo IQ is an add-on on top of the base plans (Starter at EUR 495 per month, Premium at EUR 1,995 per month).
Best fit: SaaS companies building customer-facing analytics with AI-powered exploration. Product teams that want embeddable AI analytics components with a choice of models rather than a standalone BI platform.
14. Julius AI
Julius AI is a data assistant that combines natural language, code generation (Python, R and SQL) and statistical analysis in one chat interface. It markets itself as "AI for your workplace tasks," and it also handles slide decks, Excel files and general productivity work.
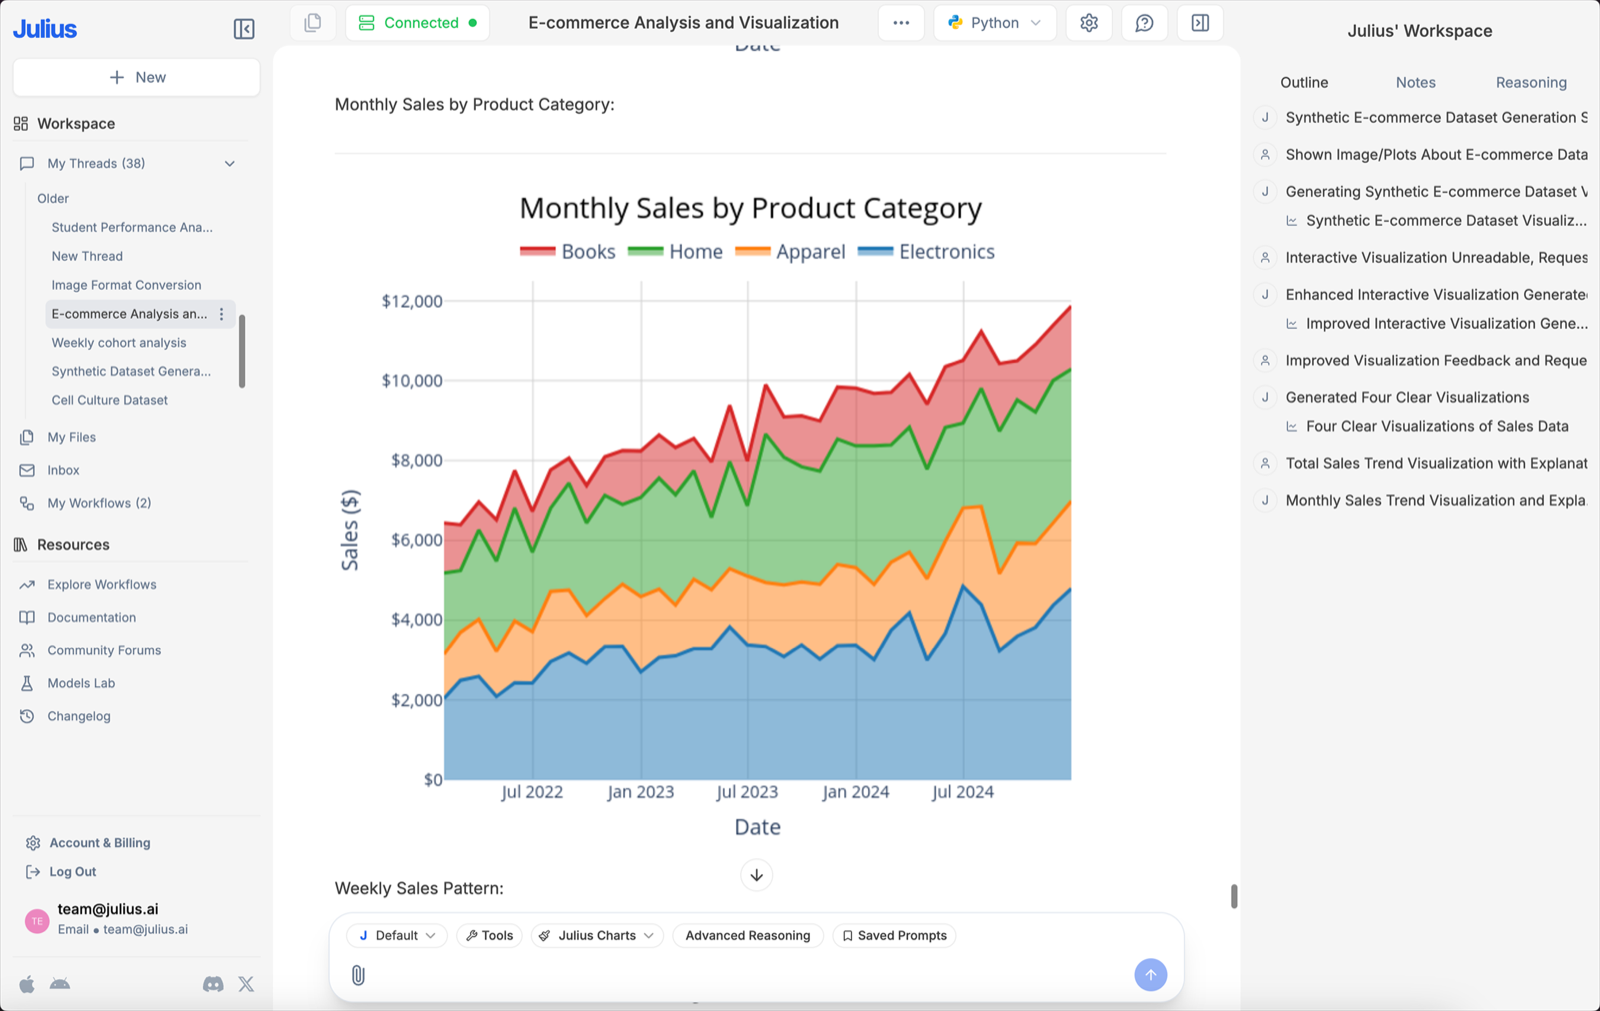
AI architecture: Julius uses several LLMs (GPT-4.1, o4-mini and Claude) and writes Python, R or SQL to analyze data, with no semantic layer in between. Users upload files, connect sources such as Snowflake, BigQuery, Postgres and Google Drive, or link services such as Meta Ads, and the AI works directly on that data. Cross-chat memory carries context from one conversation to the next.
Key differentiators:
- Statistical depth. Julius runs t-tests, chi-square, ANOVA, PCA and forecasting, which most BI tools lack natively.
- Multi-LLM approach. Julius routes each analytical task to the model it judges best suited to it.
- Data connectors. Native connections to Snowflake, BigQuery, Postgres, Google Drive and Meta Ads extend the original upload-only model.
- Teams and Custom Agents. Pro users can form teams of up to 10 people and build Custom Agents over specific data and knowledge bases, and the Julius Slack Agent lets teams query data from Slack.
- Scheduled runs. Analyses run daily or weekly and deliver results automatically.
- Documents and slides. Julius summarizes PDFs, parses unstructured data and generates slide decks alongside structured analysis.
Limitations: Julius has no semantic layer, metric governance or multi-user consistency controls, so two users who phrase the same question differently can get different answers. There is no version control, row-level security or dashboard management, and the newer collaboration features (Teams, Slack Agent) leave that governance gap in place.
Best fit: Individual analysts and researchers who need quick statistical analysis and data exploration. Teams that want a low-friction start with AI-assisted analysis, including academic work, ad-hoc investigations and prototypes. Organizations that need governed BI are better served by other tools on this list.
15. Polymer
Polymer is a lightweight AI BI tool that turns spreadsheets and marketing, ecommerce and sales data into interactive dashboards, aimed at small teams without a dedicated analyst. A user connects a source, and PolyAI generates a starter dashboard and answers questions about the data in chat.
AI architecture: Polymer reads data from file uploads, Google Sheets and connectors such as Google Ads, Meta Ads and Shopify, and PolyAI generates boards, insights and explanations from the connected data. The product has no semantic layer, so metrics are defined board by board and the AI works from the column names and data types of each source.
Key differentiators:
- AI-generated dashboards. PolyAI builds a first dashboard from a new data source, which gives non-technical users a starting point within minutes.
- Low entry price. Plans start at $10 per month, and yearly billing halves the monthly price, according to Polymer's pricing page.
- Marketing and ecommerce connectors. Built-in connectors for ad platforms and Shopify cover the most common data sources of small marketing and ecommerce teams.
Limitations: PolyAI chat responses are capped by plan (10 on Starter, 20 on Pro and 30 on Teams, per the pricing page), and the Basic plan includes no AI chat. Polymer has no semantic layer, version control or row-level governance, so it suits small teams better than organizations that need consistent metrics across departments, and complex multi-step analysis is out of its scope.
Best fit: Small marketing, ecommerce and agency teams that work from spreadsheets and ad platforms and want AI-generated dashboards without SQL or a data team.
Frequently asked questions
How do I compare usage-based pricing for the top AI-driven BI platforms that suit a mid-sized analytics team?
For a mid-sized analytics team (say 5–25 builders + 50–500 consumers) prioritizing AI-driven capabilities, usage-based pricing can be flexible, especially for lots of viewers, but you’ll want to model who pays by seat vs what’s metered (sessions/queries/credits/compute) to avoid surprise bills. Top platforms to compare include Holistics, ThoughtSpot, Sigma Computing, Tableau AI and Amazon Quick Sight.
Two AI-specific pricing questions to add to every comparison
1. Holistics (Best for AI-first Self-Service Analytics)
Holistics uses a feature-tiered platform with user-based add-ons, so you can keep costs predictable and scale seats only where needed.
ThoughtSpot centers on natural language search and automated insights, and commonly pushes consumption-style pricing.
3. Amazon Quick Sight (Best for AWS Ecosystem)
Quick Sight is one of the clearest “usage-shaped” options, especially for large reader populations.
Two AI-specific pricing questions to add to every comparison
- Are AI features included, or metered separately (credits, add-on, premium edition)?
- Can you restrict AI usage to certain roles (e.g., builders only vs all viewers)?
1. Holistics (Best for AI-first Self-Service Analytics)
Holistics uses a feature-tiered platform with user-based add-ons, so you can keep costs predictable and scale seats only where needed.
- Pricing structure: Platform tiers + user-based add-ons (to control cost by role/need).
- Usage options: Custom query-based plans are available for high-usage teams.
- Best for: Teams that want tighter cost control than pure consumption pricing, with an upgrade path when query volume gets large.
ThoughtSpot centers on natural language search and automated insights, and commonly pushes consumption-style pricing.
- Pricing structure: Mix of user-based + usage credits
- Usage factors: Query volume, complexity, and peak usage drive credit burn.
- Best for: Teams wanting fast, search-based answers with heavy self-serve exploration.
3. Amazon Quick Sight (Best for AWS Ecosystem)
Quick Sight is one of the clearest “usage-shaped” options, especially for large reader populations.
- Pricing structure: Authors by license; Readers can be pay-per-session (with a monthly cap).
- Usage factors: Active session counts + SPICE usage (if you use it).
- Best for: AWS-first teams with fluctuating consumption and lots of occasional viewers.
Which AI-enabled BI tools offer collaborative commenting and version history out of the box?
Tools with built-in commenting:
- Power BI offers native, in-context commenting on dashboards, reports, and individual visuals.
- Tableau supports annotations and comments on dashboards and reports via Tableau Server or Tableau Cloud.
- Holistics provides Git-native version control for models and dashboards, enabling full change history and collaboration through standard Git workflows.
- Tableau includes proprietary workbook revision history within Tableau Server and Tableau Cloud.
Which AI Analytics platforms integrate smoothly with Snowflake and let business teams (ops, marketing, finance) build drag-and-drop dashboards?
Most of the AI Analytics tools in this guide connect to Snowflake; the exception is Databricks AI/BI, which runs every query on Databricks compute. Among them, the ones that offer drag-and-drop dashboard building (well-suited for ops/marketing teams) include Holistics, Looker, and Lightdash.