Best Embedded BI Platforms: A Fact-based Comparison Guide
The concise guide to evaluating embedded BI tools.
LAST UPDATED June 16, 2026
AUTHOR  Holistics Team
Most embedded analytics guides exist to game search engines. Not this one. Here's a fact-based, methodical breakdown of embedded BI tools you can actually use.
Our approach:
- Facts are prioritized over opinions, no recommendations pushed
- Details are backed by official documentation
- High-level criteria are broken down into specific, measurable sub-points
- Findings are presented in in clear, comparable tables
- Linking to real-world discussions from actual users
New to embedded analytics? Start with our embedded BI guide for a comprehensive introduction, or jump to embedded analytics pricing if you're already evaluating vendors.
The embedded analytics platforms compared in this document are: Holistics, Looker, Tableau, Power BI, Embeddable, Metabase, Domo, Sisense, Sigma Computing, Luzmo, Reveal BI.
We understand we might come across as biased, since we're also a vendor selling embedded analytics. Rather than claiming neutrality, we'll let the content below speak for itself.
Found an inaccuracy or want your tool added? Use this form.
Want to create your own comparison sheet to collaborate with your team? Get the Google Sheet version here.
How do embedded BI tools compare?
Scroll to the right to see more
| Dimension | | | |  Power BI Power BI |  Embeddable Embeddable | |  Domo Domo |  Sisense Sisense | |  Luzmo Luzmo |  Reveal BI Reveal BI |
|---|---|---|---|---|---|---|---|---|---|---|---|
| Demo Playground | |||||||||||
| | ❌ | Available | Available | ❌ | ❌ | ❌ | Available | Available | ❌ | ❌ | |
| Pricing Structure for Embedded Analytics Pricing is among the most important factors to consider when evaluating BI tools. A good embedded pricing should be easy to start when doing POC, as well as not be too expensive when you scale up. Typically, embedded analytics tools have a pricing structure that scales with the number of embedded viewers or the usage of your application. Common pricing structures are:
| |||||||||||
| | Query runs/Query slots Select between Query Runs or Concurrent Workers. With unlimited dashboard viewers. source | API calls One production instance, 10 Standard Users, 2 Developer Users, upgrades, up to 500,000 query-based API calls per month, and up to 100,000 administrative API calls per month. source | Analytical Impressions Pay for entitlements of Analytical Impressions. Applies to users with the Viewer role. source | Node Type & Node Instances Pricing based on node types and node instances. To publish content to an embedded capacity, at least one user requires a Power BI Pro license. source | Feature-tiered Flat-price monthly/annual subscription. Price on request. | Feature-tiered Full-powered embedding starts from Pro plan ($500/mo). source | Usage-based pricing Domo uses a credit-based pricing model based on data rows, executions, and platform activities. source | Not Available Sisense pricing isn't public and depends on use case and budget; contact Sisense for a tailored quote. |  Pricing isn't publicly available, but discussions on Reddit suggest it's based on a platform fee and user licenses. | MAV & MAD For the Pro Plan (USD 2,050/month), you get 500 Monthly Active Viewers (MAV) and 5 Monthly Active Designers (MAD). source | Not Available Not publicly available, but appears to follow an SDK flat-rate model. source |
| | $9,600+/year Starting at $800 per month for the standard plans. Contact sales for detailed embedded pricing. source | Not Available No pricing estimate available. Contact sales for a custom quote. source | $9,000+/year Power BI Embedded starts at $735.91/month for an A1 node (1 vCore) and increases with node type and count. source | Not Available No pricing estimate available. Contact sales for a custom quote. | $6,000+/year Embedded analytics is available in the Pro Plan ($500/month + $10/user). source | Not Available Vendr data shows Domo costs ~$134K/year on average. Requires speaking to sales for embedded pricing. source | Not Available Requires speaking to sales for embedded pricing. Vendr data shows standard Sisense costs ~$136K/year on average. source | Not Available Requires speaking to sales for embedded quote. Vendr data shows Sigma standard plans costs ~$57K/year on average. source | $11,940+/year The Basic plan starts at $995/month for 100 Monthly Active Viewers (MAV) and 1 Monthly Active Designer (MAD). source | Not Available Requires talking to Sales. | |
| Embedding Methods Embedding methods affect the customizability of your embedded apps. Typically with higher customization, the tradeoff is higher development effort. Common embedding methods are:
| |||||||||||
| | 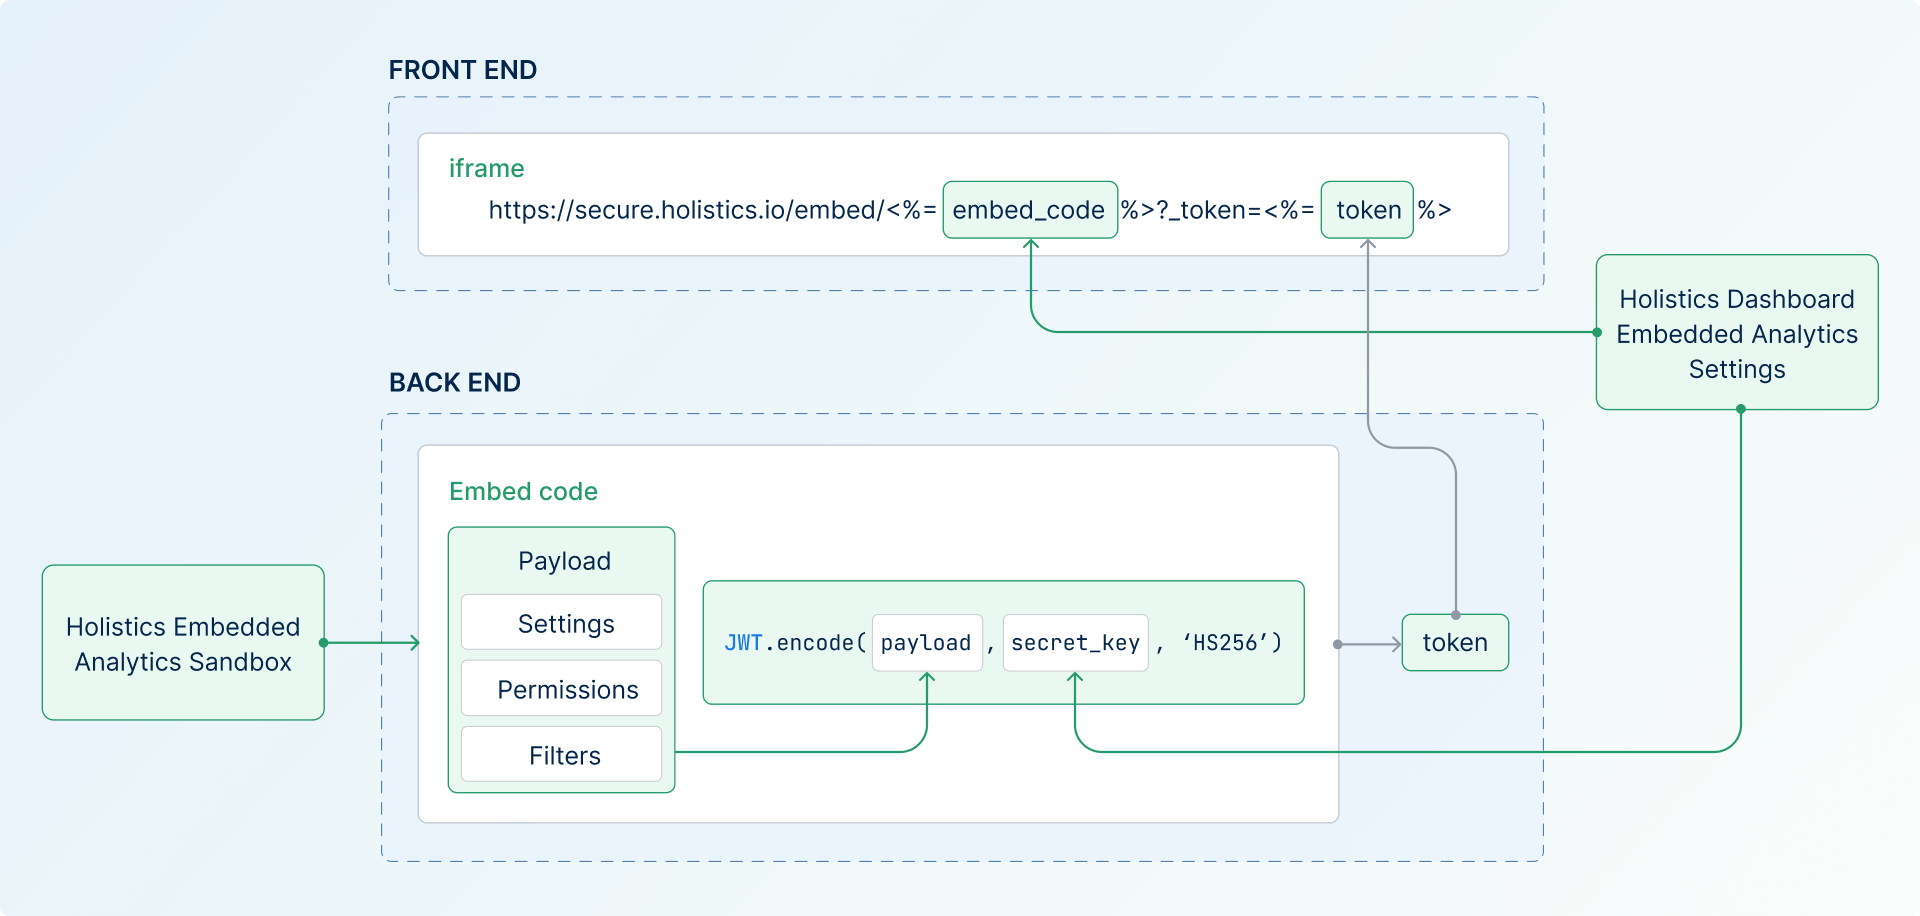 Provide sandbox UI for generating the iFrame backend code source | 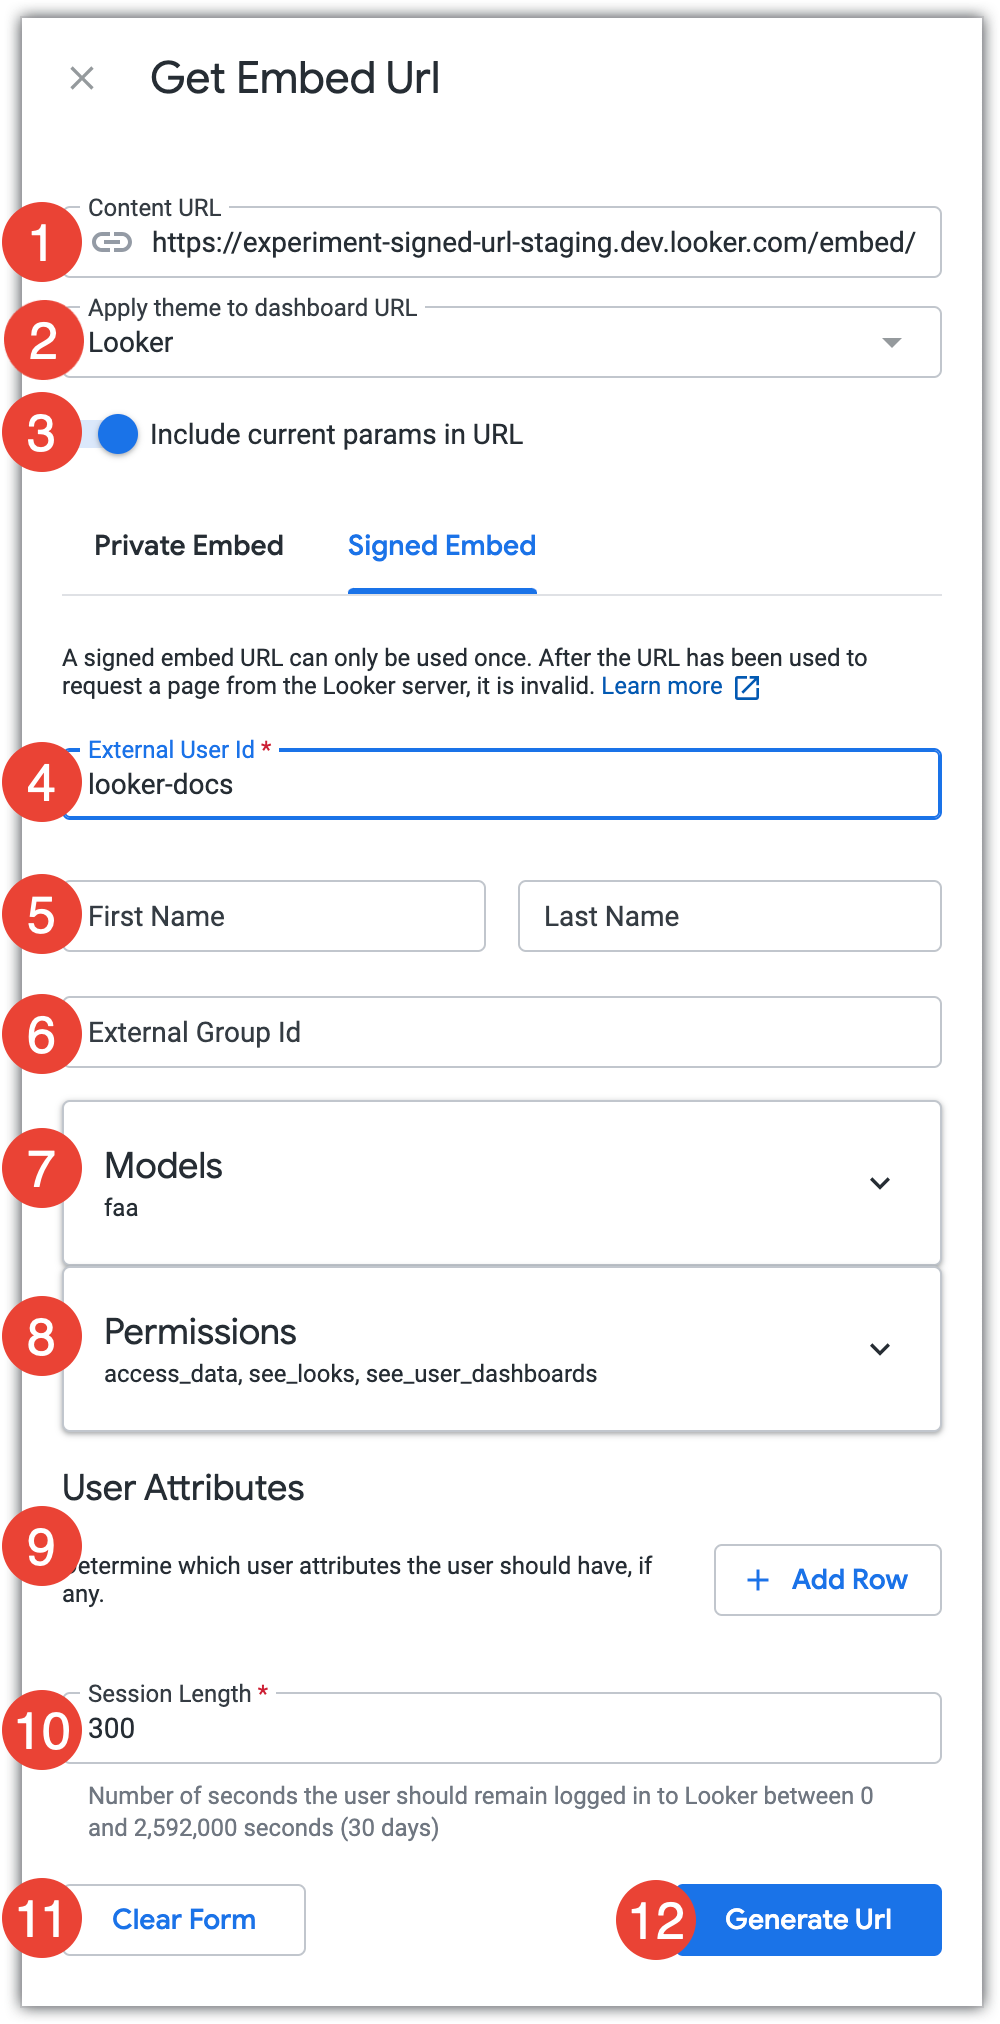 Allow developers to generate signed embed URLs for dashboards, Looks, or Explores. source | iframe Embedding Provide embed codes with configurable URL parameters for iframes on external applications. source | iframe Embedding Create secure token-based URLs for iframes, with access controlled via Azure Active Directory. source | ❌ | 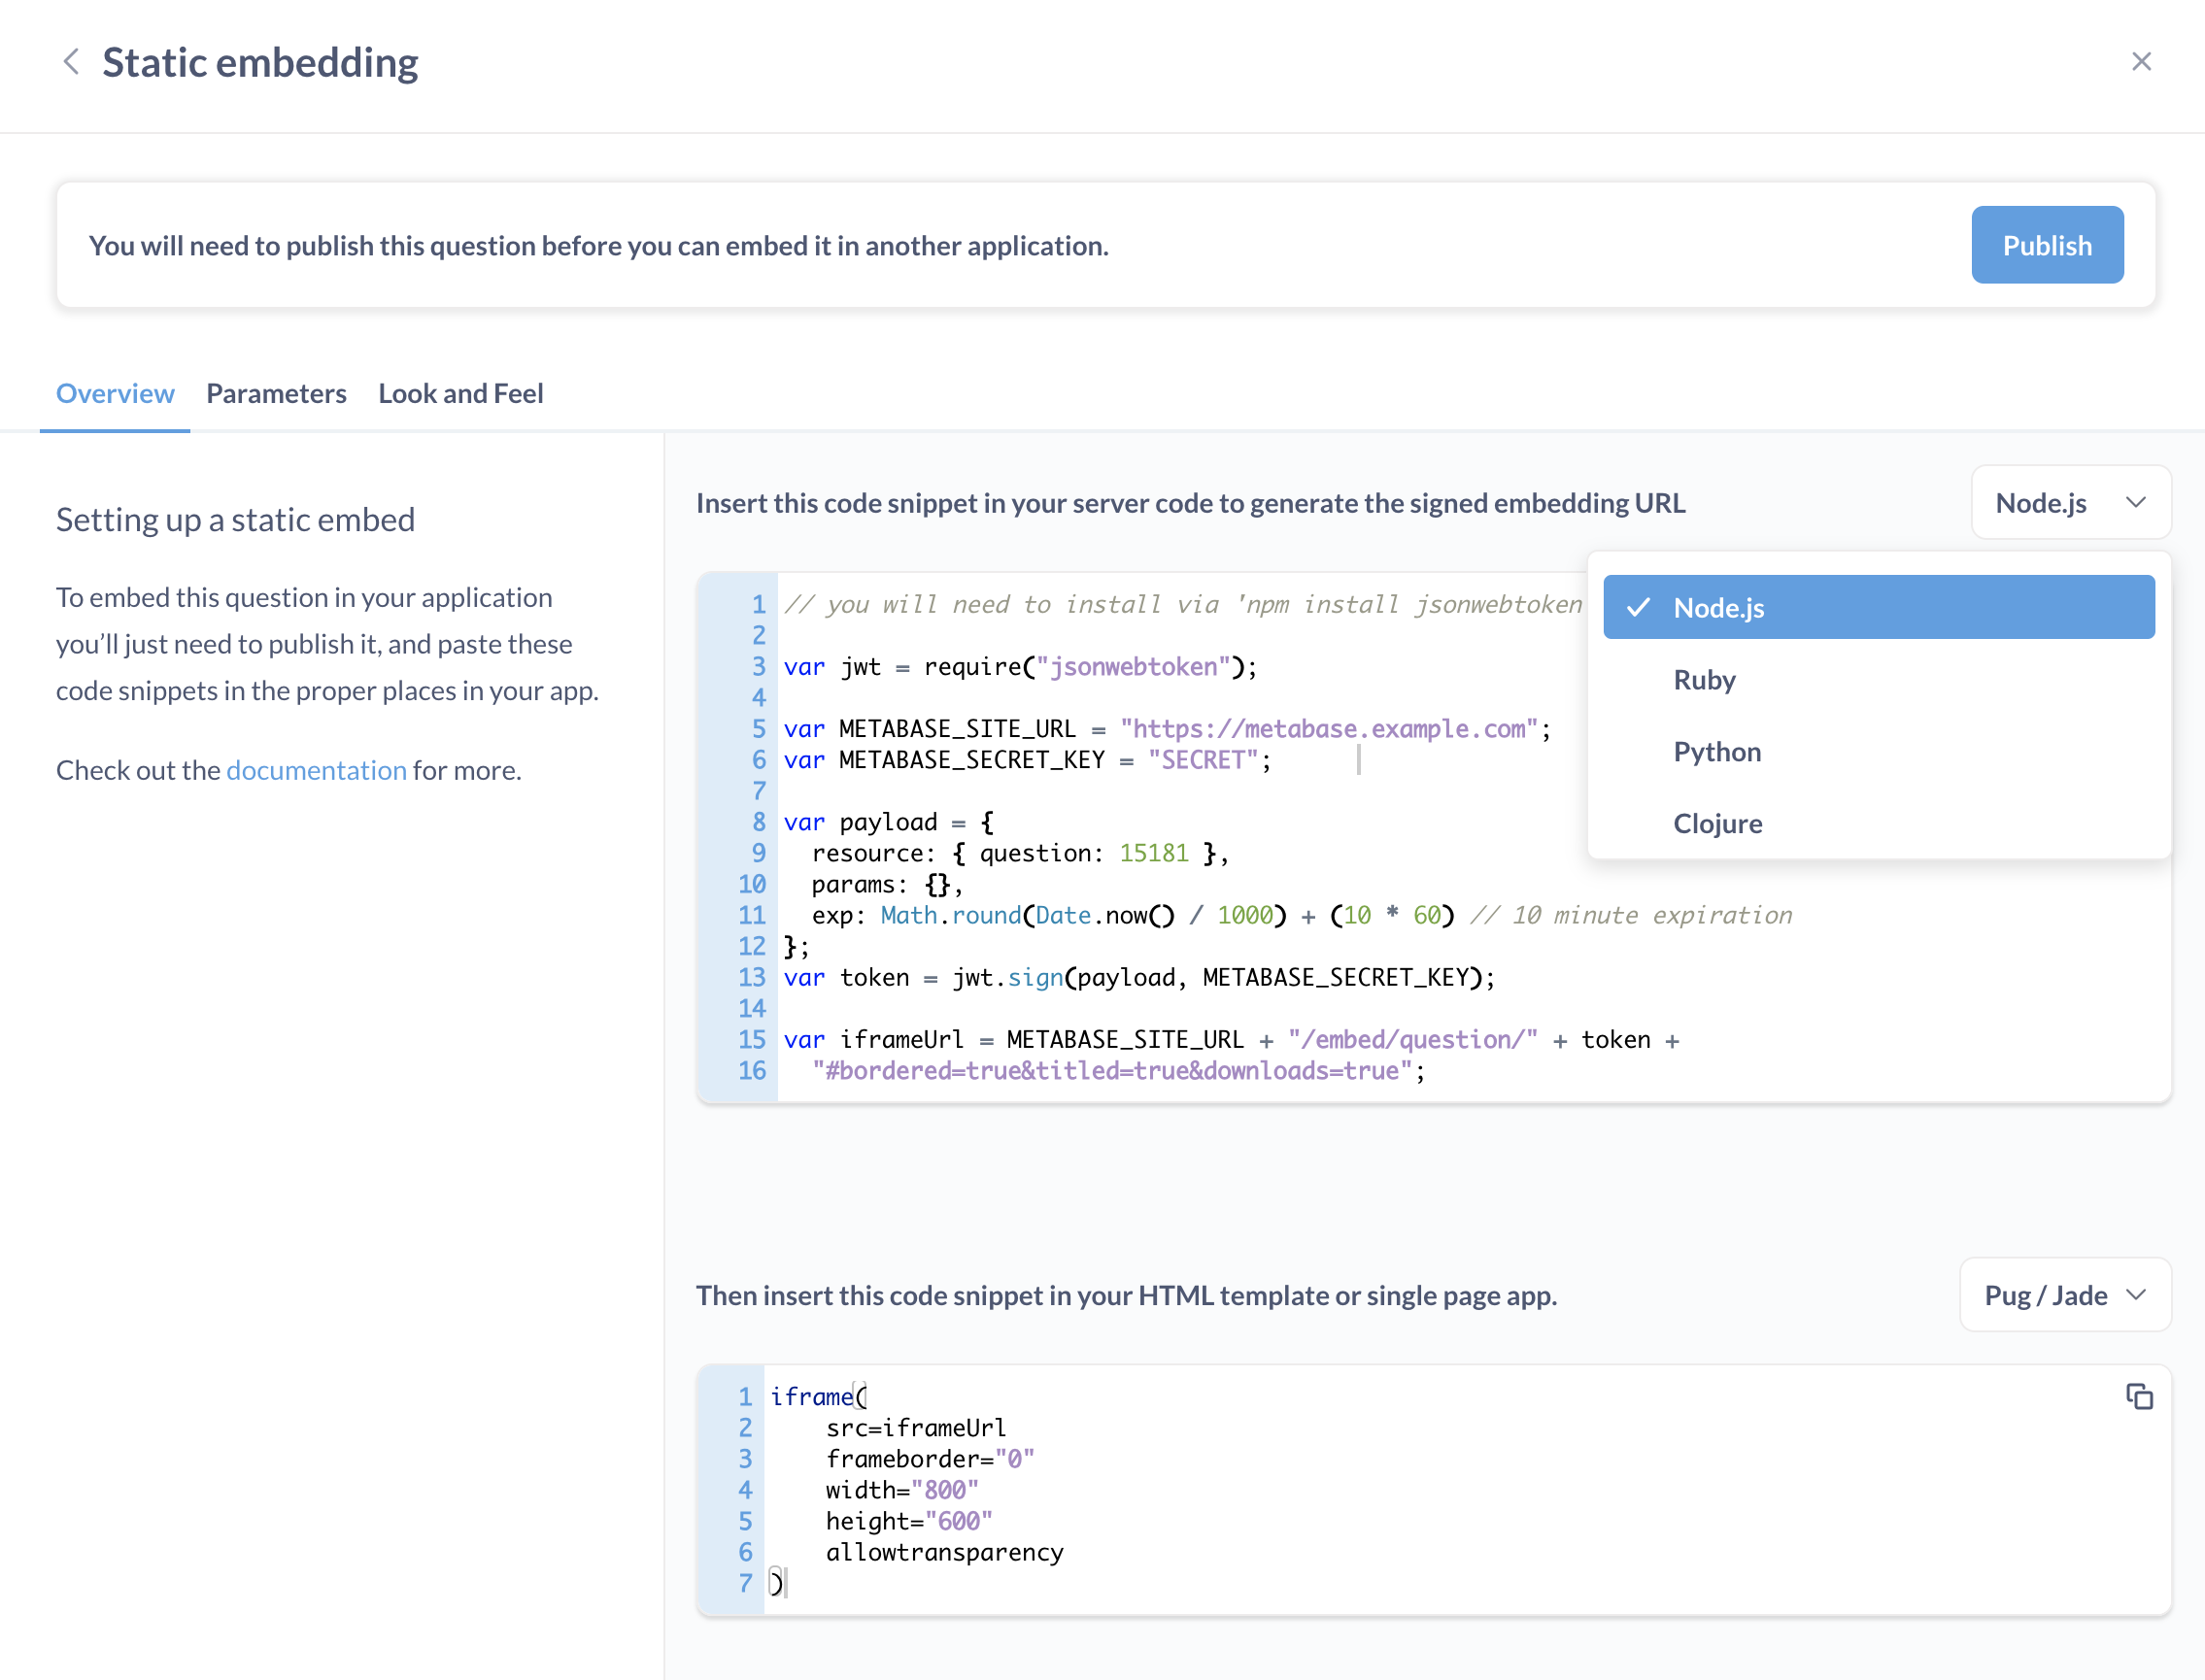 Allow users to generate signed URLs with tokens for secure embedding. source | Allows developers to embed cards and dashboards via iframe using URL attributes source | 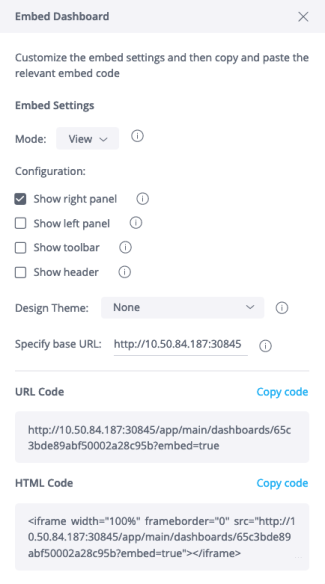 Supports embedding via iframe with web access token and customizable filter settings. source | iframe Embedding Provide embed URLs and secure authentication tokens that can be integrated into external apps via configurable iframe parameters source | iframe Embedding Not Available | ❌ |
| | ❌ |  Offers Embed SDKs for JavaScript, allowing developers to streamline embedding workflows. source | SDK embedding Not Available | JavaScript SDK Provides a JavaScript SDK with pre-built functions for authentication, event handling, and embedded report interaction source | Embed SDK Offer web components or native React/Vue embeds. source | React SDK Offers an Embedding SDK for React, allowing developers to integrate individual Metabase components. source | ❌ | Compose SDK Supports embedding analytics with Compose SDK, a set of client-side libraries and components for query composition and data visualization. source | React SDK Sigma's Embed SDK for React simplifies app integration with a developer-friendly interface, in contrast to the JavaScript API that offers more control but needs more coding. source | SDK Embedding Provides a web component to securely embed a specific Luzmo dashboard. source | Reveal SDK Supported with Reveal SDK Web Component Wrappers, currently in Beta. source |
| | ❌ | Embed API Embed API allows developers to programmatically control embedded content, such as dynamically generating embed URLs and interacting with Looker content. source | JavaScript API Provides a JavaScript API that allows developers to interact with embedded dashboards programmatically. source | REST API Provides REST APIs that enable developers to programmatically retrieve embed URLs, generate embed tokens, and manage content. source | Embeddable API Provides an embedding API that programmatically list all Embeddables in your workspace. source | Embed API Provides an embedding API that enables developers to fetch cards and dashboards via JSON Web Tokens (JWTs). source | Embed API Enables automated embed token creation for secure access, with authentication and pre-set filters for controlled data access. source | Embed API Offers a REST API for advanced user and developer access to server functions like user management, data model manipulation, and dashboard customization. source | REST API Enables programmatic management of users, permissions, workbooks, and tasks like onboarding, data export, and row-level security. source | Core API Provides access to the same API used to build Luzmo, which uses REST with default HTTP verbs and JSON Content. source | Reveal API Supports receiving data directly from Reveal SDK. source |
| | Allow users to create a shareable link of a dashboard, and embed it directly to websites. source | 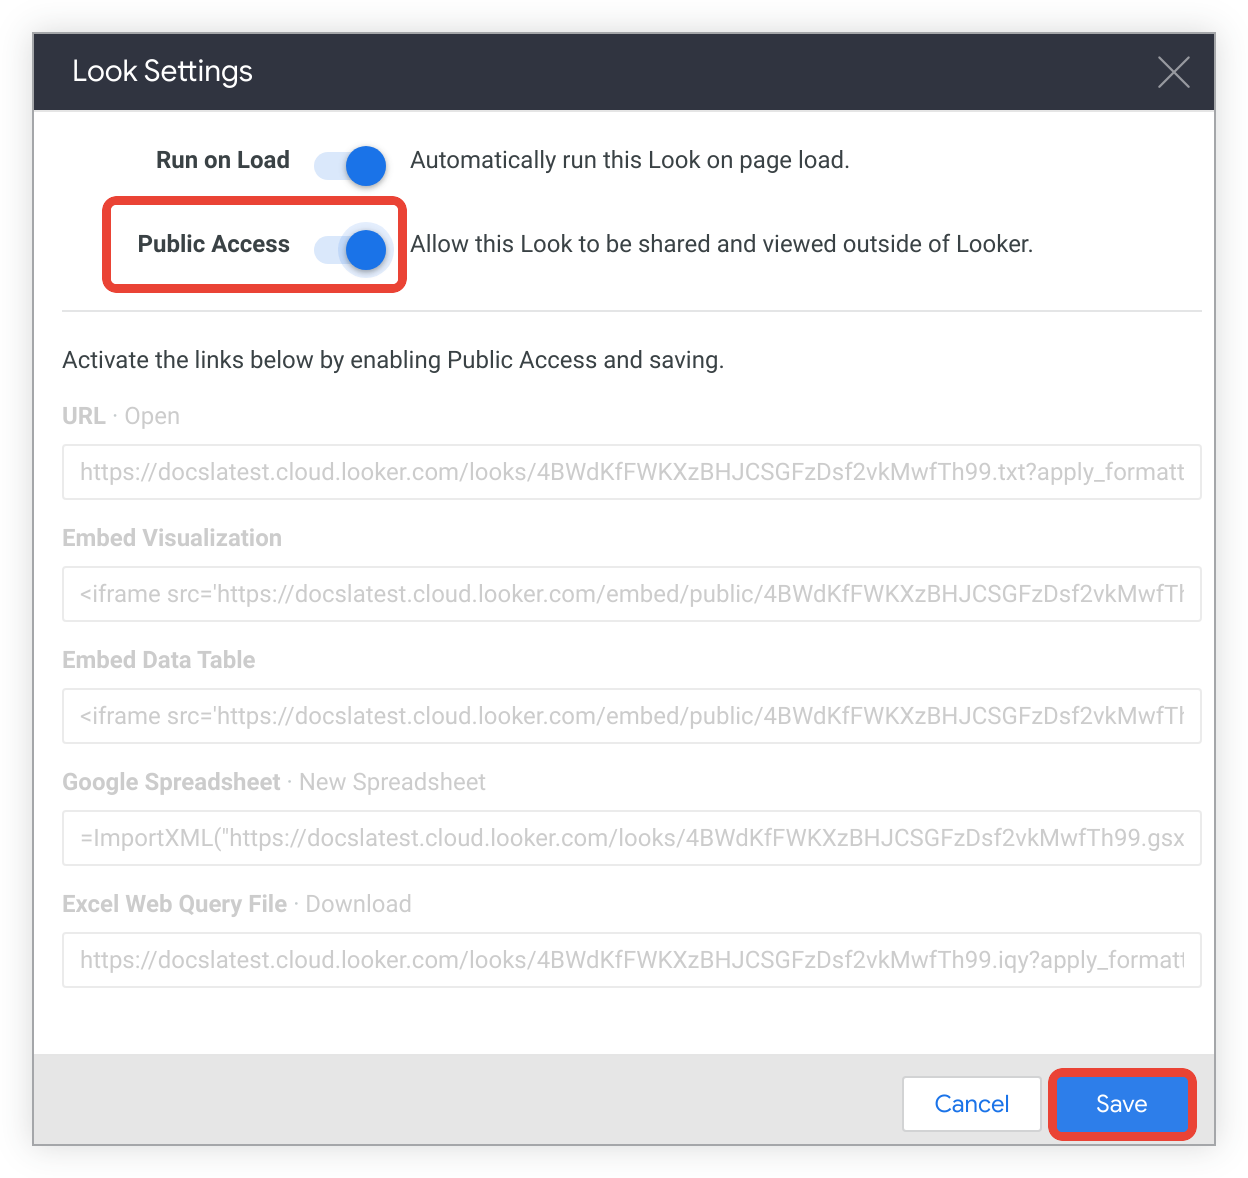 Allow users to share data visualizations publicly via embeddable URLs source | Tableau Public Supports public embedding via Tableau Public, enabling users to publish visualizations to a publicly accessible server. source | 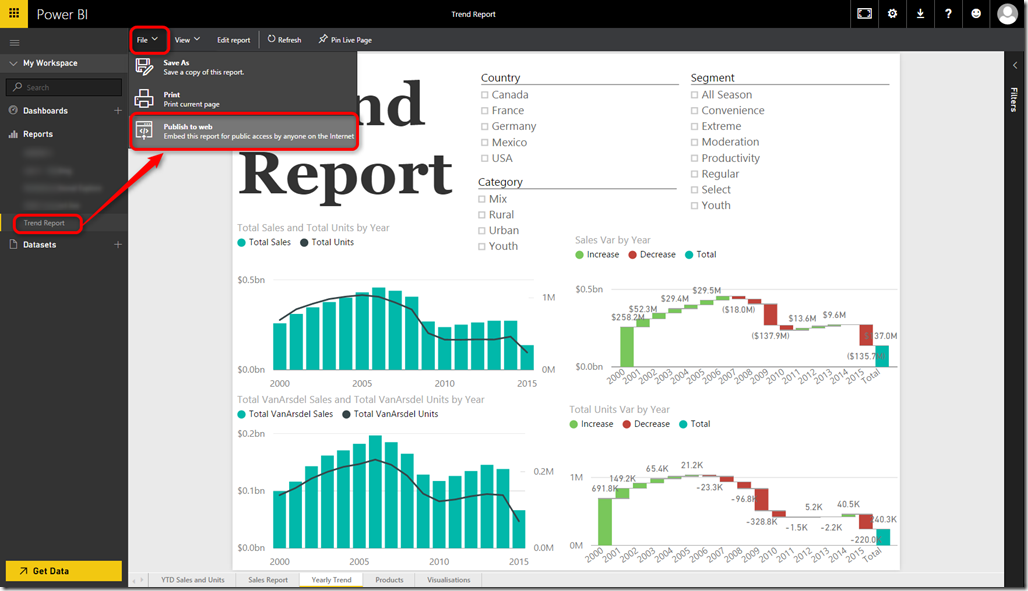 Via "Publish to Web" option, which generates a publicly accessible embed URL for sharing reports without authentication. source | Public Embedding Public embedding available via provided embedding methods | 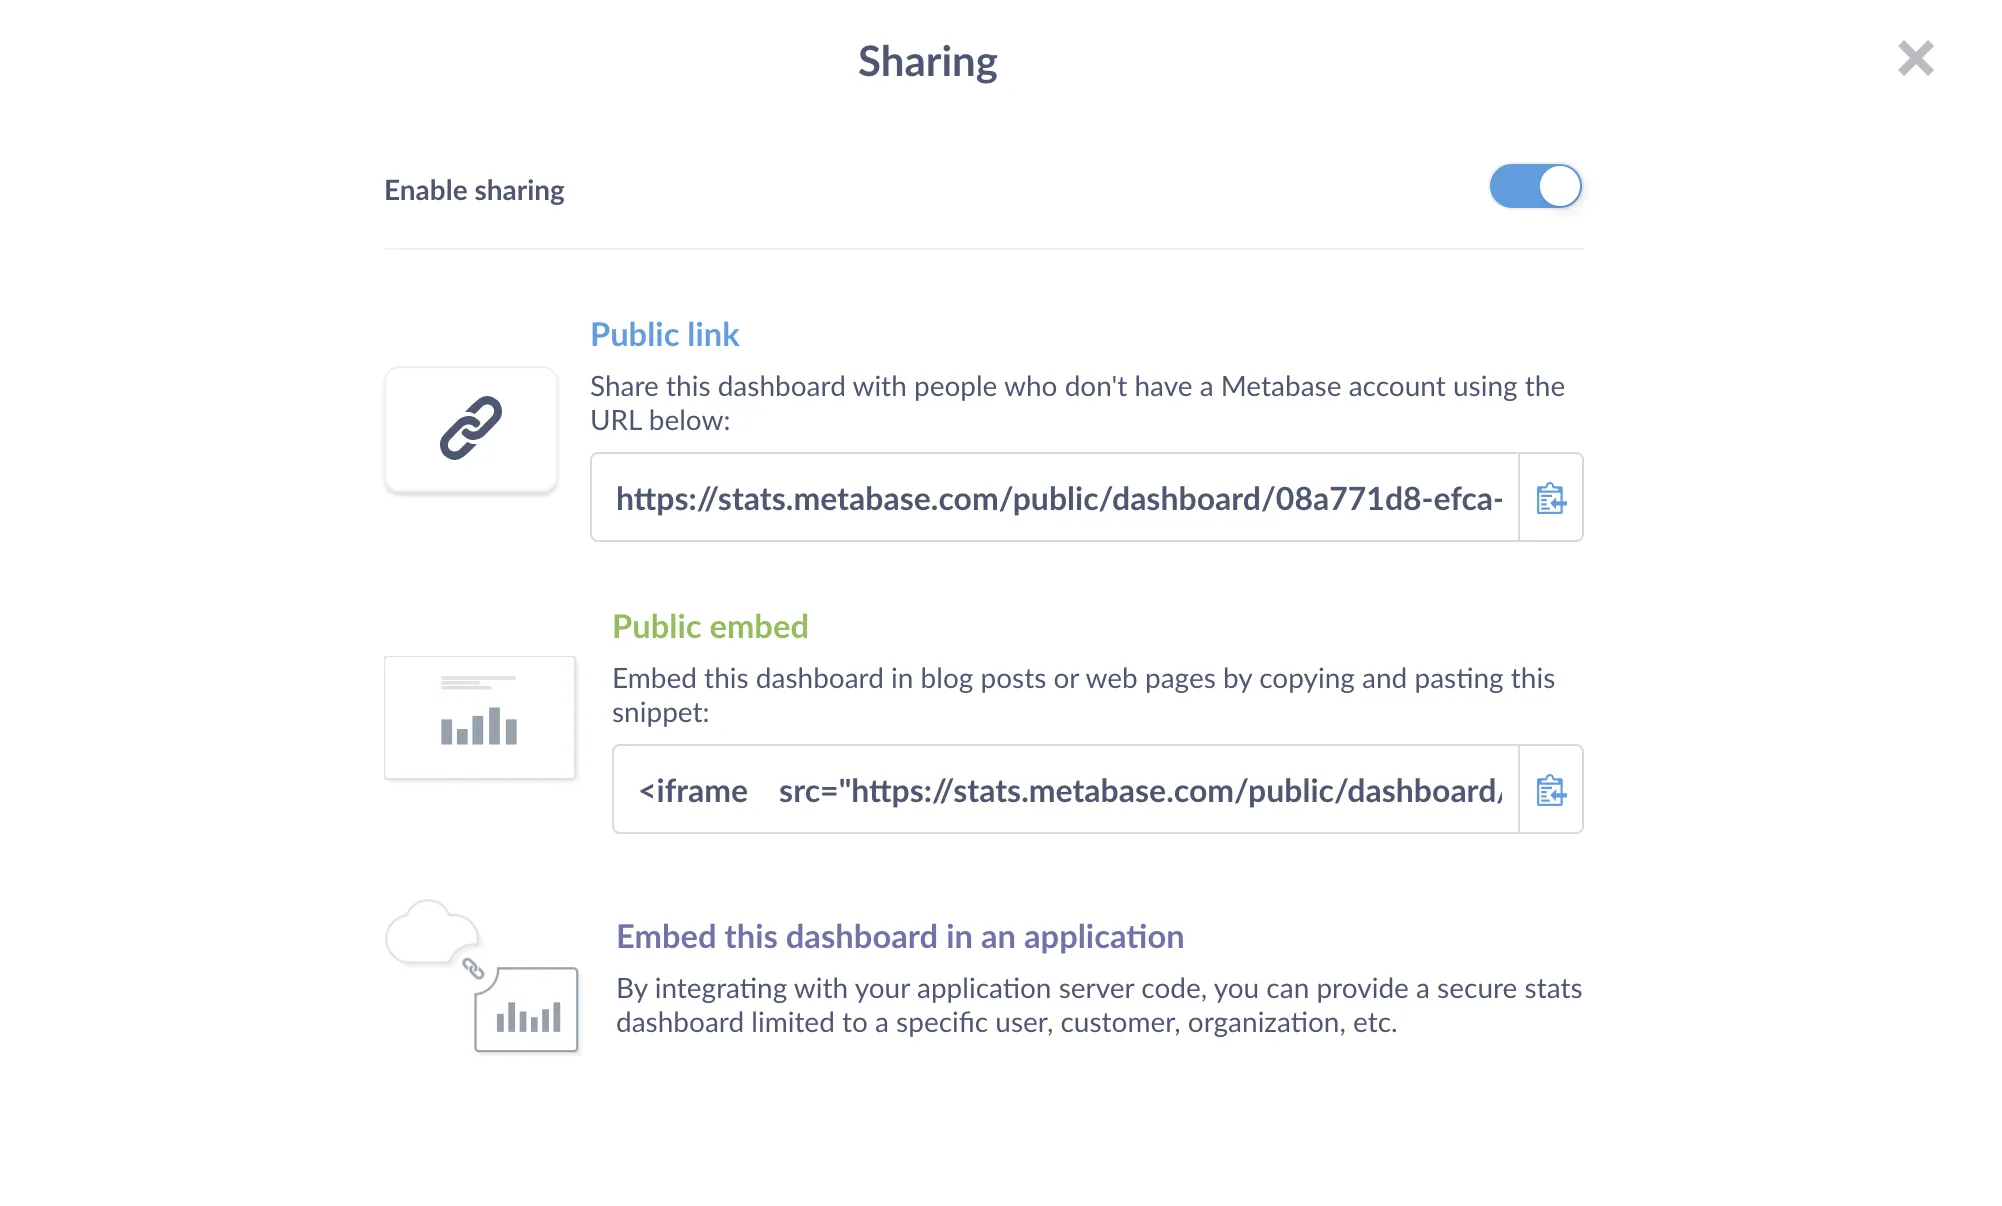 Allow dashboards and questions to be shared via public links, which generate a shareable URL anywhere. source | Public Embedding Allows users to embed dashboards with a publicly accessible link. source | ❌ | 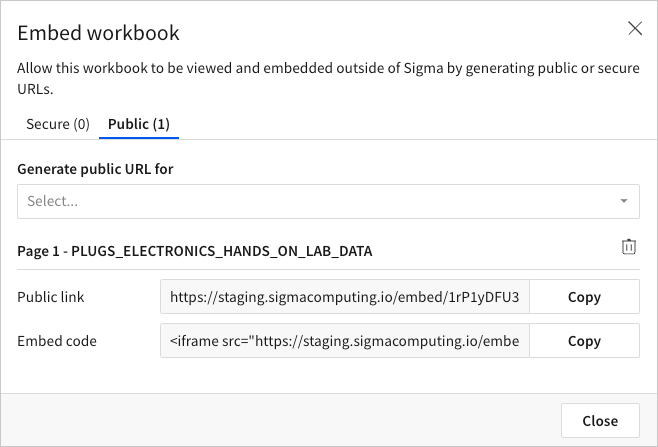 Allows sharing content (workbooks, pages, or individual elements) with publicly accessible links. source |  Allows users to publish dashboards to a publicly accessible link. source | ❌ |
| Permission & User Access Control Embedded tools should ensure each customer can only see their own data and prevents unauthorized modifications. This is called multi-tenancy. Most embedded BI tools support the basic version of this capability. When evaluating, look into permission levels (e.g., column-level access, row-level access, password-protected sharing) and ensure permission settings are intuitive. | |||||||||||
| |  Support row-level access controls managed through secure server-side tokens (JWT). | Multi-tenancy Supports Row-Level Access Control (RLS), and user attributes to securely segment data and tailor experiences for different tenants. | Multi-tenancy Supports site-level segmentation, user permissions, and Row-Level Security (RLS) to isolate data and content for different tenants. | Multi-tenancy Supports row-level security, user filters, tenant-specific configurations. | Multi-tenancy via RLS Multi-tenant and single-tenant setups supported via row/table/schema-level security. source | Multi-tenancy Supports row-level security via JWT tokens and multi-tenant deployments. | Multi-tenancy Configurable via programmatic filtering. Also supports configurable rows and columns policies using PDP (Personalized Data Permissions). source | Multi-tenancy Enables row-level security with rules controlling user access to raw data, automatically tailoring dashboards to display user-specific data. source | Multi-tenancy Supports column-level security by configuring the embed API to pass user attributes at runtime. source | Multi-tenancy Supports multi-tenancy through flexible token-based overrides and plugin architecture. source | RLS with Usercontext Supports user-specific data access with row-level security. source |
| |  Allow connecting to different data sources (databases) based on different customers (tenants). source | ❌ | ❌ | ❌ | Environment API Connects dynamically to unlimited data sources via the Environments API. source | ❌ | Dataset Switching Allow users to dynamically change the underlying data of embedded dashboards. source | Dynamic Elasticube Dynamically determines the appropriate data source for powering a given dashboard. Supports only Windows and Linux. source | 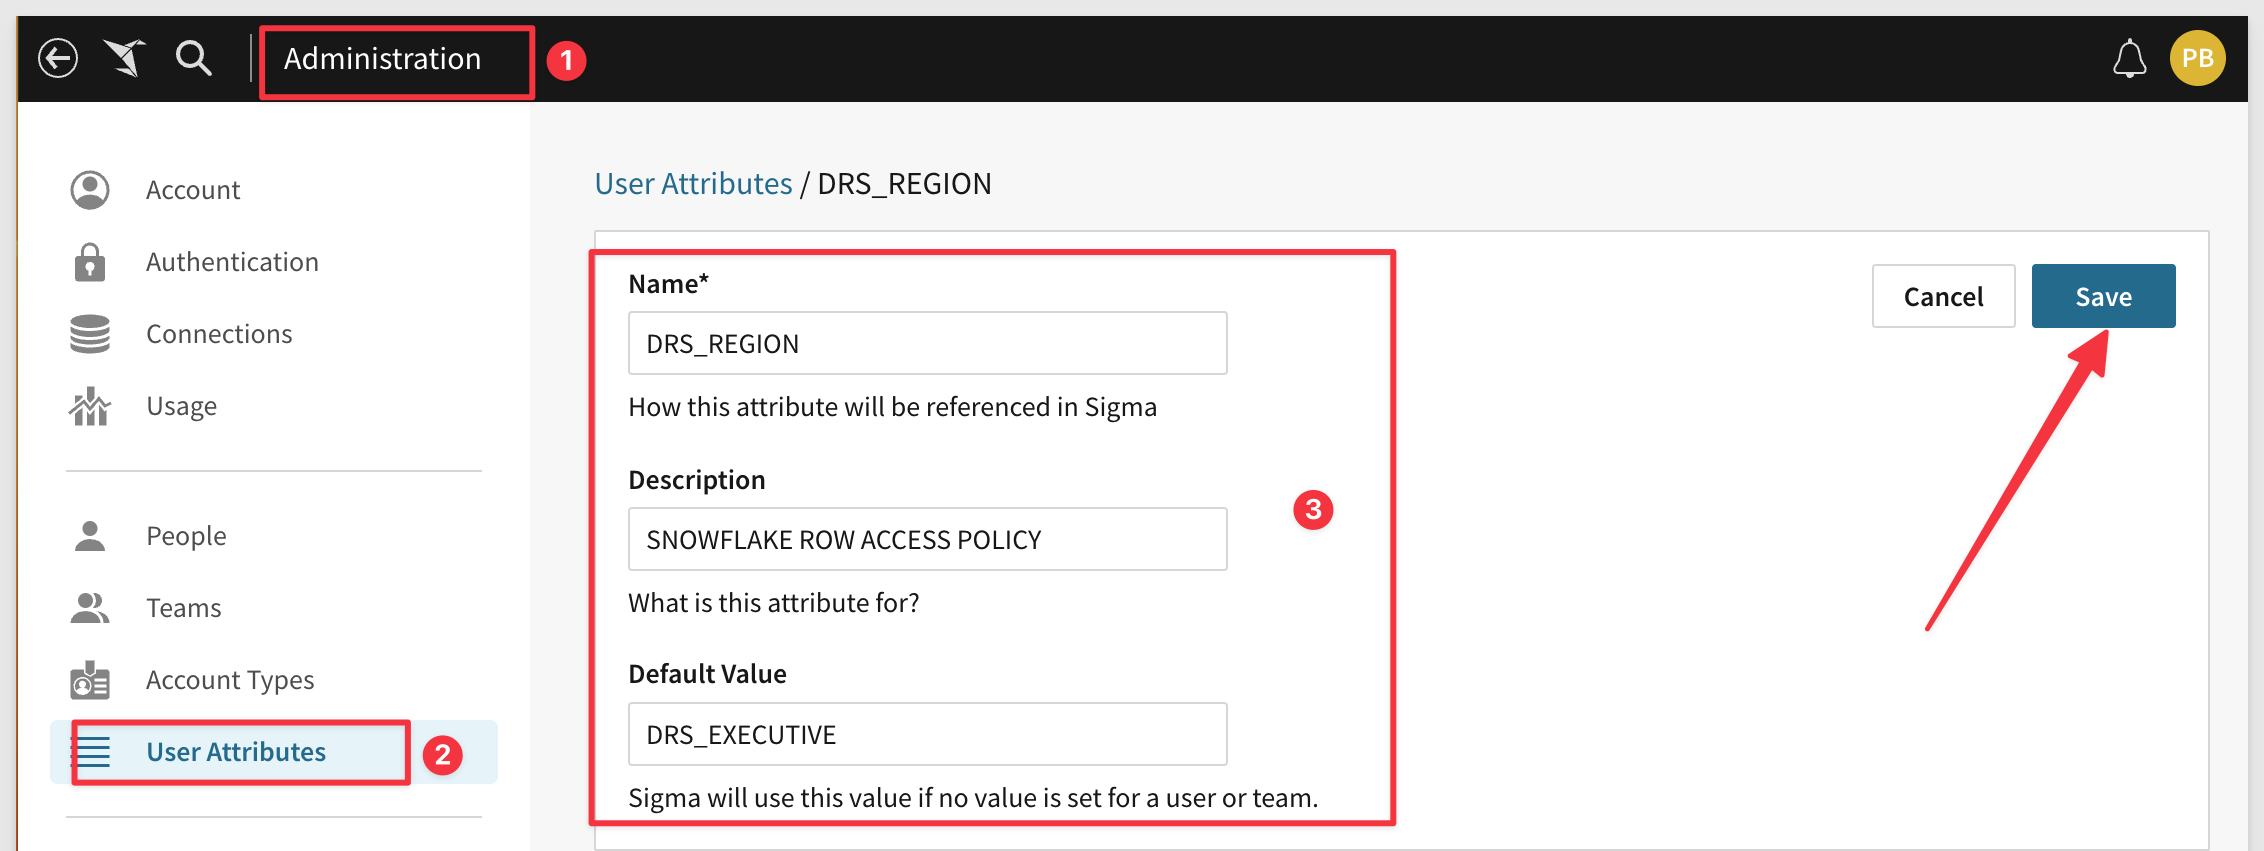 Sigma supports dynamic Warehouse and Role switching at runtime, configurable via the Embed API. source | ❌ | Via UserContext Reveal BI dynamically configures data sources based on user context such as permissions, or tokens to determine access and usage. source |
| Look & Feel The BI tools should allow developers to maintain a branding consistency, deliver customized dashboards and cater to diverse visualization needs. When evaluating, look into the level of customization for colors, fonts, layout. Assess the variety of chart types and their customizability. | |||||||||||
| | Allow users to create custom, reusable themes using code through canvas-based dashboard. source | 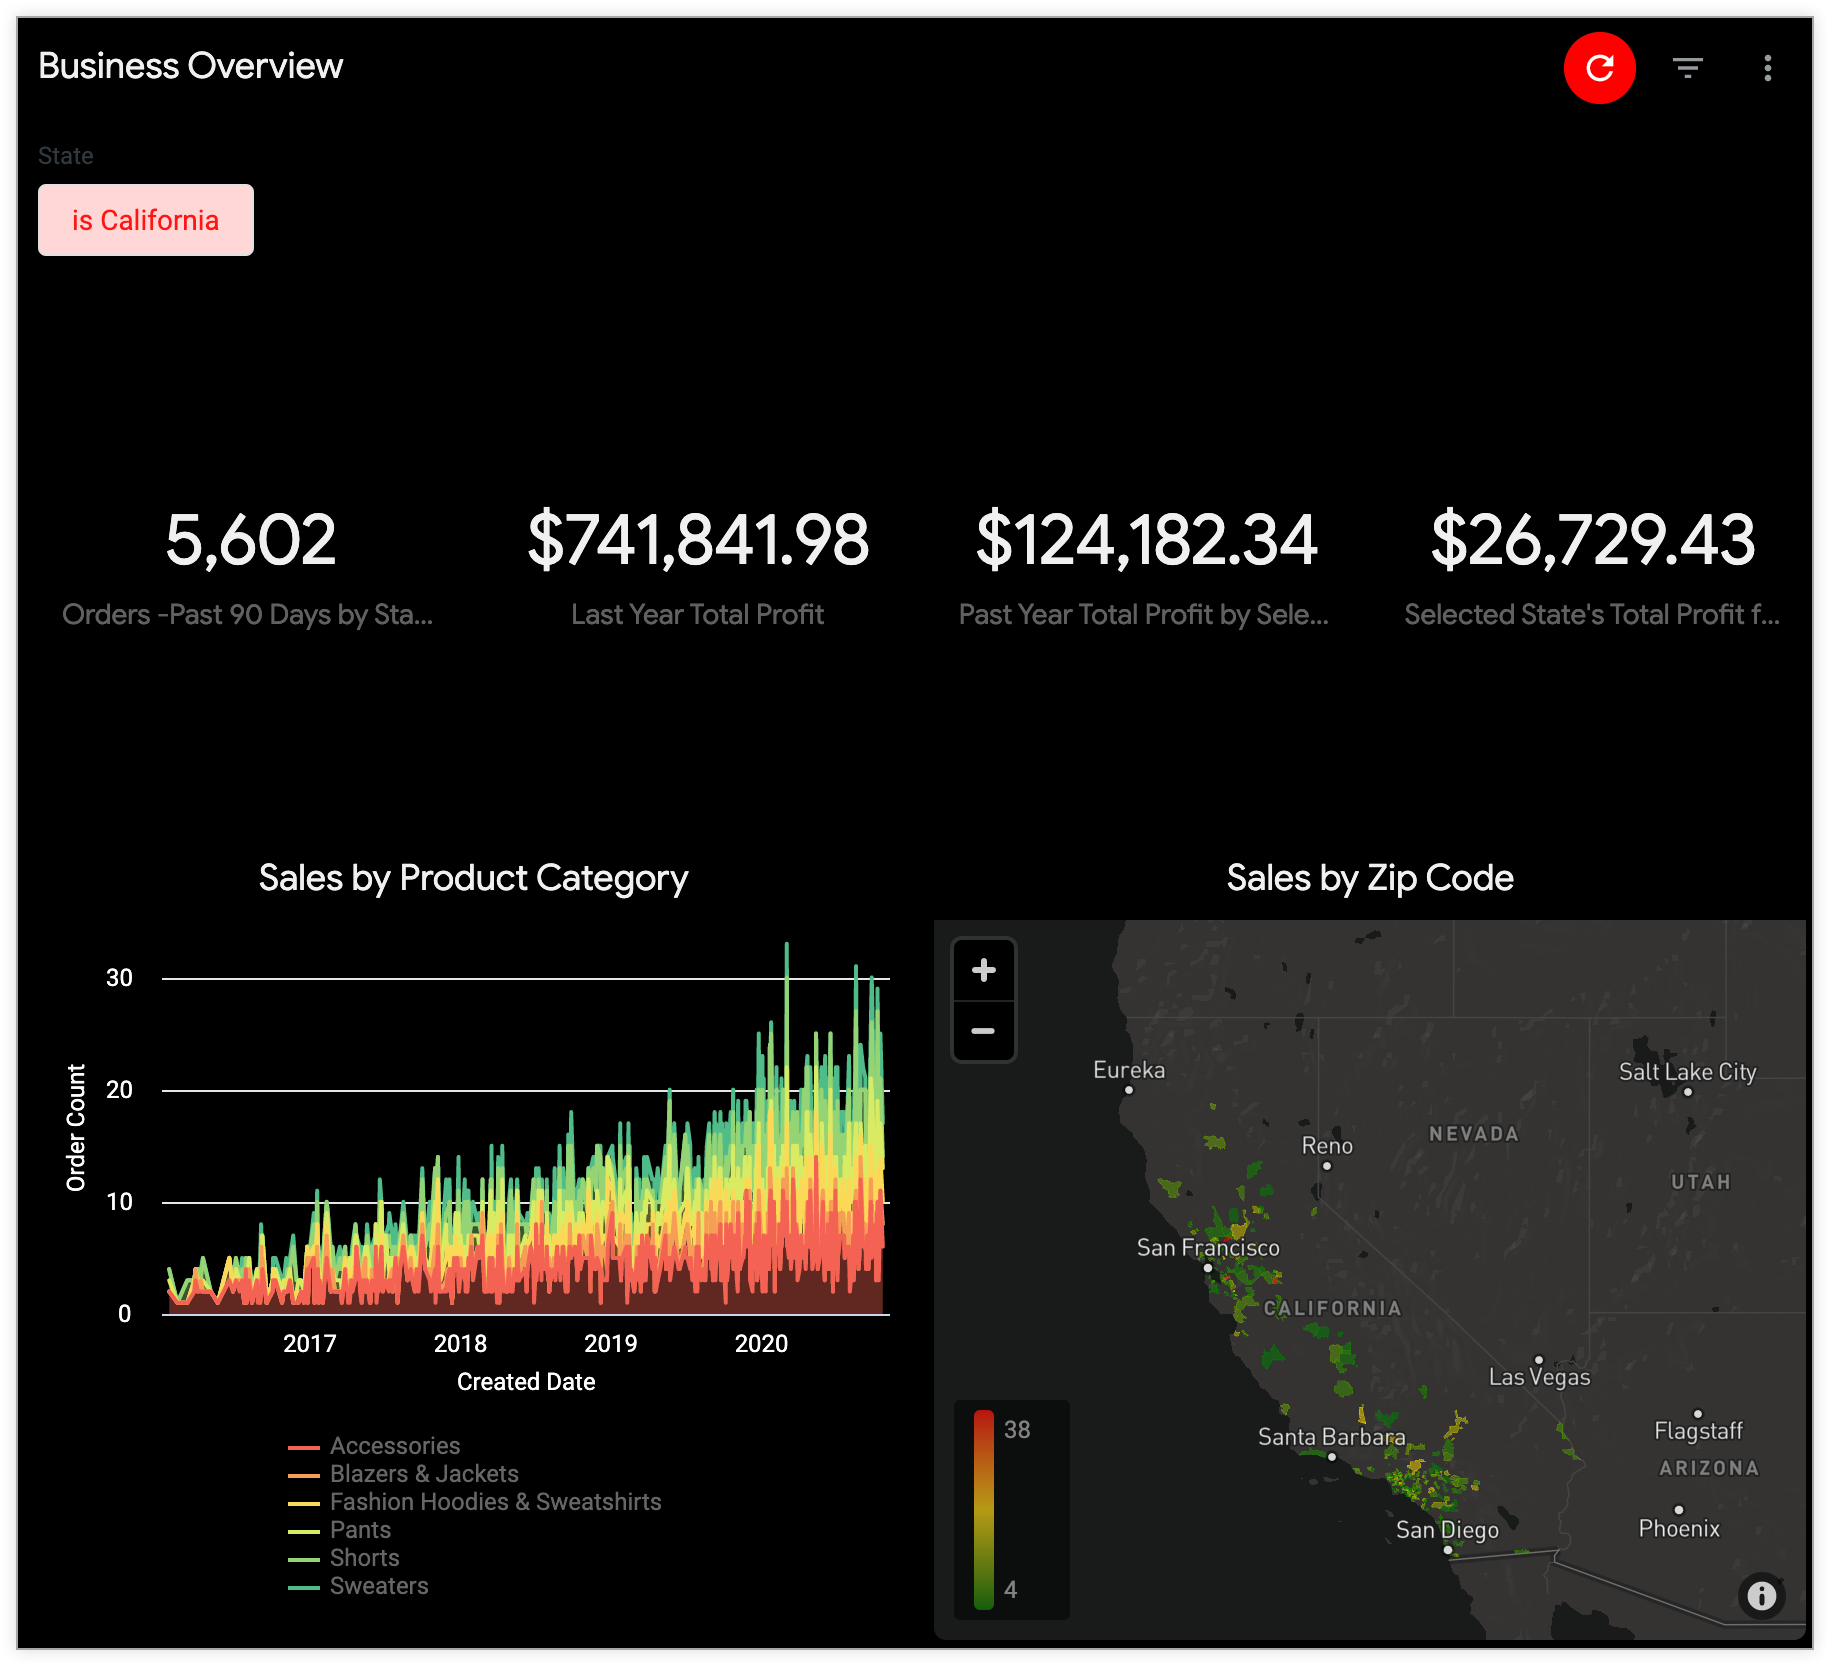 Allow admin users to build and customize themes through LookML or UI settings. source | Custom Themes & CSS Styling Supports indirectly via extensions and web embedding with CSS and JavaScript for advanced theming. source | 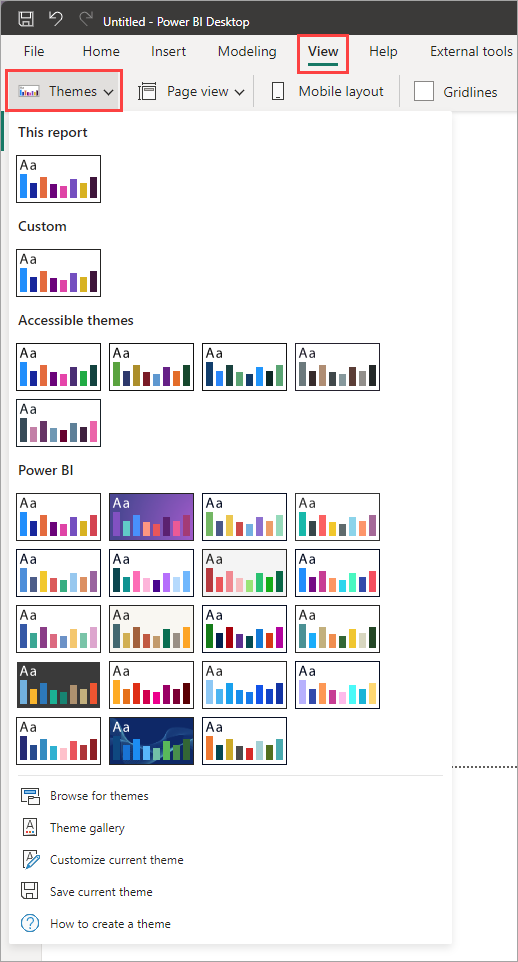 Allow users to import JSON-formatted theme files. source | CSS and Themeing Charts are provided as code and fully-extensible/modifiable, including CSS, theming etc. source | 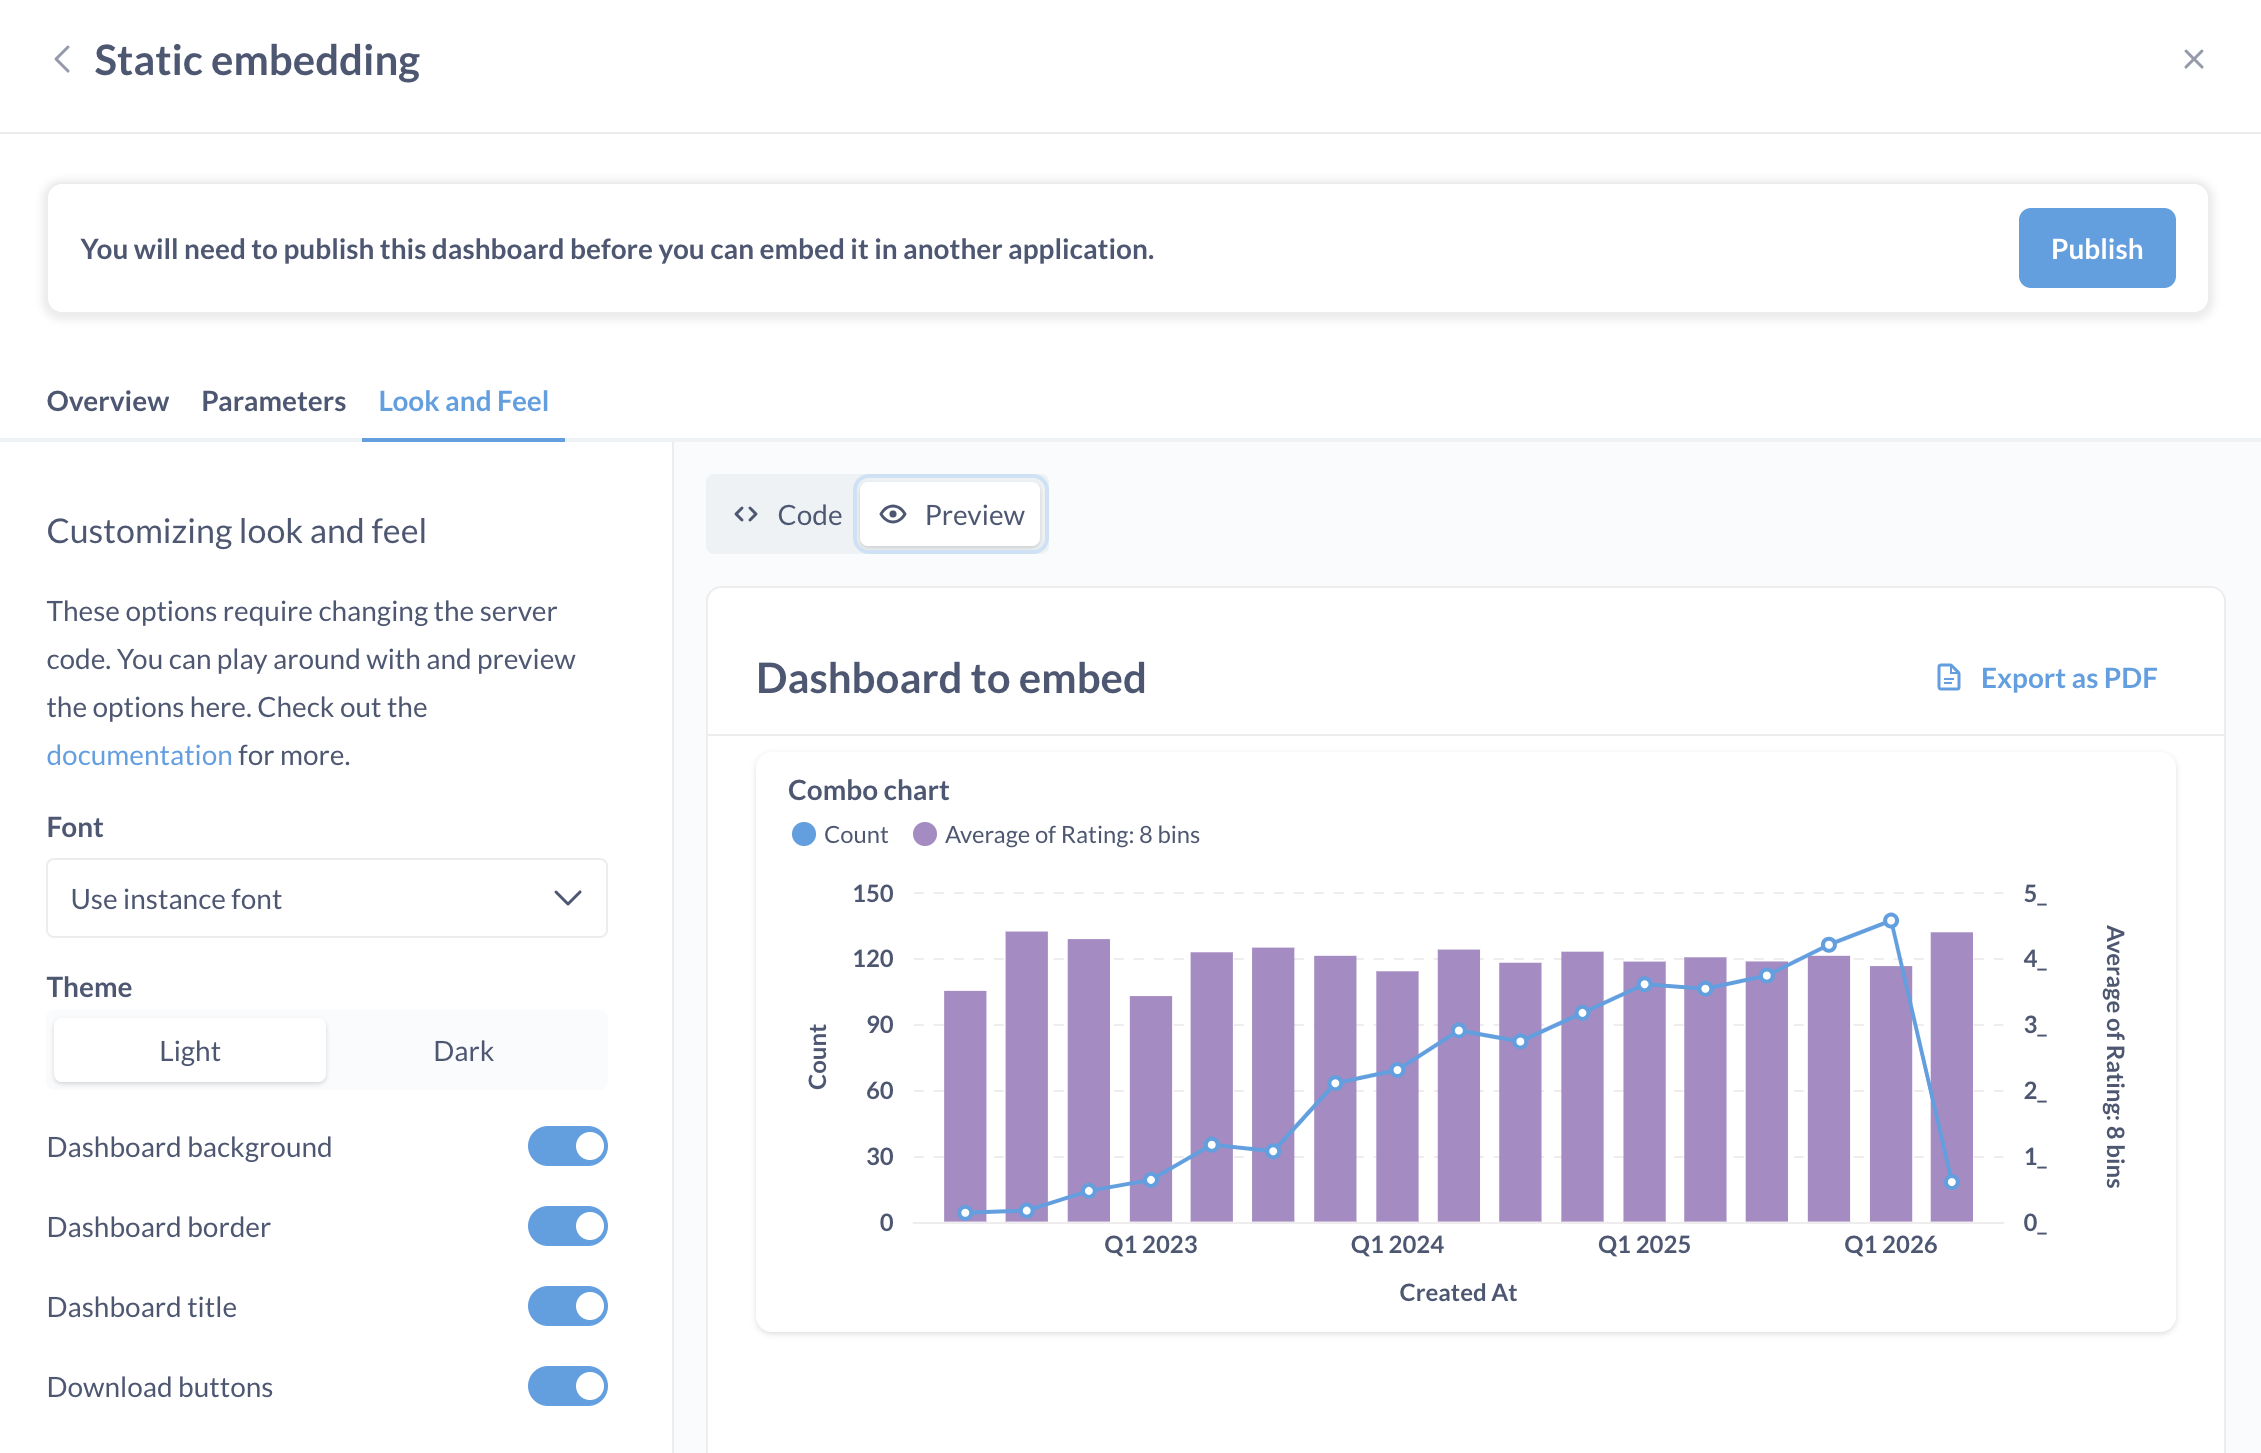 Available natively. source | CSS and custom style available in Domo Bricks. source | Custom Themes & CSS Styling CSS can be dynamically injected into dashboards using JavaScript. source | 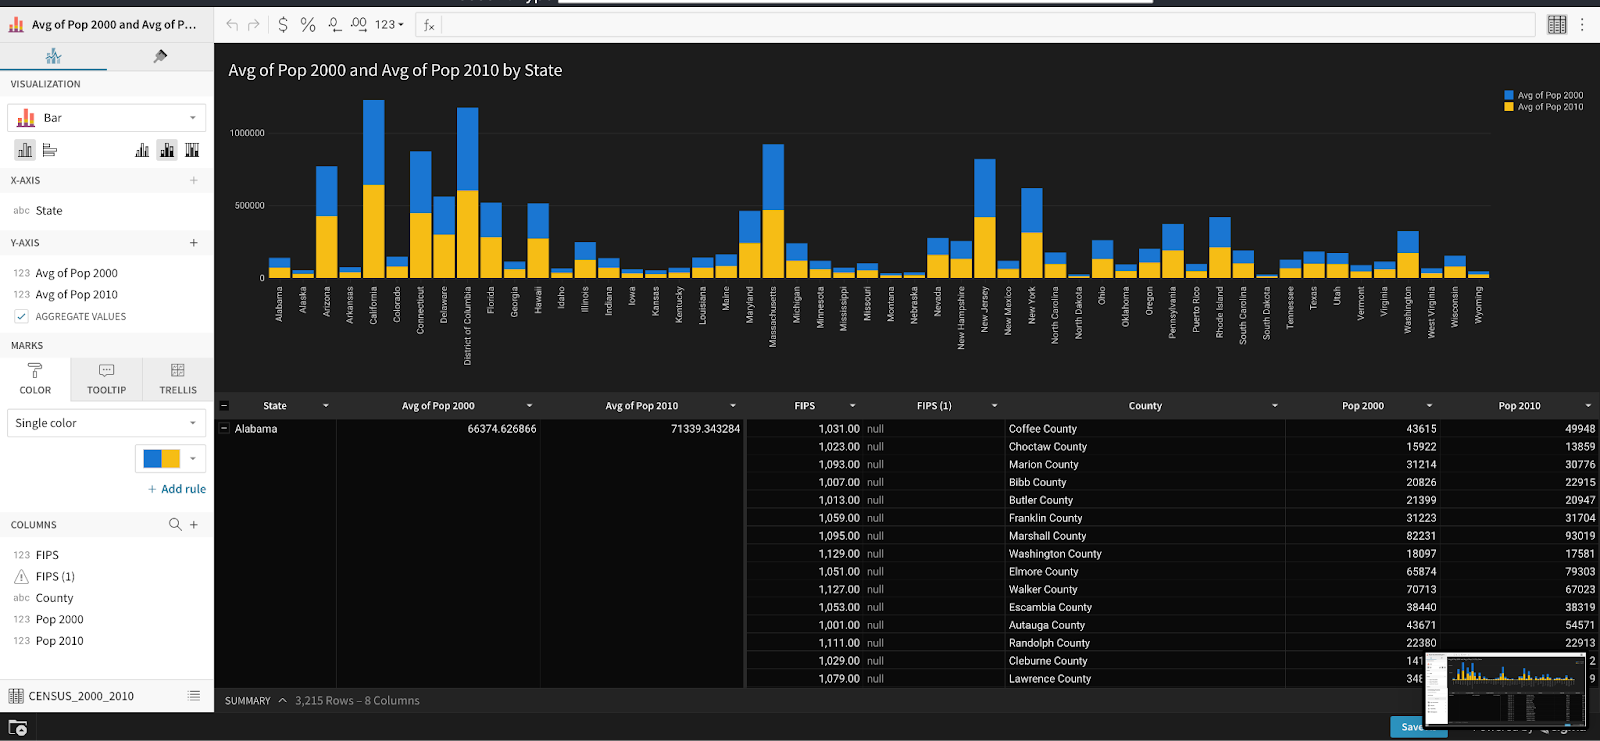 Through theme selection, custom font uploads, and URL parameters. source | 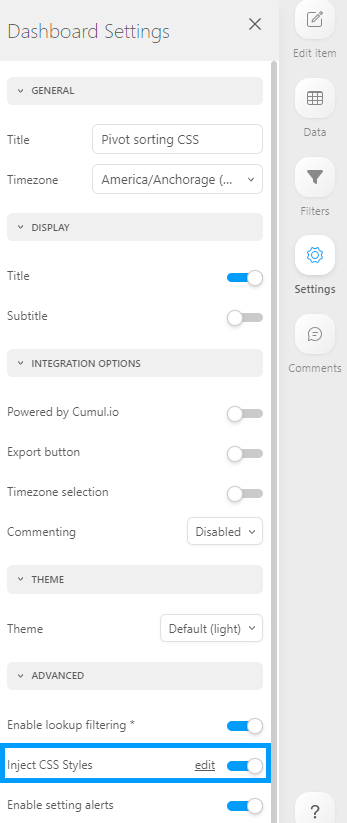 Supports both dynamic and static CSS injection, giving users flexibility in applying styles either on the fly or as predefined settings. source |  Create a custom RevealTheme to define colors and fonts for Reveal SDK UI elements. source |
| |  Supports custom charts via Vega-Lite. source | Via Looker Marketplace Available through Looker marketplace. source |  Rich visualization options. Custom charts are supported with Viz Extensions API. source | Via Power BI Visual SDK Supported with Power BI Visual SDK, limited native theme customization source | Extensible Charting Components Fully-extensible charts provided as code, or import your own. source | Custom Visualizations Requires external tools or programming languages (e.g., Python with libraries like Seaborn or D3.js). source |  Supports custom visualizations through an app ecosystem. source | Via Highcharts API Allow users to customize widgets using Highcharts API. source | Via D3/Recharts Plugins Available Plugins include Recharts Bar Chart, D3 Candlestick/Graph/Sunburts, Narrative Science Quill, and Frappe Heatmap. source |  Supports custom visualizations library for Luzmo Flex SDK. source |  Supports flexibility to define custom visualization components. source |
| | Through canvas-based dashboard that allows more fluid dashboard design. source | Code-based Customization LookML Dashboards in Looker allow code-based customization of tile positioning, sizing, and settings. source | Custom Layout Supports custom dashboard layouts with drag-and-drop, tiled or floating containers, flexible sizing, and Tableau extensions. source | ICustomLayout & IPageLayout Allows custom layout definition via ICustomLayout and IPageLayout in embed configurations. source | Canvas-based Builders can drag, drop, resize, add/remove, apply dynamic configuration options. source | Custom Layout Limited support for custom layout via drag-and-drop interface to arrange charts, tables, and text cards on the dashboard. source | Domo Stories Domo Stories allow users to create custom layout or use existing templates. source | Custom Layout Offers limited customization options for its embedded solution using JavaScript and the add-on frameworks. source |  Supports custom layouts via a drag-and-drop interface and grid system that allows users to arrange, resize, and customize visual components. source | Luzmo Flex Allow users to programmatically create custom data products and blend them with your own components. source | ❌ |
| Performance & Scalability Tools should ensure reasonable performance, and should scale well with increasing viewers and data volumes. There are typically 2 methods that affect report performance:
| |||||||||||
| |  Stores query results on demand for configurable durations. source | Query Caching Stores query results and leverages persistent derived tables (PDTs) to precompute and cache aggregated or intermediate query results. source | Query Caching Store query results in its in-memory data engine and utilizing a query cache on Tableau Server to improve data retrieval speed. source | Query Caching Supports storing initial query results locally for semantic models in Import mode. source | Aggregated Data Caching Two configurable caching layers. A request cache and a pre-aggregations cache to enable faster loading source | Query Caching Caches query results with configurable expiration for embedded dashboards. source | Query Caching Provides a live cache layer, Adrenaline, an in-memory processing engine that caches data and executes queries directly in memory for real-time analytics. source | Query Caching Part of Sisense's Data Engine and is an add-on feature. Users have the option of caching their data to either the Redshift Cache or the Snowflake Cache. source | Query Caching A workbook's TTL controls how long Sigma uses cached query results. If expired, Sigma retrieves cached results, re-queries the warehouse, and updates the workbook when new data is available. source | Query Caching Query results are cached for a specified time period, during which identical queries are served from the cache. source | Query Caching Store queried data in an embedded database, retrieve it instantly on cache hits, and only reprocess modified steps in a query pipeline to minimize redundant data requests. source |
| | Aggregate Awareness Automatically pick the most optimal aggregated tables per each query for maximal query performance. source | Aggregate Awareness Automatically pick the most optimal aggregated tables per each query for maximal query performance. source | Hyper Data Engine Hyper is Tableau's in-memory Data Engine technology optimized for fast data ingests and analytical query processing on large or complex data sets. source | User-defined Aggregation Supports aggregation tables that cache data at an aggregated level in-memory. Requires users to manually define aggregation rules and mappings. source | User-defined Pre-Aggregations Supports user-defined pre-aggregations that cache data at an aggregated level. source | Various Methods Via database indexing, caching query results, and allowing users to write custom SQL for precise and efficient data retrieval. source | ❌ | Materialized Views Enables pre-aggregation with Materialized Views, in-memory processing, cross-database joins via Elastic Data Engine, and query performance monitoring. source | Query Optimization Sigma shows query execution time and performs some client-side calculations for better performance. | Luzmo Warp Luzmo Warp pulls data into an optimized analytical datastore at regular intervals. Queries are then executed against stored data instead of source database. source | ❌ |
| Self-service Report Creation Embed viewers should be able to customize and build their own reports based on a predefined set of data dimensions and metrics. Viewers should also be able to interact, download, and share custom reports with other embed viewers. When evaluating:
| |||||||||||
| | Let users explore data with filters, drill-downs, drill-throughs, underlying data views, and Ask AI — a conversational analytics feature that enables embedded users to explore data using natural language queries directly within the Embed Portal. source | 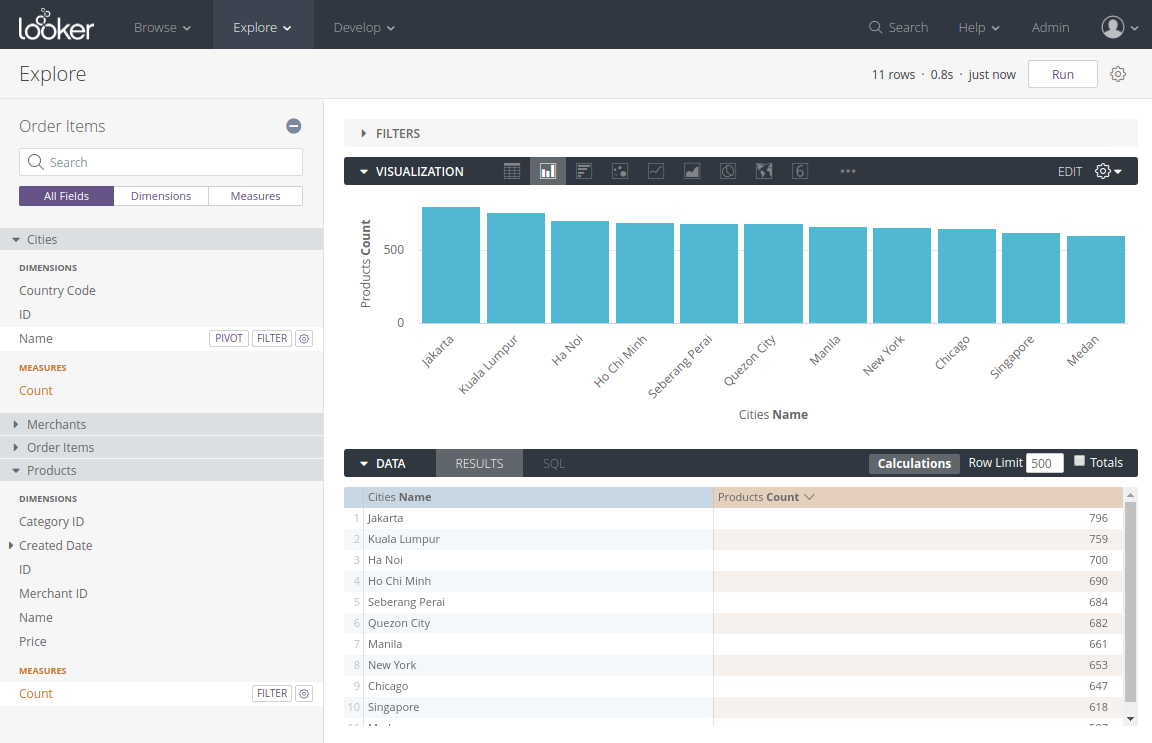 Through pre-built Explores, filters, pivoting, drill-downs, custom dimensions and measures. source |  Through a drag-and-drop interface, filters, pre-defined parameters, drill-down hierarchies, and natural language queries via Ask Data. source | 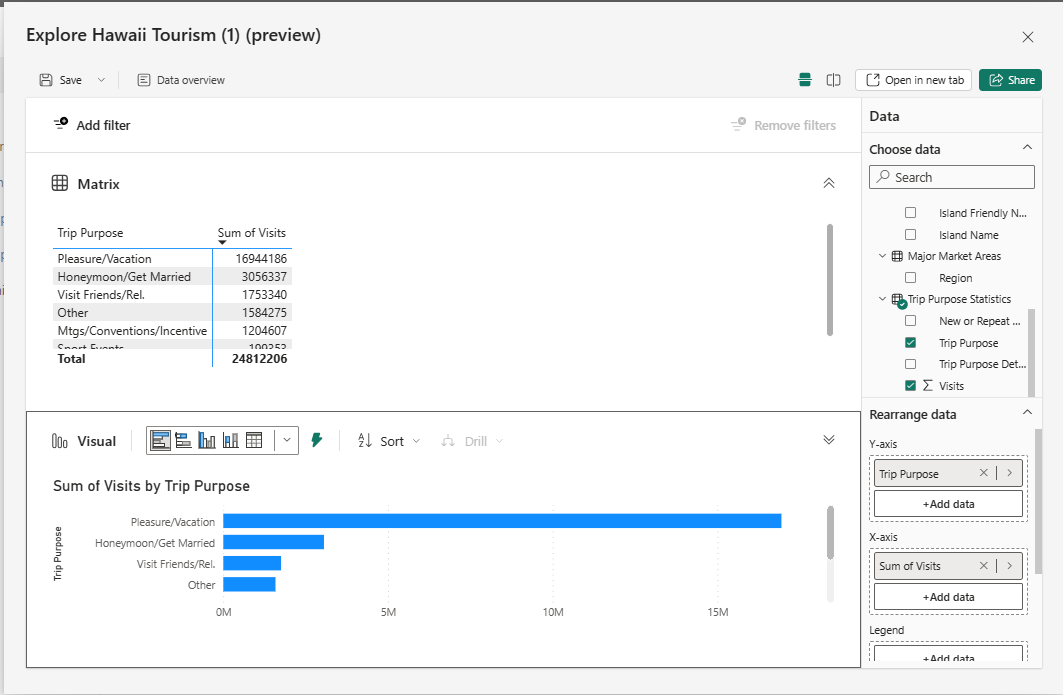 Enables analysis with drill-throughs, slicers, filters, and natural language Q&A. source | Users can explore pre-built dashboards using filters and drills. source |  Through an intuitive interface that includes a graphical query builder, interactive dashboards, and a data browser for navigating databases and tables. source |  Via interactive dashboards, drag-and-drop tools, Beast Mode calculations, dynamic filters, and ad hoc reporting. source |  Viewers can explore data using filters or choose a drill-down path from a complete list of available fields. source |  Viewers can drill down, add filters and view underlying metrics. source | Data Exploration Viewers can sort, add dynamic filter, drill down, and use Luzmo AI to explore data. source | 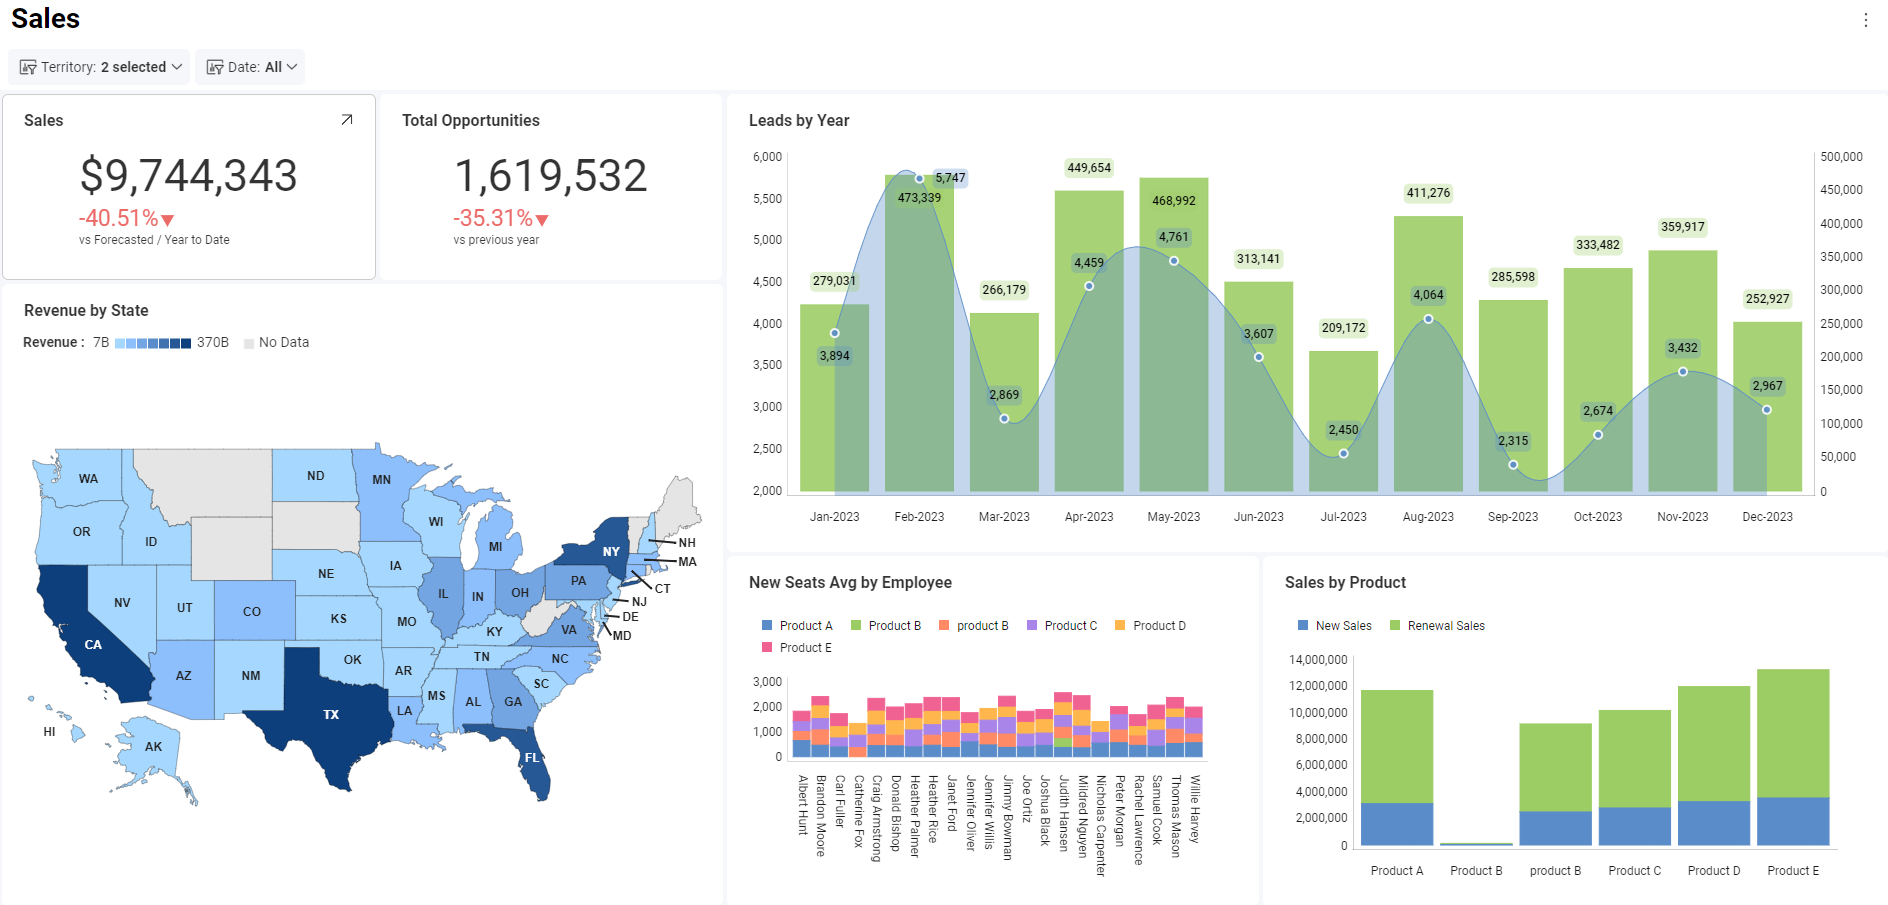 Support configurable filter and dynamic filtering. Viewers are allowed to drill down into data. source |
| | Condition-based automated alerts and Slack/email scheduling. Embedded users can also self-subscribe to scheduled dashboard email deliveries in PNG, PDF, CSV, and Excel formats via Embed Portal. source |  Allow users to set data-driven alerts and schedule report deliveries via email, Slack, or webhooks. source | 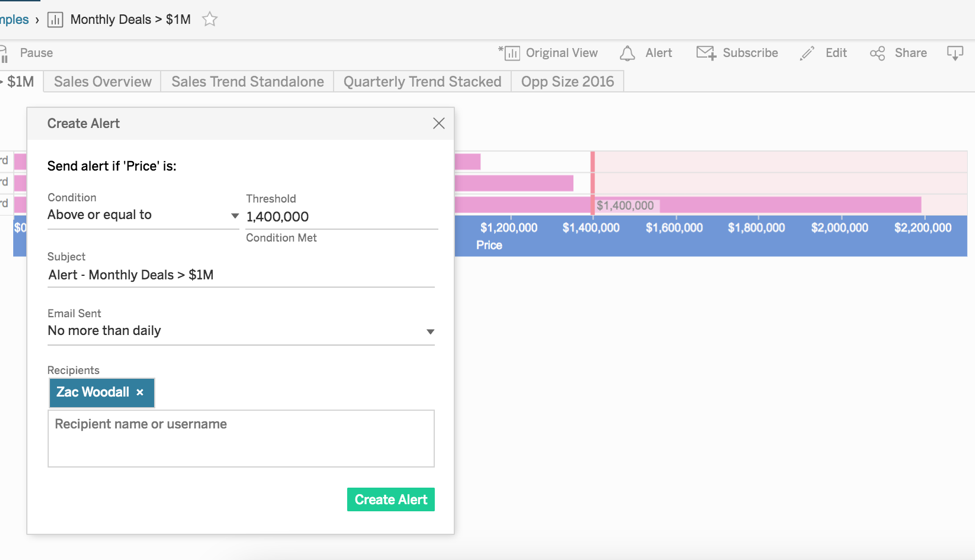 Through data-driven alerts for threshold notifications and automated schedules. source | 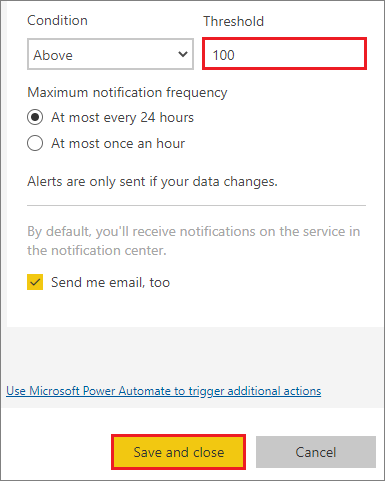 Allows users to set up automated alerts, schedule extract refreshes and report deliveries. source | Through own SMTP Load embeddbale via API and set cron job to send emails via SMTP provider source | 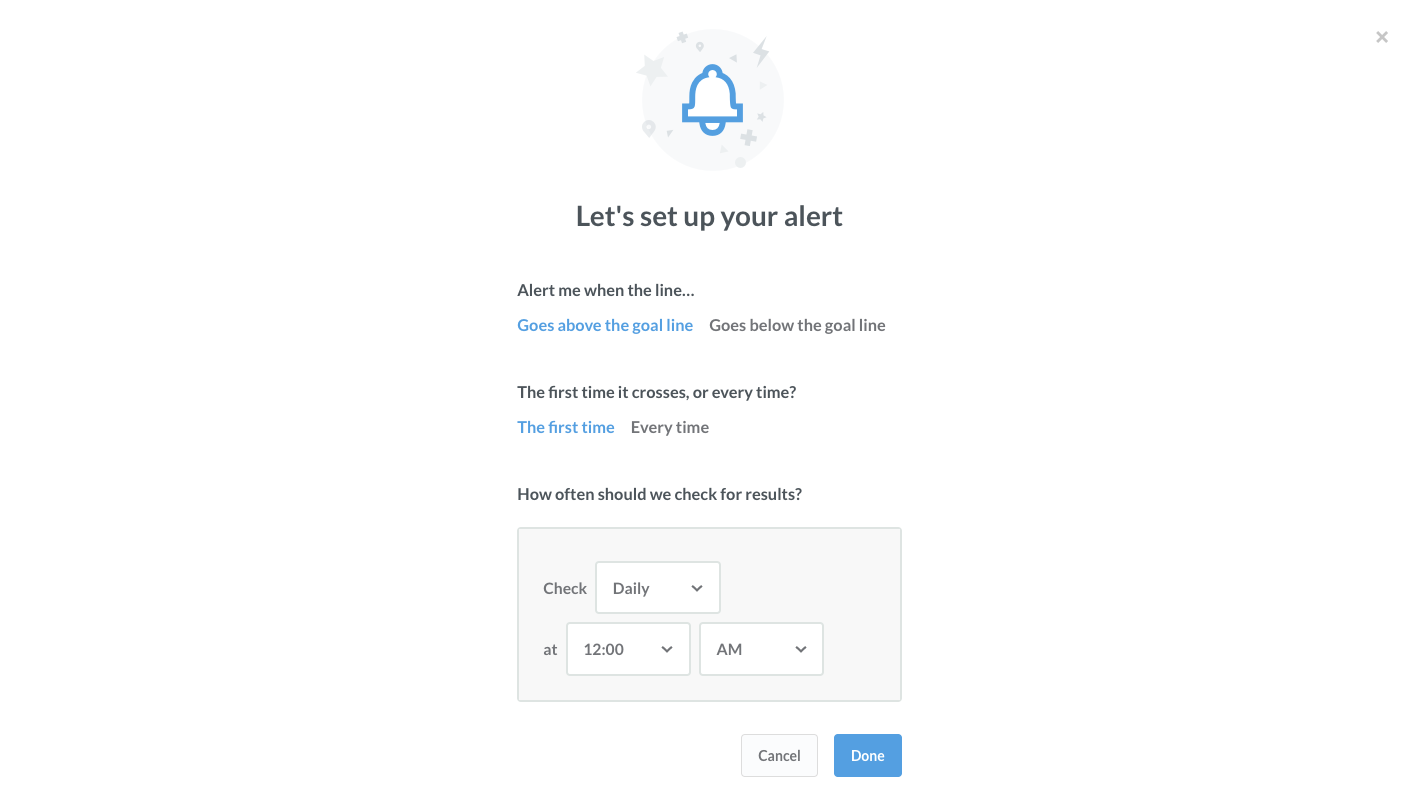 Enables users to configure notifications for specific data conditions, delivering updates via email or Slack at defined intervals. source | ❌ | 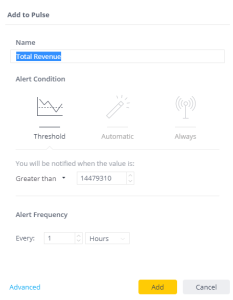 Supports conditional alerts based on data values and allows email scheduling for notifications source | 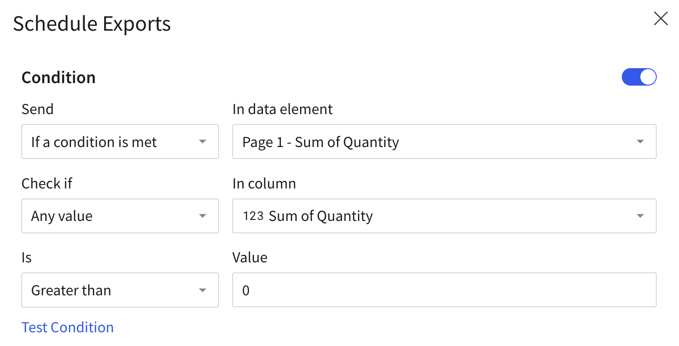 Allow users to schedule an export to send only if specific conditions are met. source | Condition-based Alerts Notify users when a certain threshold in a chart is reached. source | ❌ |
| | Allows developers to embed a mini BI application within your product. Analysts can manage embedded content without engineering involvement. Embed users can explore data, create custom dashboards, and collaborate within their organization with role-based permissions. source | ❌ |  Through Embedded Web Authoring feature that enables end-users to create and modify reports within the embedded environment. source | ❌ | 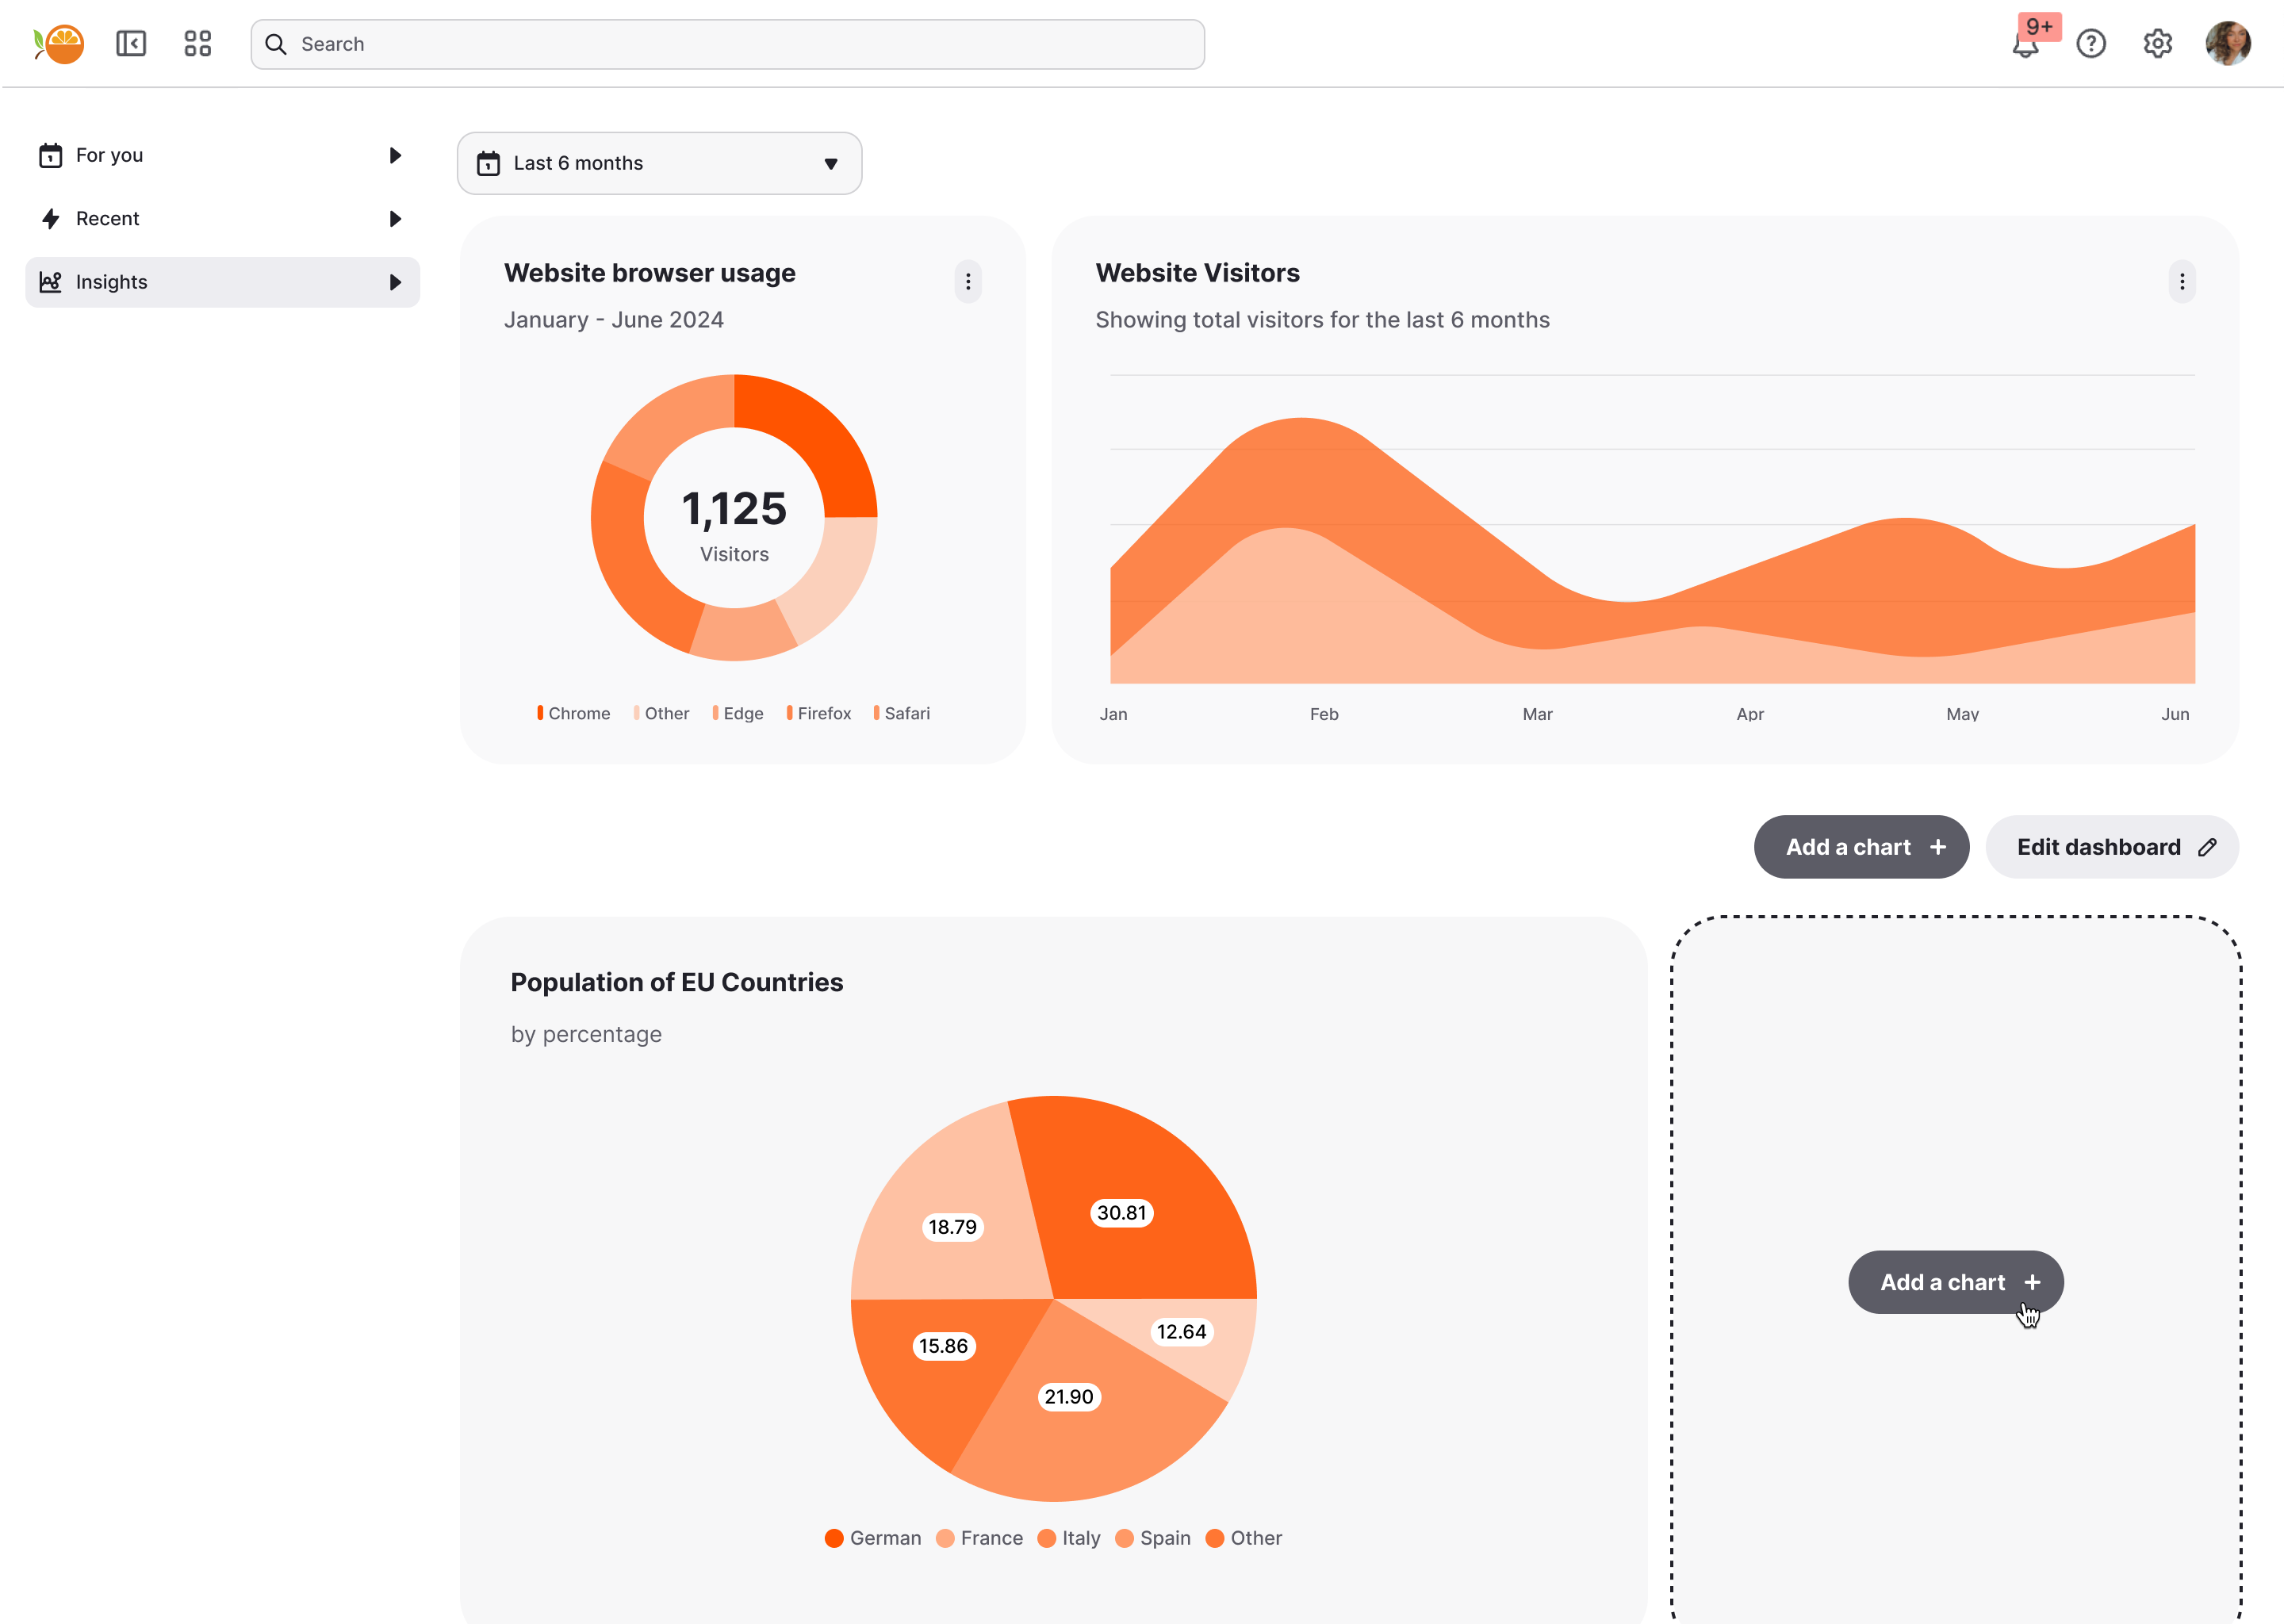 Self-serve feature enables drag, drop, resize, add/remove and dynamic configuration options for builder and end users. source | 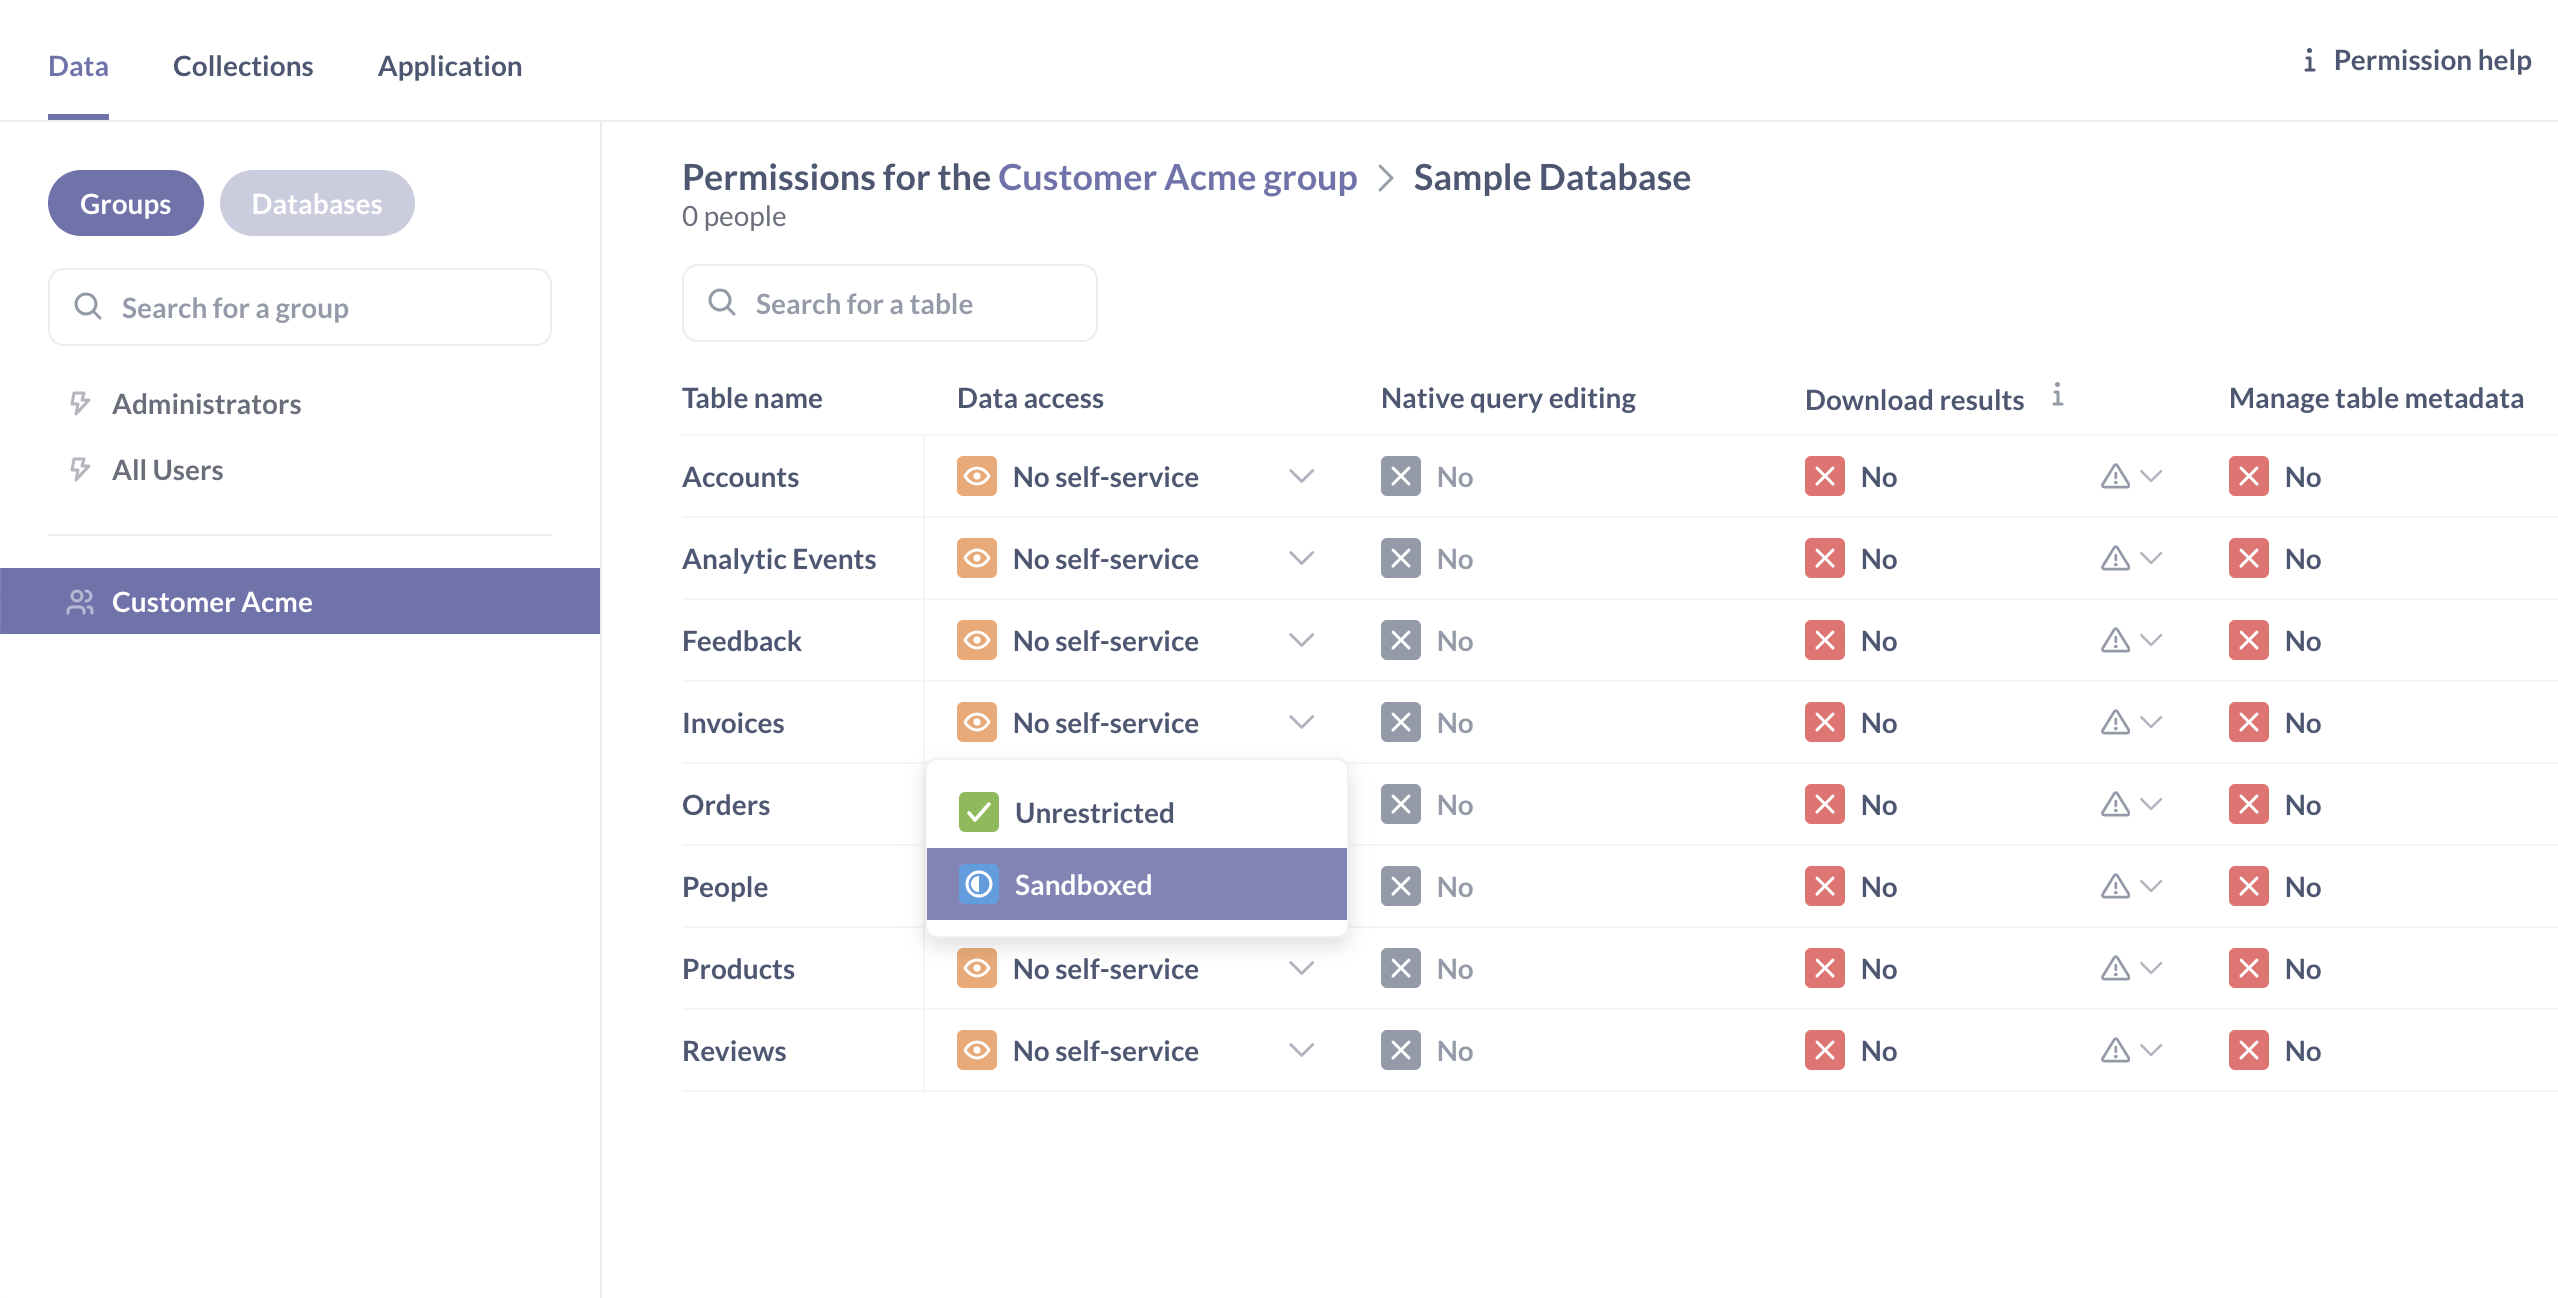 Through Interactive Embedding (Pro and Enterprise plans). source | Embedded Report Builder Supported with Domo Everywhere source |  Basic embedded dashboard editing can be granted to editors, with more advanced use cases available through the add-ons. source |  Available by embedding Sigma Workbooks. source |  The Embedded Dashboard Editor allows end-users to create and modify reports directly within the embedded environment. source |  Dashboard can be configured to support certain capablities of editing, such as adding filter, adding calculation, and visualizations. source |
| Security & Compliance Your embedded BI tools should protect your customers' sensitive data and builds trust by meeting industry security standards. Common security compliance certificates are: SOC2, HIPAA/BAA (for health tech companies), and GDPR. | |||||||||||
| | SOC2, BAA, and GDPR compliant | SOC2, HIPAA, and GDPR compliant | SOC2, HIPAA and GDPR compliant | SOC2, HIPAA, and GDPR compliant | GDPR, SOC2 compliant | SOC2, CCPA, and GDPR compliant | HIPAA, SOC2, CCPA, ISO, GDPR compliant | HIPAA, ISO, SOC2 compliant | HIPAA, ISO, SOC2 compliant | SOC2 & GDPR compliant | GDPR, SOC2 compliant |
| | Servers in US (San Francisco), Europe (Germany), and APAC (Singapore). source | Multiple locations in US, EU, APAC and Middle East. source | Multiple locations in North America, Europe and APAC source | Multiple locations across the world based on Azure regions. Default based on the region of signup. source | US and EU cloud deployment or On-prem source | Information Not Available | Information Not Available | Information Not Available source | Information Not Available | Multiple locations in US & EU | Information Not Available |
| Maintainability Should allow the reuse of analytics logic and components across customers to reduce the maintenance burden for developers and product engineers. Common functionalities to support this are:
| |||||||||||
| | Centralizes business logic in modular, reusable data models, allowing consistent definitions across reports. source | 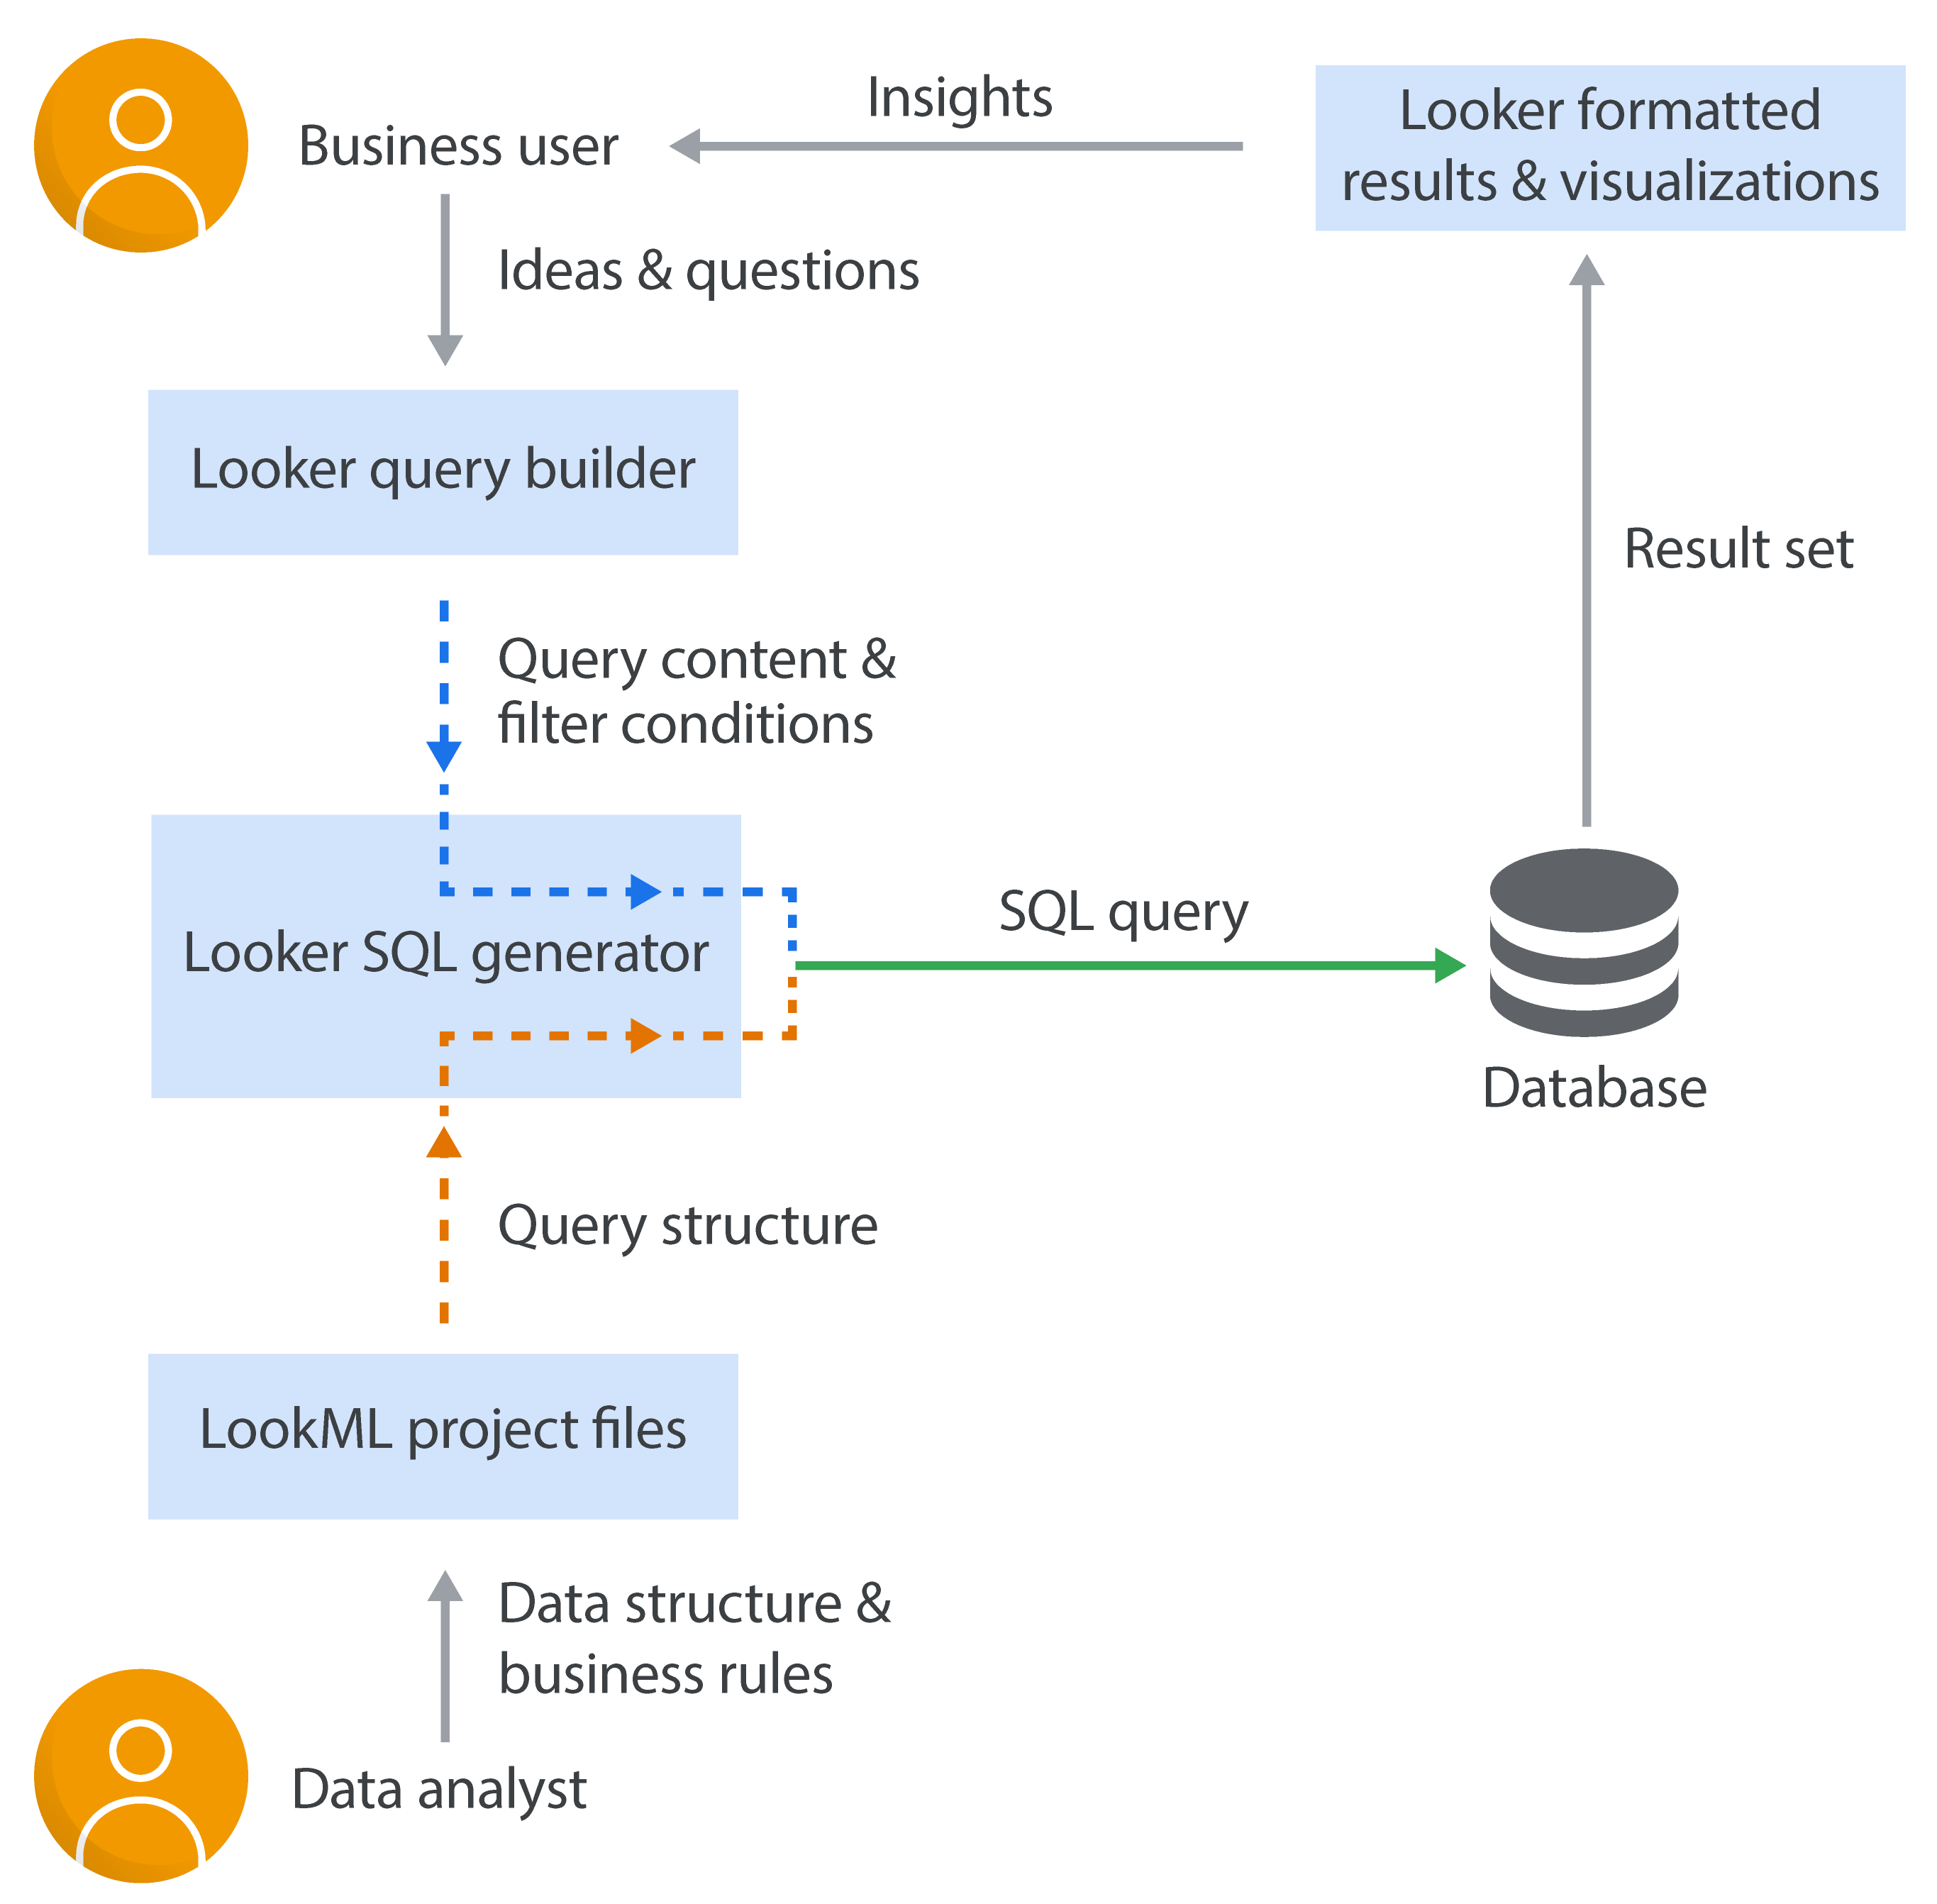 Enables defining centralized, modular data logic that can be reused across reports. source |  Proprietary. Tableau's Logical Layer visually defines relationships and aggregation rules within workbooks or data sources. source | 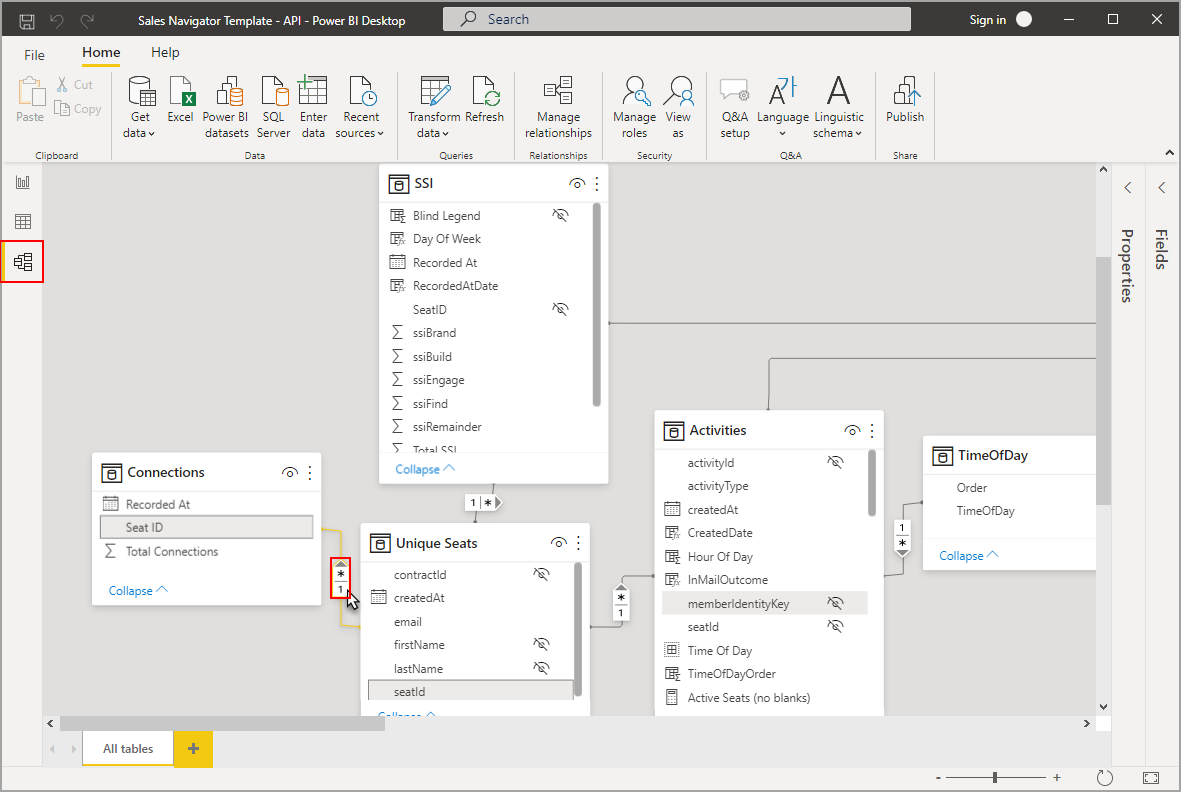 Project-focused and workbook-scoped, using visual interfaces and DAX for defining relationships and calculations. Limited global reusability unless datasets are explicitly shared. source | Hosted Cube.js Embeddable provides a hosted & managed version of Cube or connects to your own. source | 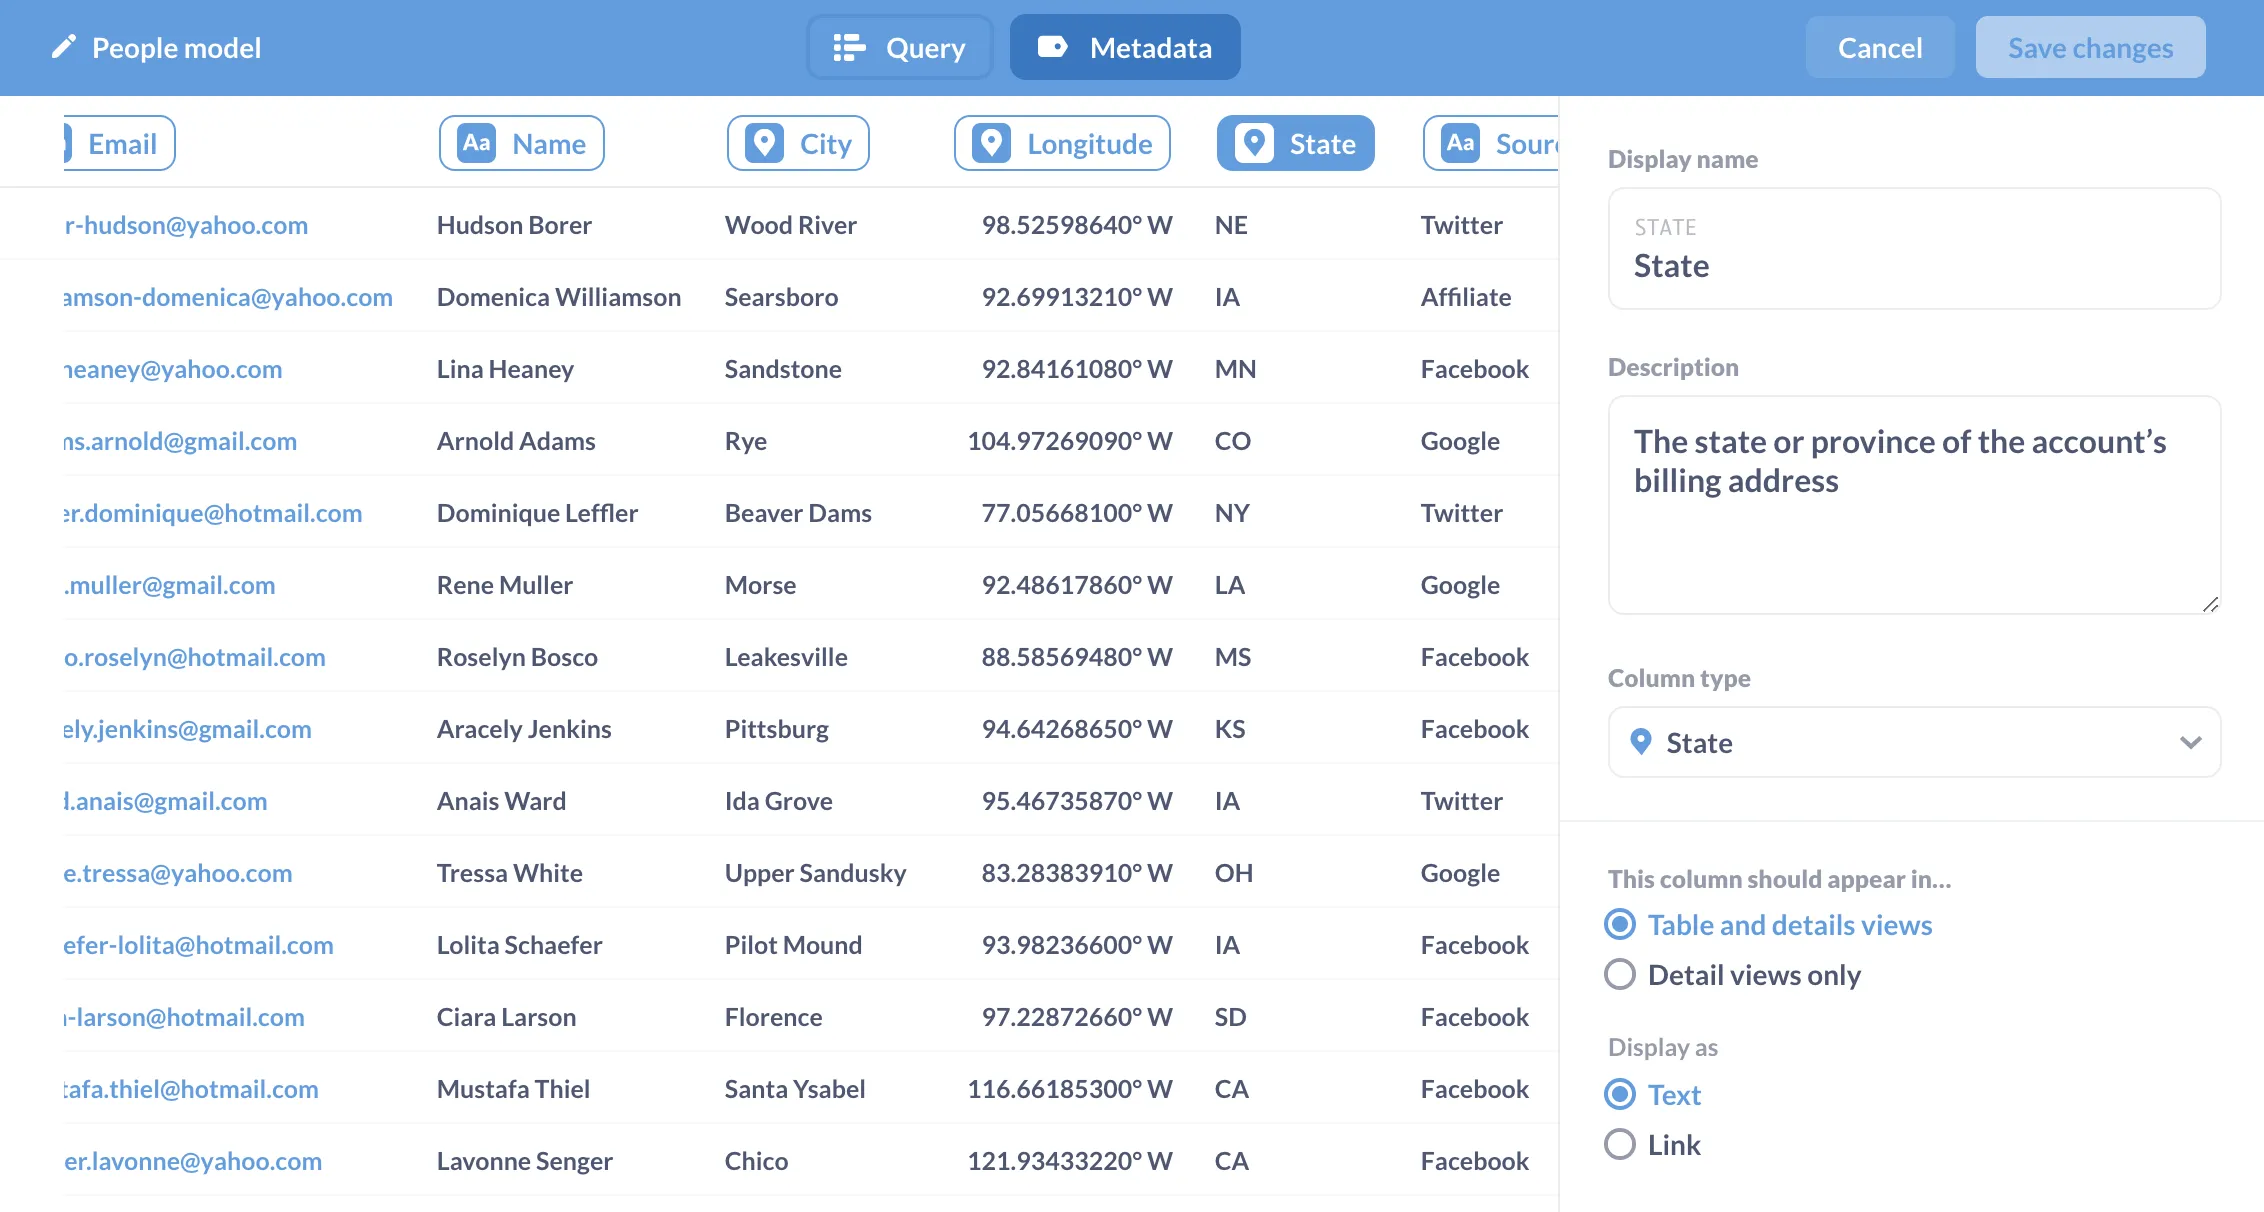 Provides drag and drop ETL, joining datasets, calculated fields and custom metrics. source |  Provides drag and drop ETL, joining datasets, calculated fields and custom metrics, with DataFlows offering flexibility for advanced transformations. source |  Supports flexible data modeling with ElastiCube for in-memory analytics, Live models for real-time queries, B2D for cloud data warehousing, and hybrid models combining both for optimized performance. source | 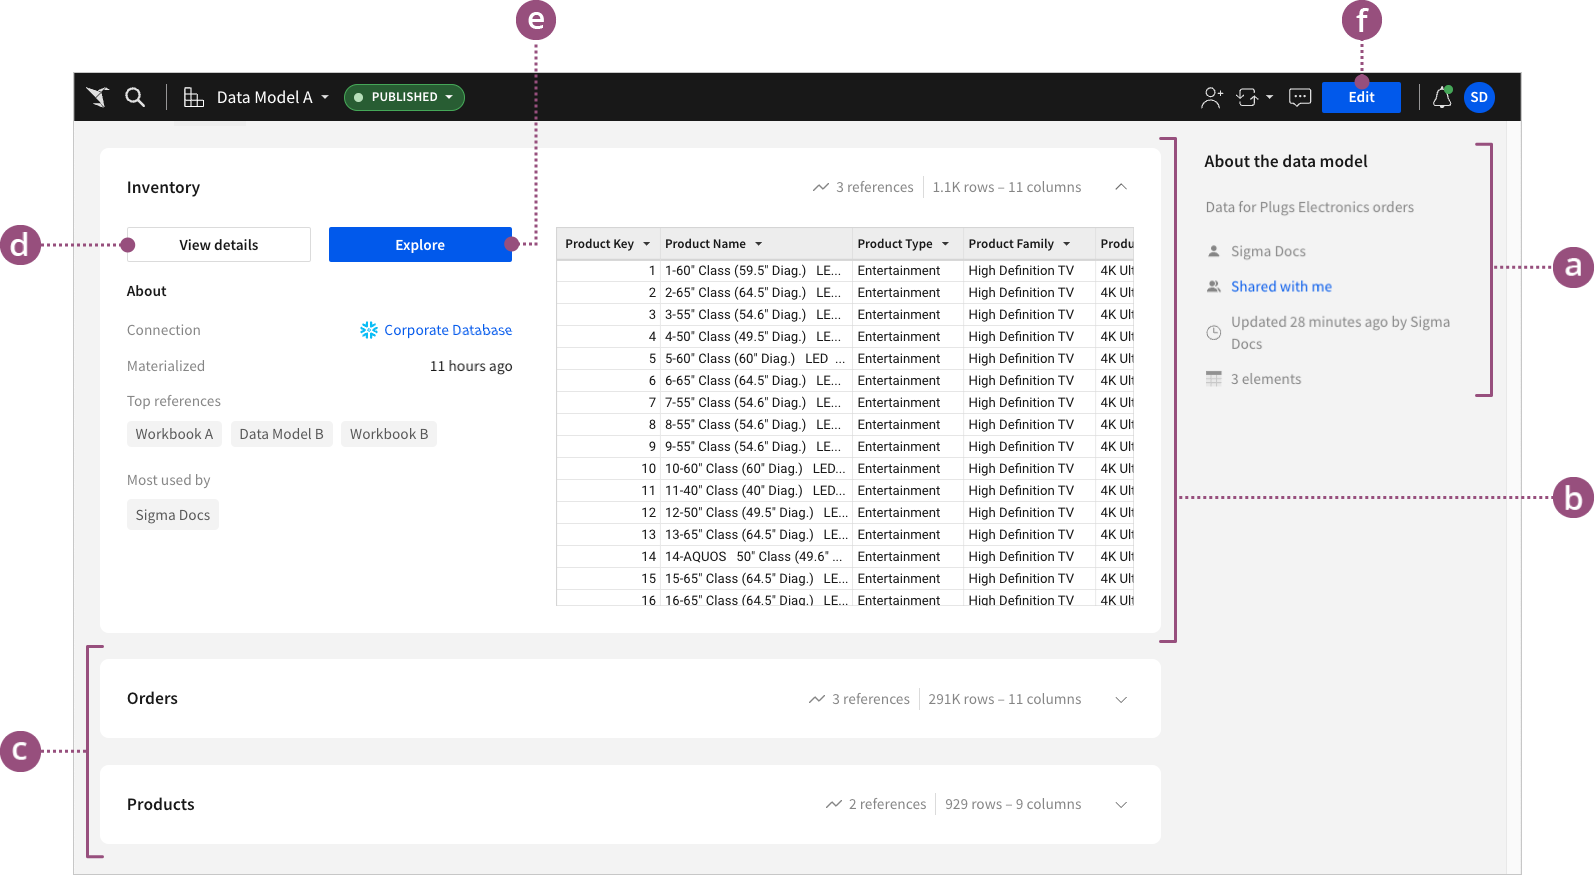 Sigma's Data Models offer a semantic layer for building reusable metrics and centralizing relationships, metrics, and transformations. source |  Support custom aggregation, adding and linking SQL datasets only. source | ❌ |
| |  Define models and dashboards using code, enabling components to be parameterized and reused. source | 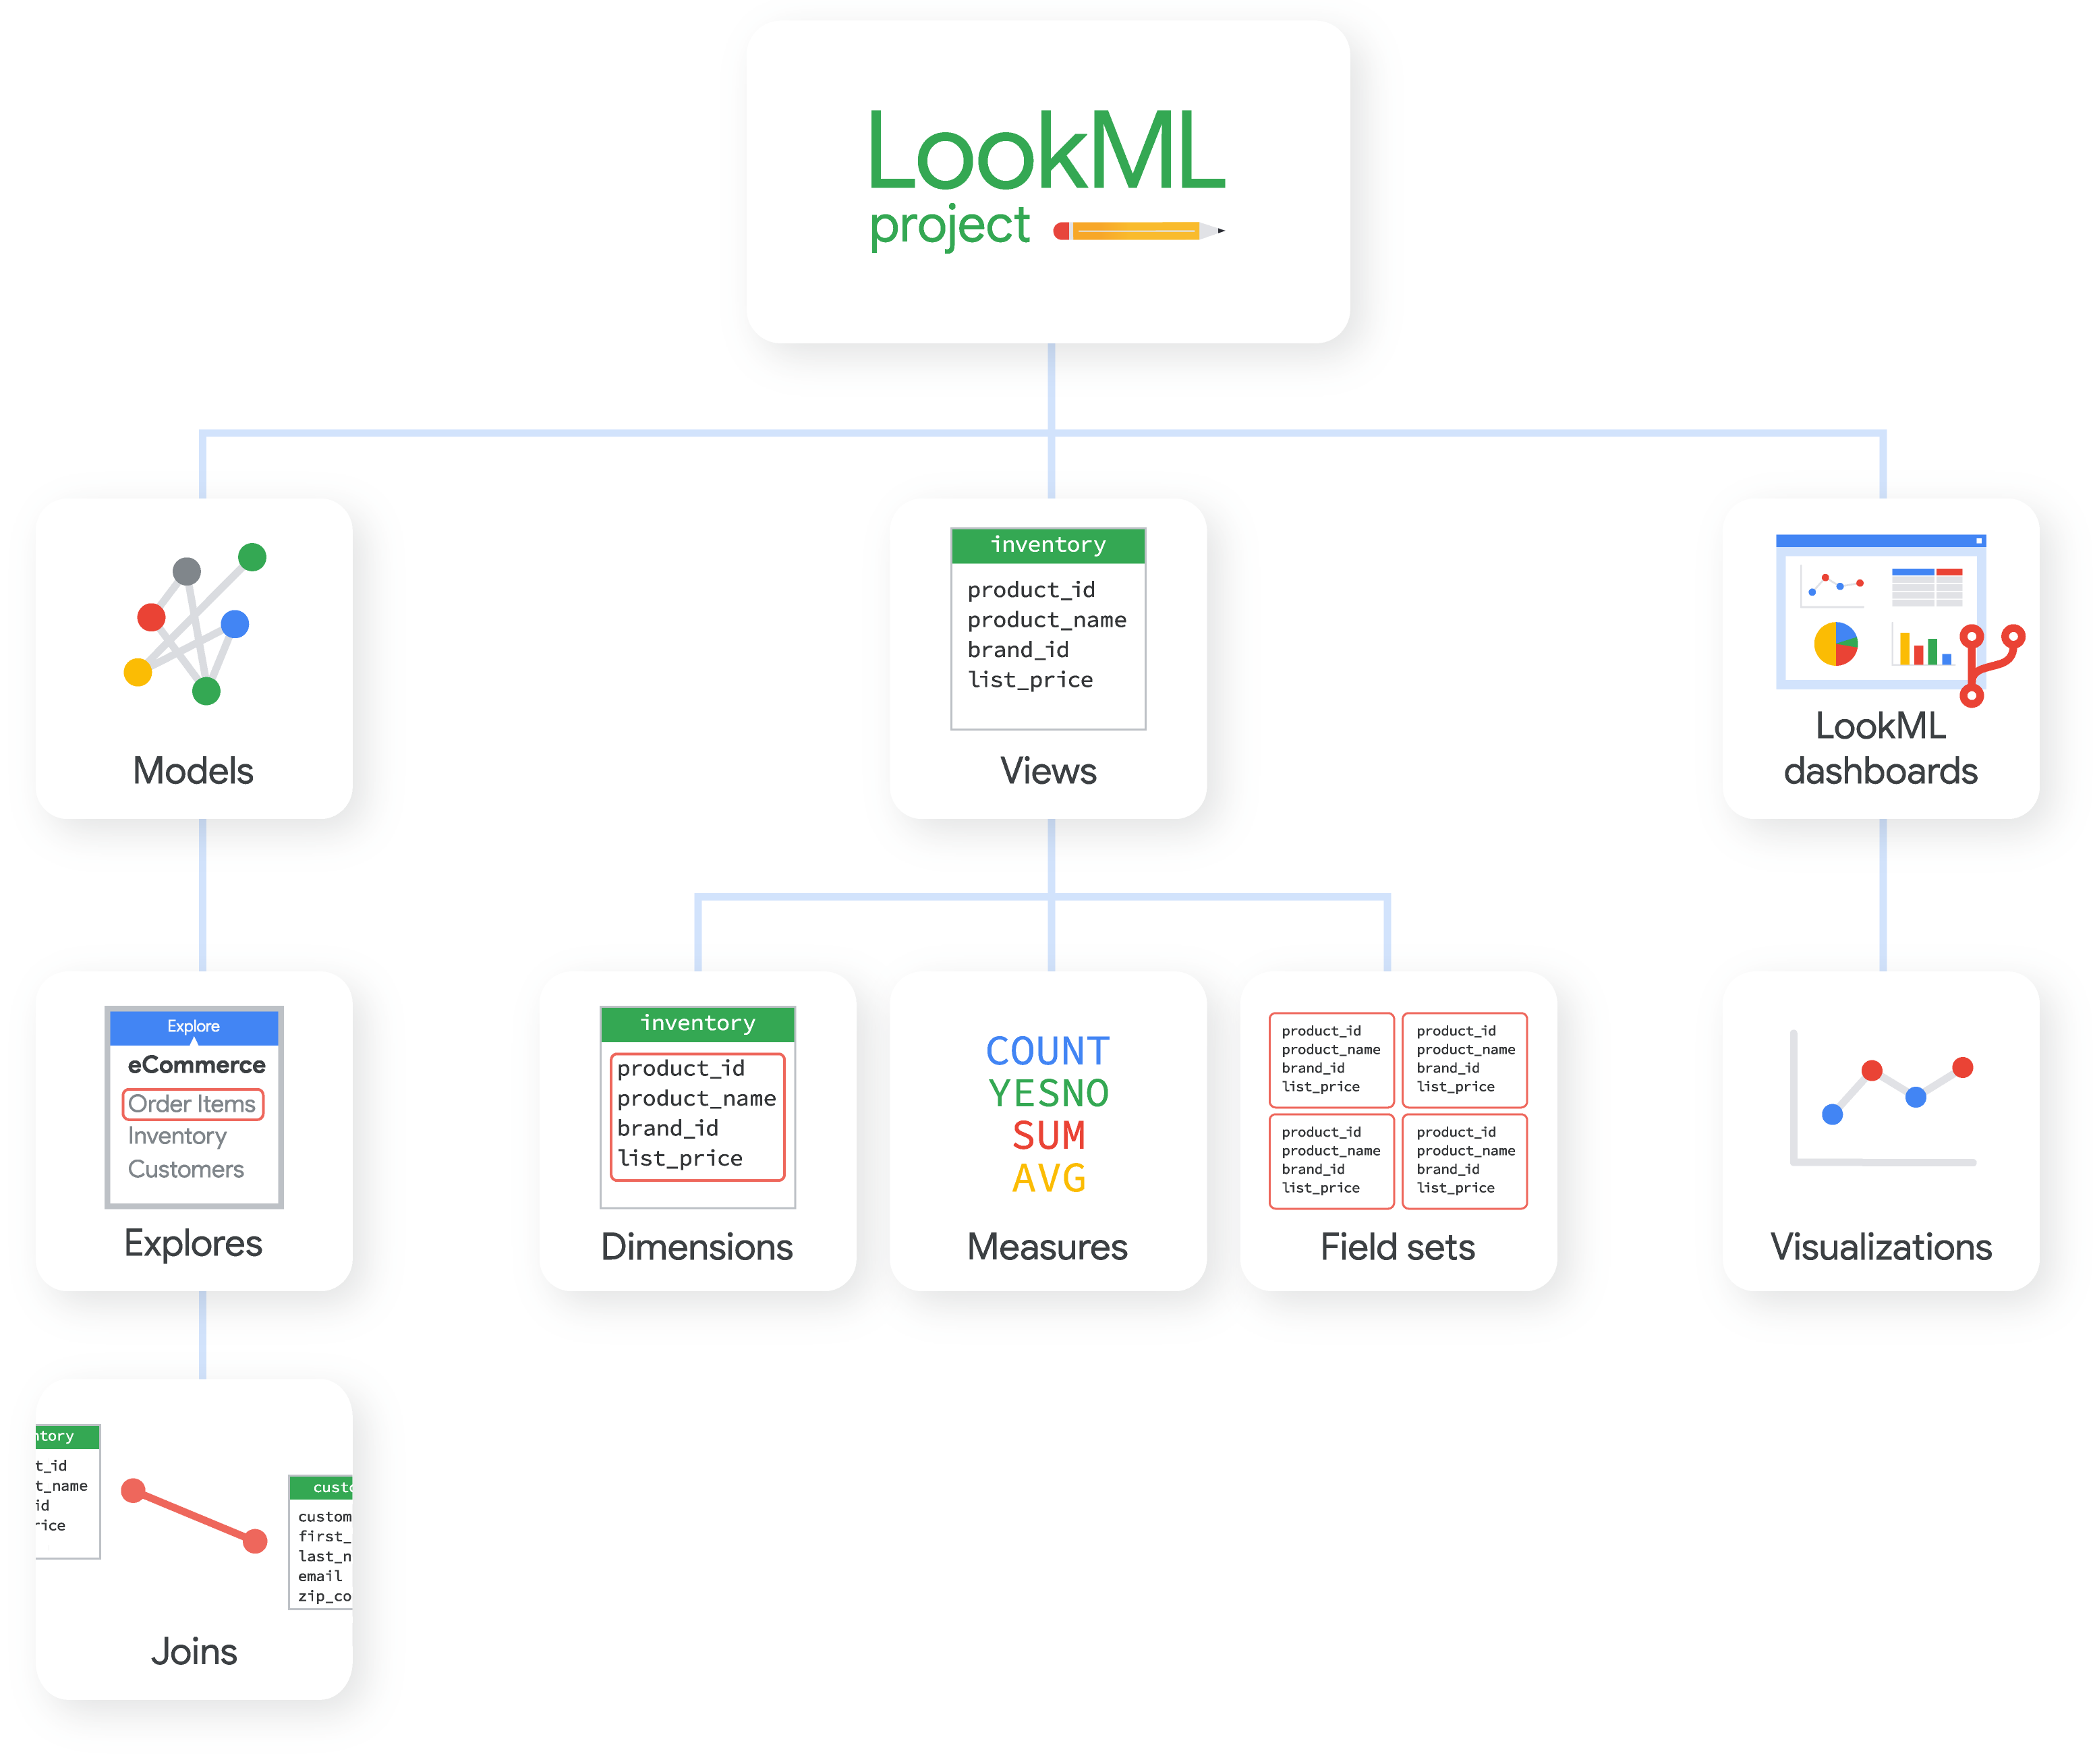 Enables defining centralized, modular data logic that can be reused across reports. source | ❌ | 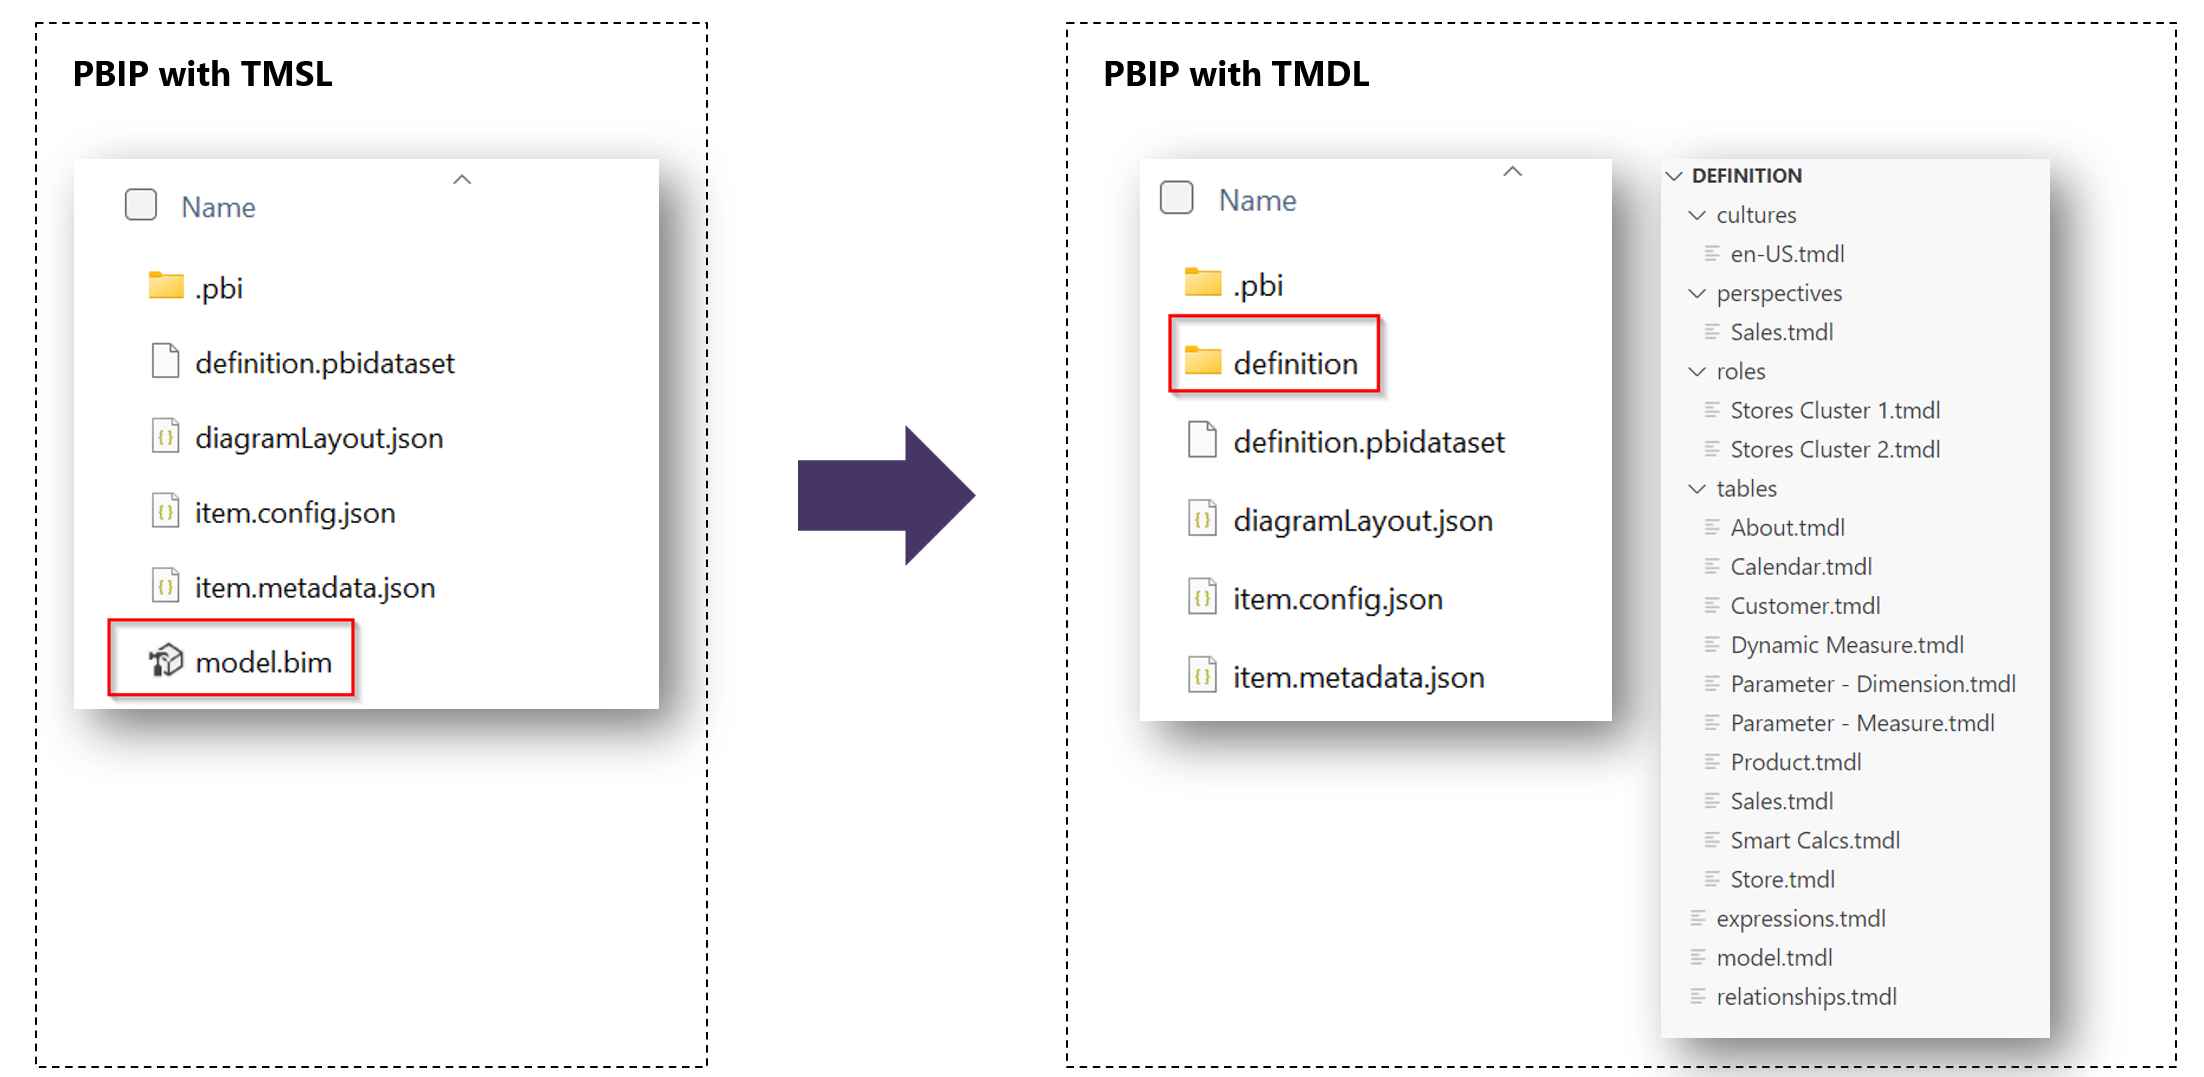 An object model definition syntax for tabular data models at compatibility level 1200 or higher. source | ❌ | ❌ Product not designed to support code-based definition natively. Workaround using Serialization. source | ❌ Product not designed to support code-based definition natively. source | Supported via Javascript format Enables UI customization with JavaScript and the add-on frameworks, allowing developers to script lifecycle events to adjust styles, data, and queries source | ❌ |  Allows data team to code custom analytics products directly in the app. source | Partially Supported Dashboard is saved in proprietary format, but its configuration and how it should be rendered in the client, can be coded. source |
| |  Support Git version control natively for both dashboards and models. Multi-environment support enables dev/staging/production workflows with Git-synced analytics code across isolated environments. source | 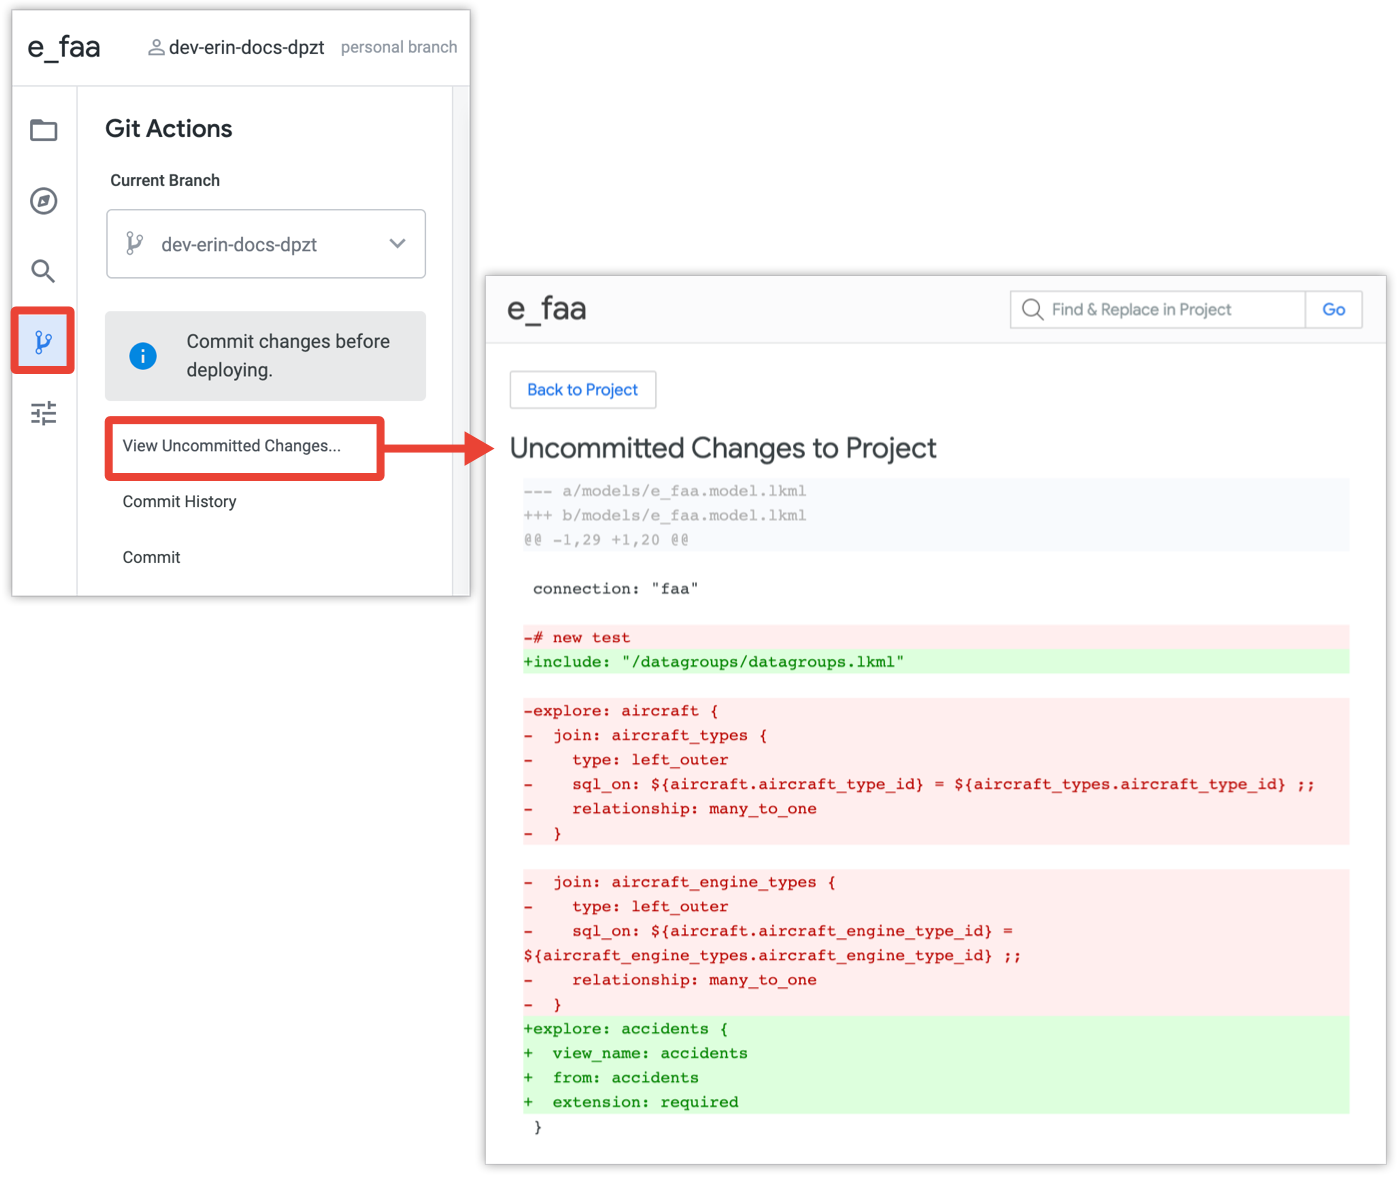 Git-based version control for data models, proprietary dashboard versioning. source | 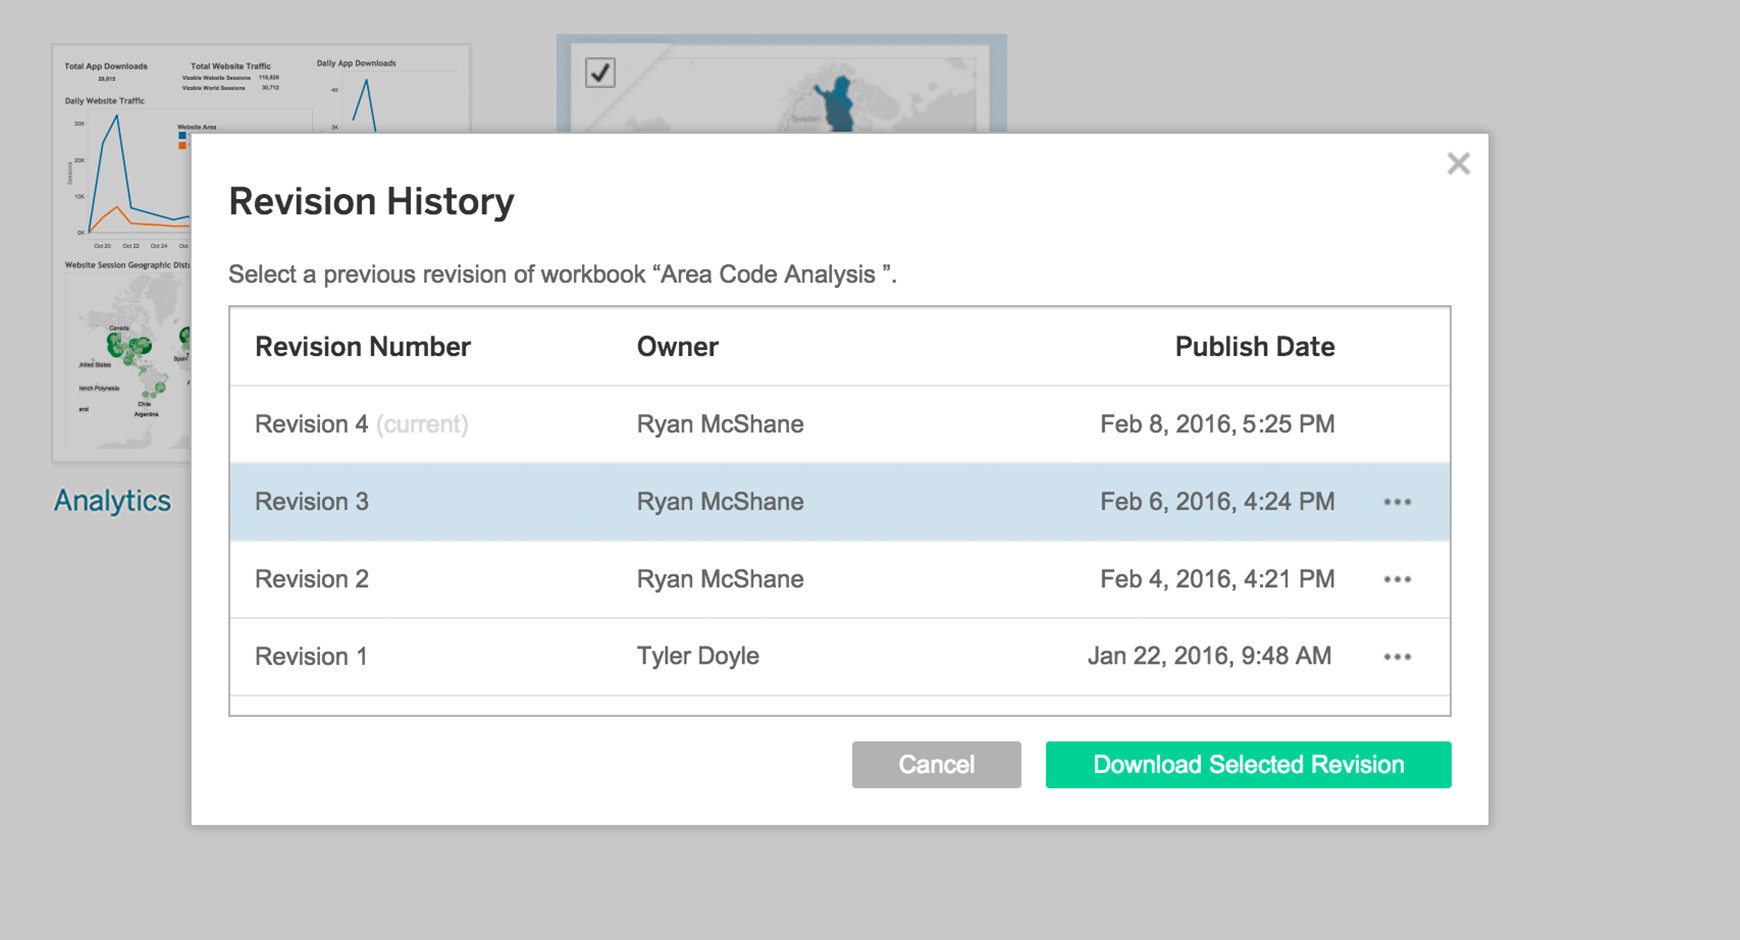 Supports version control indirectly by relying on Tableau Server or Tableau Online to maintain revision histories of published workbooks. source | Proprietary Version Control No native Git integration. But new text-based format (TMDL) makes it easy for developers to set up manual integration with Git version control. source | Version History Chart definitions in Git, dashboard versions in-builder, deployment versions in Git and available via API. source | 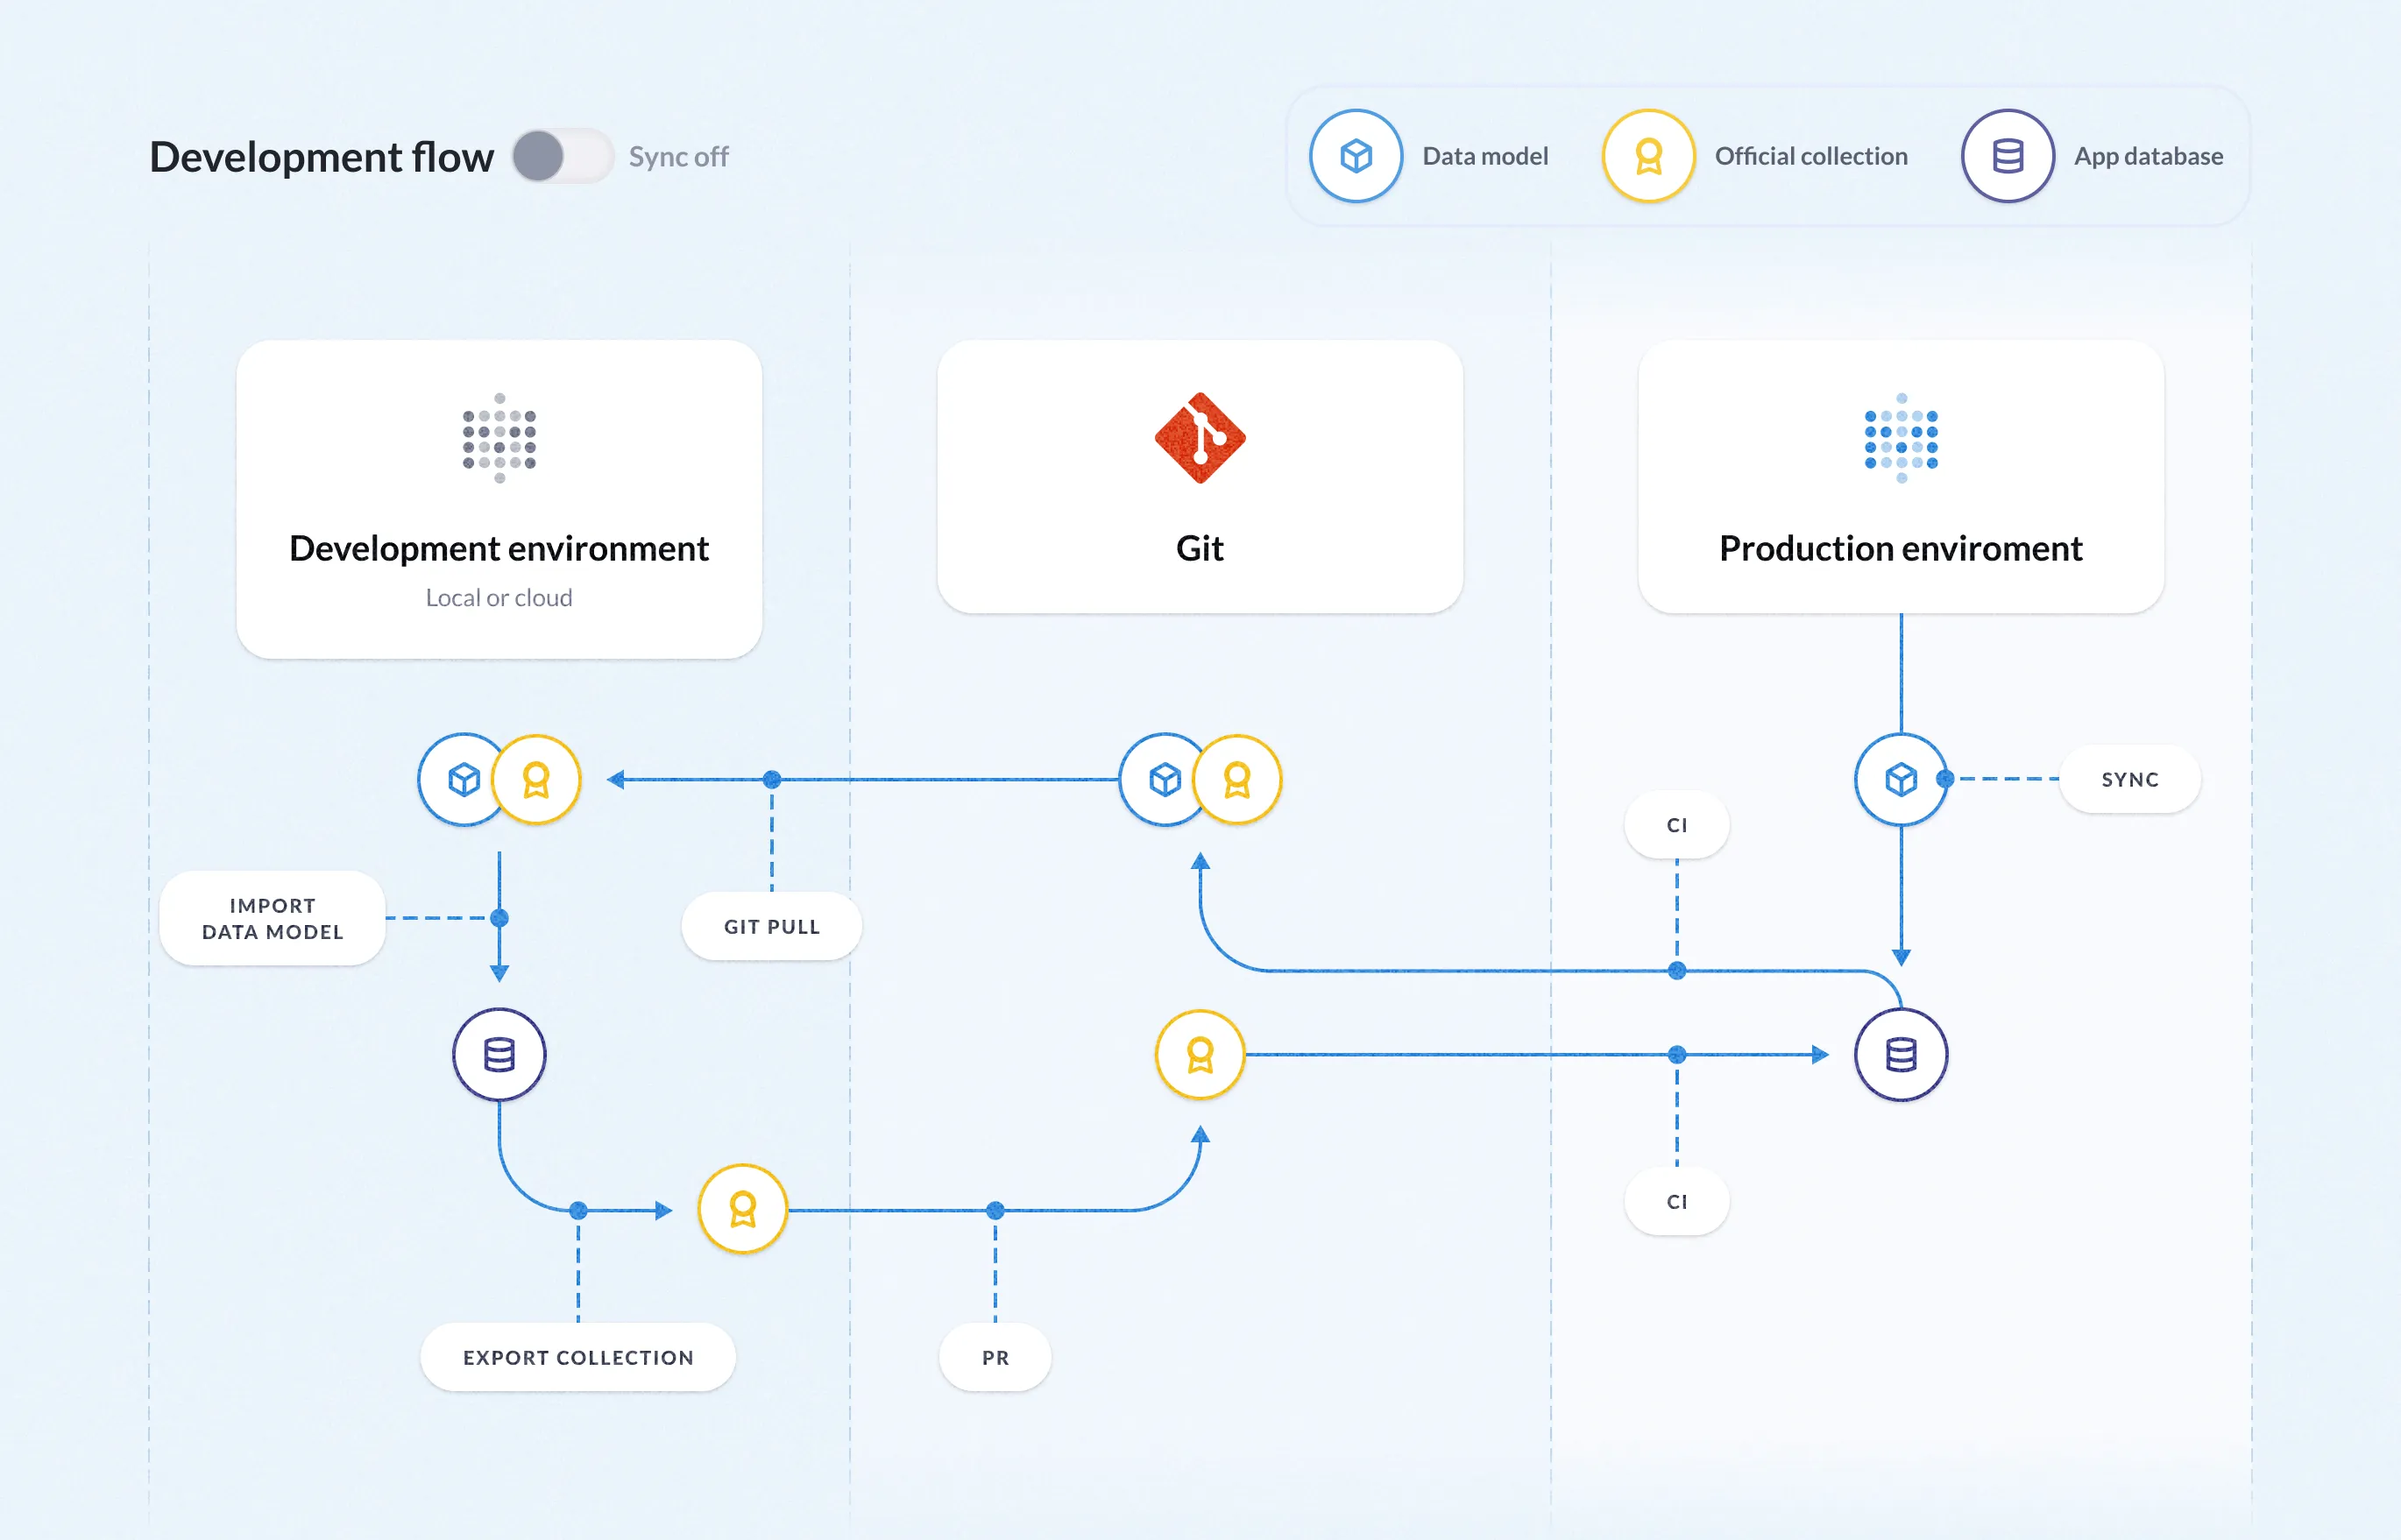 Proprietary. Allows one-way Git-based version control through Serialization, available starting with the Pro Plan. source | Proprietary Version Control Proprietary. Pro-code Editor and Card Details supports non-git based version control. source | 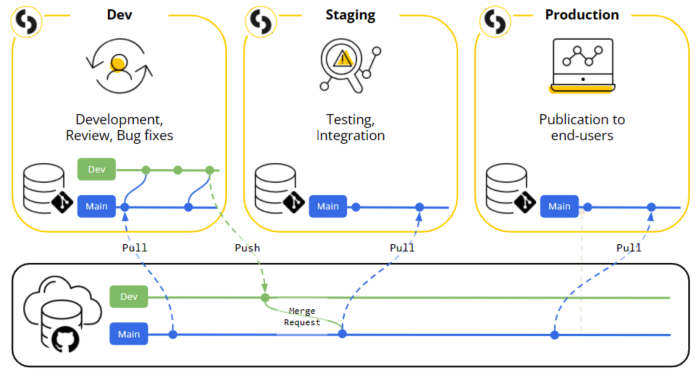 Git integration in Sisense allows for version control of assets through JSON-based file representations. source | 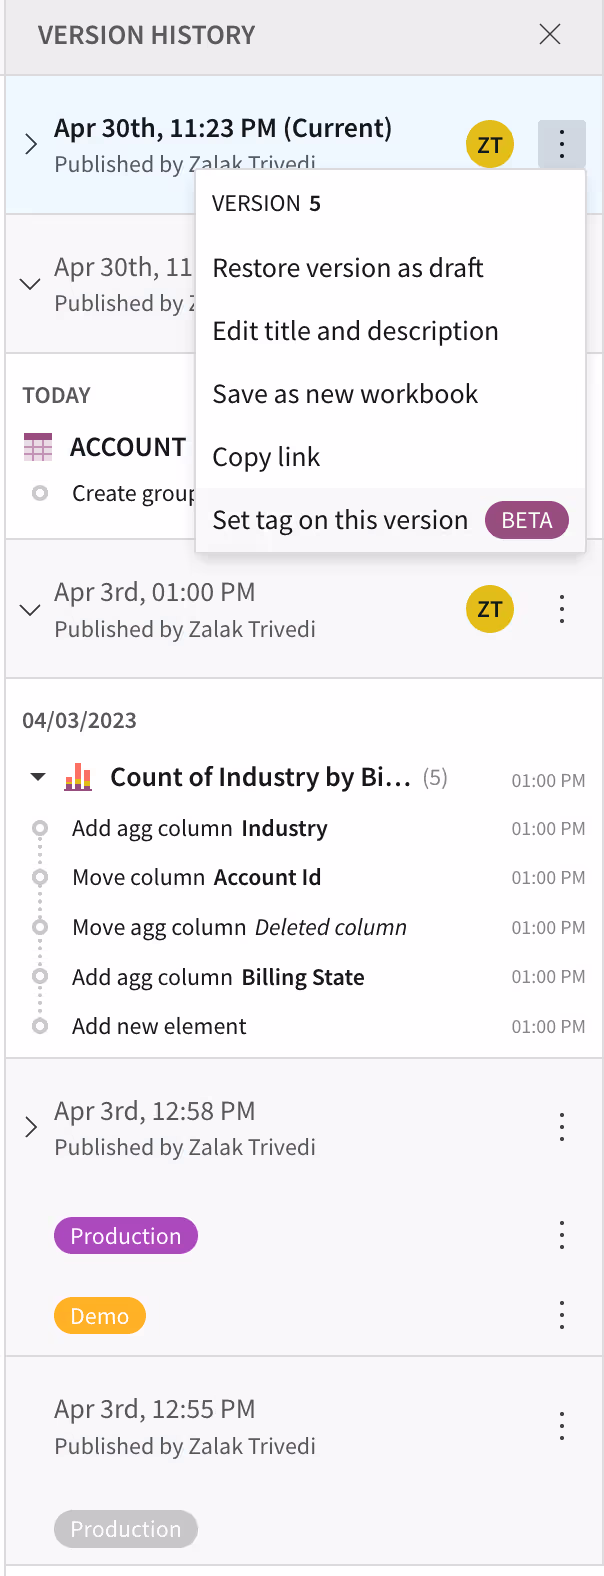 Proprietary version control. Allows users to manage, control, and organize multiple iterations of workbooks via Version Tagging. source | Version History Non-Git based version control. Support publishing and restoring dashboards through version history. source | Limited Version Control Embedded dashboard configurations can be coded and stored in version control system like Git. source |
How to choose an embedded BI tool
We’ll provide a detailed explanation of each evaluation criterion, including subtle nuances you might have overlooked in the comparison table.
Author's Note: When looking into popular embedded BI tools, we learned that most vendors offer similar features and check the same boxes. While many BI solutions meet the core criteria to some extent, the real difference lies in the details. For instance, most BI tools claim to support embedded analytics, but does that merely mean basic embedding, or do they also provide advanced features like dynamic data sources, embedded report builder, or custom look and feel? It's important to assess the depth of each capability rather than just its presence (hence the comparison table above).
1. Embedding Methods
Embedding methods affect the customizability of your embedded apps. Typically with higher customization, the tradeoff is higher development effort.
Common embedding methods are:
- iframe: Embeds a pre-built dashboard or report into your app using an HTML iframe tag.
- Web Components: Embeds analytics using reusable HTML-based components that work across frameworks and libraries.
- API integration: Uses APIs to fetch and render data dynamically, allowing custom-built dashboards within your app.
- SDK: Provides a software development kit (SDK), often in a specific programming language or framework (e.g., React SDK), to integrate and customize analytics.
Embedding methods affect the customizability of your embedded apps. Typically with higher customization, the tradeoff is higher development effort. You should evaluate embedding approaches (and embedded analytics vendors) based on your app's architecture, required level of customization, and available development resources.
| Method | Best For | Potential Limitations |
|---|---|---|
| iFrame | Quick, simple embedding needs | Limited customization, slower performance |
| SDK | Feature-rich, tighter integration | Complexity, dependency on vendor updates |
| API | Full control, seamless experience | High development effort and maintenance |
| Web Components | Reusable, and encapsulated | Moderate effort |
2. Pricing Structure
For a detailed breakdown of what embedded analytics vendors charge, see our embedded analytics pricing guide. Most embedded BI tools offer one of the following pricing structures:
- Seat-based pricing: Pricing by embed viewers
- Platform pricing: One fixed price (usually quoted and negotiated) for unlimited viewers
- Usage-based pricing: Pricing by some usage metric like report runs or active sessions
Additionally, there might be pricing based on feature tiers, and some vendors may offer discounted pricing for your POC period. When evaluating embedded BI tools, consider those with pricing that meets these criteria:
- Easy to start with when doing experimental POC
- Not becoming prohibitively expensive as more users onboard.
3. Look and Feel
White-label analytics is a core requirement for most embedded use cases. Your embedded BI tools should allow developers to maintain a branding consistency, deliver customized dashboards, and cater to diverse visualization needs. When evaluating, look into the level of customization for colors, fonts, and layout. Assess the variety of chart types and their customizability.
4. Performance
Tools should ensure reasonable performance, and should scale well with increasing viewers and data volumes. There are typically 2 methods that affect report performance:
- Caching: Embedded vendors load data into their own caching layer to speed up serving of reports.
- Direct Querying: BI tool querying your database/data warehouse directly.
5. Embedded Report Builder
This is where embedded dashboards become customer-facing analytics. Embed viewers should be able to customize and build their own reports based on a predefined set of data dimensions and metrics. Viewers should also be able to interact, download, and share custom reports with other embedded viewers.
When evaluating embedded bi tools, you should:
- Assess the depth and flexibility of self-serve features like filtering, drill-through, drill-down, grouping, and visualization options.
- Look for embedded report builders and assess how easily users can build reports within the embedded environment. The report building UI should be intuitive enough for non-technical users, while still offering sufficient flexibility for power users.
- Check for intra-org dashboard sharing capabilities. Admins should control who can view, edit, or manage dashboards, restrict visibility by user roles (e.g., Viewer, Analyst, Admin), and limit sharing links to specific teams or departments.
- Evaluate whether the tool offers AI-powered conversational analytics that allows embedded users to explore data using natural language, reducing the barrier for non-technical users.
6. Security and Compliance
Your embedded BI tool Should protect your customers’ sensitive data and build trust by meeting industry security standards. Common security compliance certificates are:
- SOC2: Ensures systems are designed to protect data privacy and security, fostering trust in your service.
- HIPAA/BAA: Required for health tech companies, this ensures compliance with healthcare data protection standards.
- GDPR: Protects personal data for EU users, ensuring compliance with strict privacy regulations.
7. Permission & User Access Control
Embedded analytics tools should ensure each customer can only see their own data and prevent unauthorized modifications. This is called multi-tenancy. Most embedded BI tools support the basic version of this capability.
When evaluating, look for:
- Column-level access control: This allows administrators to restrict access to specific columns within a dataset based on a user’s role or permissions. For example, a sales team might see only aggregated revenue data, while the finance team gets access to granular transaction-level details. This fine-grained control ensures data privacy and relevance at all levels.
- Dynamic data sources: This feature points charts to your clients’ respective data sources dynamically to serve similar needs across multiple clients without duplications.
Look into permission levels (e.g., column-level access, row-level access, passsword-protected sharing) and ensure permission settings are intuitive.
8. Maintainability
We think embedded BI should allow the reuse of analytics logic and components across customers to reduce the maintenance burden for developers and product engineers. Common functionalities to support this are:
- Semantic layer to allow engineers to define reusable, centralized metrics. A semantic layer ensures consistent metrics across all tenants — see how tools compare in the semantic layer comparison guide.
- The ability to define logic, metrics, and dashboards using code language (analytics as code).
- 2-way integration with Git version control.
- Multi-environment support (dev/staging/production) for safe testing of analytics changes before deploying to production.
What do users say about embedded BI?
Discover what other practitioners are discussing about this topic.

r/BusinessIntelligence
Posted on Feb 2025 View source
Best embedded BI analytics tools
We're a b2b SaaS application focused on finance/accounting. Looking for an embedded analytics solution to do our front end data viz. All of our data is stored in mySQL hosted on Amazon RDS.
Demoed Sigma today and it looked very comprehensive but I'll of course take it with a grain of salt since they seemed to have the demo very well scripted.
Also looked into Explo. Not as friendly of a UI IMO but overall seemed like it was a similar solution. The one thing I like about Sigma over Explo is that you can more easily manipulate data where in Explo you need to be good with SQL.
2top comments
r/BusinessIntelligence
Posted on Oct 2022 View source
Best BI tools for Embedded Analytics
What is the best BI for embedded analytics? The answer is probably subjective, but I'm curious to know what tool I'd need to pick if a company is building customer facing embedded dashboards.
2top comments
This is an interesting topic with no straightforward answer. There are a lot of factors involved with a decision like this:
• Where does your data live? If you use Google cloud services, you may get better deals/have an easier time using a Google BI product, etc.
• What OS do you and your company primarily use? If most people use macOS, then PowerBI is not a good option for you.
• What is your budget?
• What level of devops and data engineering support will you have?
There are open source tools that work well, but the setup and support might require a lot more engineering on your end. PowerBI is popular but a pain to use on macOS. Tableau/Looker/etc offer user control and embedded functionality built into their software, but the cost of user licenses can get very expensive depending on how many customers you have.
You might want to take a look at Holistics.io. It's a cloud-hosted, SQL-first BI platform with strong support for version control (Git) and a software dev workflow (CI/CD, dev/prod environments). The platform is highly programmable, and we offer pixel-perfect dashboards for precise reporting.
We also have usage-based pricing (not user-based) and built-in email/Slack report scheduling. If you're considering alternatives to PBI or Qlik Sense, Holistics could be a solid fit for embedded analytics.
Check out the playground: https://hooli.getholistics.com/
r/BusinessIntelligence
Posted on Nov 2024 View source
Which embedded BI platforms?
Hi, we'd like to offer interactive dashboards for our customers. Each project will be quite unique, we need a solution that allows us to
1top comment
Metabase does all the things you list (I work here) https://www.metabase.com/product/embedded-analytics
Based on your requirements and the approx. number of clients needing access, I'd say <$10k is very realistic.
We just recently added an option to use Metabase with built-in storage, so you can also continue working with your data in excel.
r/BusinessIntelligence
Posted on Feb 2022 View source
Which is the best embedded analytics platform for multi single-tenant databases?
Hi all, I'm currently researching for an embedded BI tool for my company use case. We need to provide user-facing analytics to our customers (OOTB dashboards + self-serving capabilities).
1top comment
Hello! I'm a domo consultant and I have a client with an extremely similar use case - they're a software company who embeds Domo into their product and gives their customers more reporting using an embedded Domo. They sound extremely similar, they don't have a giant team but do most of the work themselves but reach out to us when they have questions. Only downside is the data refresh depending on how large/complex your data is, 15 mins is the standard refresh time. Happy to setup a quick phone call if you want to know more!
r/BusinessIntelligence
Posted on Apr 2024 View source
Qlik for embedded analytics
I searched far and wide but found nothing. I know how most people feel about Qlik, but what about using it for customer-facing analytics?
1top comment
Totally get your interest in Qlik for embedded analytics, but if you're open to alternatives, I'd suggest checking out Holistics.io (I work here).
Easy Embedding: You can embed interactive, pixel-perfect dashboards into your application with just a few lines of code. It's designed for a quick setup, usually taking only 30 minutes to an hour.
User Experience: Users can drill down into data and perform ad-hoc analysis, giving them more control and insights. Additionally, our unique canvas layout allows you to create beautiful, customized dashboards that match your application’s look and feel.
Pricing: We offer usage-based pricing, which can be more cost-effective compared to flat fees or consumption-based models, especially as you scale. You get unlimited users and only pay based on consumption.
Check out the playground and experience it for yourself: https://hooli.getholistics.com/
r/BusinessIntelligence
Posted on Oct 2021 View source
Embedded analytics software for the modern data stack
tl;dr: Questions: Which providers would you recommend / what is your experience with them and does it make sense to combine the BI tool with the embedded analytics solution?
1top comment
Probably late to the game, but you can check out Holistics.io (I work here).
• Version control with Git. Support software development process (CI/CD, dev prod environment, etc)
• Nice visualizations and flexible dashboarding
• Self service analytics
• Entire platform very programmable, you can do programming stuff with it
• Cloud-hosted
• Usage-based pricing instead of user-based.
• Email/Slack report schedules
r/tableau
Posted on Apr 2023 View source
Tableau embedded analytics cost
My goal is to embed a tableau visualization I made from my tableau server onto my website and allow anyone who comes to my site to be able to view it. I have a tableau server creator's license and when I try to add the embed now, it works perfectly for me, but for everyone else, it wants a password to be able to view it.
1top comment
Tableau recently introduced a consumption-based licensing model for embedded analytics that is meant for external-facing use cases. I think this is what you need. If you are looking for something to truly be free then you will need to look at some of the open-source viz tools that are out there.
https://help.tableau.com/current/online/en-us/license_product_keys.htm

getdbt.slack.com: #bi-tools-general
Posted on Sep 2024 View source
This Slack community is not public. Register here and read the comments.
A.
hi all! curious to know what embedded analytics platforms others are currently using is it good and would you recommend it? looking to implement an embedded platform for 1,000-2,000 users would really appreciate hearing thoughts/opinions from people who are using the software rather than vendor calls if possible :sweat_smile: thanks!
1top comment
I'm using Metabase for embedded analytics and it's been great. It's easy to set up and has a lot of features that make it a good choice.
getdbt.slack.com: #bi-tools-general
Posted on Aug 2023 View source
This Slack community is not public. Register here and read the comments.
M.
Are there any embedded BI tools people can recommend with white label embedding at a low cost?
1top comment
We have tried quite a few tools for this. In production used Tableau but ran into issues: performance, dev complexity (write in desktop, not actual code!) even security bugs (leaking other customer data in filter choices!). Now we do double approach: in parallel implement prototypes with Quicksights, and for real average end-user use dont relay on any ready BI, but build "pixel perfect UX" in code using lower level UX dev (react) components. There are opensource ones, and we have created own inhouse set on top of these. One key learning is that the BI drill-downs and other fancy things are just too complex for embedded use cases in case of beginner and average users. Advanced users anyway dont want any UX, just "can i download my data" so they will use their looker/tableau/dwh stack or whatever.
r/BusinessIntelligence
Posted on Feb 2019 View source
Looker vs Sisense for embedded analytics?
Hey all, looking for some insight from those with experience of Sisense and Looker specifically in the world of embeddeding & monetizing within an enterprise web application. Here are some key things I’m looking for:
1top comment
Of the two: Sisense has the most functionality in multi-tenancy, row level security, and embedding. It is a bit dull on it's standard package but function over form there. Another suggestion I would consider (if you're asking) is Tibco Spotfire. Row level security, excellent embedding and server, the visuals are nothing to sneeze at at first but if you enable the D3.JS repository boy are the doors thrown wide open! It has about as capable GIS capabilities as any tool I've yet to toy with. I would NOT suggest DOMO. It has fallen by the wayside in support, feature matching, and costs compared to every other tool out there.
r/BusinessIntelligence
Posted on December 2023 View source
Embeddable BI? Experts help me out
Hi all, I build and run a SaaS company. My customers want to analyze their data. I've built some charts for the most common analysis, but ideally I let the users build and manage their own visualizations and BI views. Does anyone have any recommended tools that might fit:
1top comment
Power BI Embedded with the A SKU (pay as you go) might be for you. You can scale up/down and even pause if you don't need it 24/7. The API let you do pretty much everything and you can play around with it in the playground.
r/BusinessIntelligence
Posted on April 2024 View source
Help choosing a BI platform
Hi! My company is exploring a BI platform, ultimately to be embedded and geared toward external users.
The background is we have a product that generates a lot of data and allows users to explore it in a very specific way (think interactive video content based on an AI/computer vision pipeline on video) but there is no way for users to explore aggregate results (they can interact with particular videos but not see how many times X happened for example over a month worth of video)
1top comment
I don’t think this is asking for “a lot of free work”. This is very common and OP is smart to have realized, at least realized there’s some potential value, to buying over building. The most common, is why get in the business of maintaining the analytics, as an almost entire new product line, when your engineers are building your core product and so many vendors do BI well?
We went through this, and here is what we learned:
• never used Looker. But the LookML niche skillset and lack of resources in the market was a deal breaker for us.
• PowerBI was a cheap alternative to start. Not to different from LookML, the DAX become a bit unwelcoming but it worked for 100 users. When you scale, the feedback and requests become way more and you raised the important point of a potential future where you’ll let your customers be more self serving?
• we then turned to Tableau. While the price point was higher, it’s no doubt the easiest to use BI software. The talent market is massive, we were able to iterate quicker, and we have an upsell offering of self service analytics where we can still govern and control the data. Which is our IP. Really helped us serve more customers without bottlenecking our engineers.
You’ll have to explore the PowerBI to Big Query connection yourself. Not sure how that’s materialized recently considering the Google / MSFT competition and MSFT seems to be pushing Fabric really hard
r/BusinessIntelligence
Posted on June 2021 View source
Free / open source or affordable single sign-on embedded BI tools?
Does anybody know of an affordable solution for embedded analytics that can be authenticated through your own application via the URL in an iframe or in some way where I can use embedded analytics and only have the data linked to the current logged in app user shown on the embed?
1top comment
Metabase perhaps or Apache Superset
r/BusinessIntelligence
Posted on July 2020 View source
Finding hard to zero in on the right platform for embedded analytics. Which of the following would you recommend?
We are using tableau now for embedded analytics, to share with our customers. We found the following issues:
1top comment
I'm a Power BI guy. I interact with Tableau reports in our organization, but I've never used it to build one. While I like Power BI because it's what I know and am good at, both platforms should be able to handle 100+ million rows of data. Most of the modeling I do is on tables ranging from a few million up to 80 million rows, although I know Power BI is used successfully on data sets over 1 billion rows, but I suspect Tableau can, as well.
However, when you get to data sets of that size, you need to put a lot of thought into how you build your model. Are you following good star schema principles? Are you writing highly efficient measures and really understand the nuances of how different functions work? Sloppy code will work just fine on a 10,000 row table, but can grind to a halt at 10's or 100's of millions of rows.
My suspicion is that your performance issues aren't Tableau's fault, but rather just an indication of a sub-optimal schema and report design. It's entirely possible that a different technology may "fix" these problems for you just by the nature of how it is designed, but it could introduce new issues, as well.
I'm not specifically advocating that you switch to Power BI; I'm just suggesting that before you drop Tableau, you confirm that your performance bottleneck is Tableau itself, and not just your level of understanding of Tableau.
locallyoptimistic.slack.com: #discussion
Posted on Sep 2023 View source
This Slack community is not public. Register here and read the comments.
Katie B.
What are folks' favorite tools for building external-facing dashboards?
1top comment
If this is "whitelabel embeds" vs publicly accessible, I've found all the "name brand" BI tools do this.
Honestly, the decision criteria for choosing are basically the same as a BI tool (SQL vs modeling, pricing, viz options).
The additional criteria being
• How much does customizability of branding matter to you
• How does their auth/sso/permissioning lifecycle work, and can your dev team handle it?
I'm using Metabase for embedded analytics and it's been great. It's easy to set up and has a lot of features that make it a good choice for embedded data analytics.
getdbt.slack.com: #bi-tools-general
Posted on Aug 2023 View source
This Slack community is not public. Register here and read the comments.
Stephen E.
Are there any BI tools that do embedded analytics in mobile apps?
1top comment
Tableau used to / still has a framework with examples embedding in mobile apps, but as above its just a web element.
There are nuances to embedding for touch devices, the BI tool has to cater for the fact that you're not using a mouse to interact so actions like click and drag or right click need to be considered by the BI tool.
11 Best Embedded BI Tools: An Overview
Disclaimer: This section is written with a few biases and preferences.
Embedded business intelligence and data analytics are fields that have been around for over 50 years, so clearly there are multiple approaches to designing embedded BI software. If you're still deciding whether to build your own or buy, read our build vs. buy embedded analytics analysis first.
Everyone will have their own preferences and biases. We do as well. Here are the biases that have shaped how we wrote this section:
- Embedded BI should be easy to maintain programmatically. A poorly maintained BI environment kills user trust and buries BI teams in admin tasks. While many BI tools make it easy to build reports, not many of them design their software with BI maintainability in mind.
- Embedded BI should be reusable. Tweaking analytics for every customer slows you down. Your BI tools should support reusable chart components so you can create similar dashboards across tenants without starting from scratch.
To keep things consistent and enjoyable, we’ll assume you’re on board with these biases for this section. That said, we’re open to feedback! If you have any thoughts, share them with us using this form.
For a more comprehensive list of all embedded BI and analytics tools, check out this article.
1. Holistics
Holistics is a BI platform that helps data teams set up self-service BIs that are reliable and easy to maintain. It offers a code-based semantic layer for managing analytics logic and a drag-and-drop interface for data exploration.
What makes Holistics different, compared to other embedded BI tools, is its programmable BI approach. For Product Engineers, this approach meant they could build a custom reporting experience and integrate it into the product without compromising software development best practices.
Besides embedded analytics, this approach also brings several unique capabilities:
- Analytics as code: Every component of the analytics logic, from data models to dashboards, can be described as code, and versioned in Git, allowing for full programmatic control and customization. This is complemented by user-friendly interfaces for less technical users.
- Fully customizable visualization and dashboard: A code-based canvas dashboard experience that provides users with complete control over the layout, styling, and interactions of their visualizations and dashboards.
- Developer-first experience: Holistics provides a powerful IDE-like environment, enabling analysts to work with analytics code with ease, leveraging features like auto-completion, syntax highlighting, and debugging tools.
- Reusable BI Components: All BI components, from visualizations and dashboards to data models and metrics, can be parameterized and reused across the organization, fostering consistency and efficiency.
- Robust CI/CD and extensive API support enable powerful integration and automation that streamline BI operations while maintaining governance and consistency
- Ask AI (Conversational Analytics): Embedded users can explore data using natural language questions directly within the Embed Portal, with automatic enforcement of data permissions and row-level security.
- Email Subscriptions: Embedded users can self-subscribe to scheduled dashboard email deliveries in PNG, PDF, CSV, and Excel formats, with admin-level oversight and control.
- Dynamic Database Routing: Dynamically connect embedded dashboards to different databases or schemas per customer/tenant at runtime, enabling multi-tenant architectures without duplicating analytics logic.
Customer stories: Lepaya built native-feeling embedded analytics in three months for enterprise clients including Dell and KPMG. SensorFlow migrated 45 dashboards from Looker to Holistics in two weeks and achieved 88% monthly active user adoption. Datacubed Health delivered HIPAA-compliant embedded analytics at scale across US, EU, and China deployments.
Pricing: Holistics’s embedded analytics solution starts at $800/month and comes with unlimited viewers, unlimited reports created, and all functionalities included. For SaaS companies embedding analytics, this model scales well as your customer base grows. Learn more about monetizing embedded analytics as a revenue stream.
2. Tableau
Tableau is well-known for its powerful visualization capabilities, and its embedded analytics platform offers the same high-quality visuals people expect.

Sample Embedded Dashboard in Tableau
Notable Features:
- Robust Embedding API: Integrates Tableau visualizations into applications with a REST API for user and content management.
- Outstanding Visualizations: Converts complex datasets into interactive, visually stunning dashboards.
- Active Community: Offers a supportive environment with AMAs, forums, and expert interactions.
Potential Limitations:
- Proprietary Version Control: Tableau uses its own proprietary file formats - so there’s Git-based code version control/change process management. One person editing locally and pushing up can overwrite everyone else, making it difficult for a team to manage.
- No Centralized Metric Repository: With Tableau, it’s easy to end up recreating the same metrics with different calculations in different places. As the number of reports grows, metric definitions might become more disparate and inconsistent, making it difficult for the data team to maintain accuracy across multiple reports.
3. Power BI Embedded
Power BI’s embedded analytics is rich in functionalities, allowing customers to lodge dashboards and reports into their existing applications. For enterprise companies that are already hooked to the Microsoft ecosystem, PowerBI's embedded analytics solution is a natural choice.
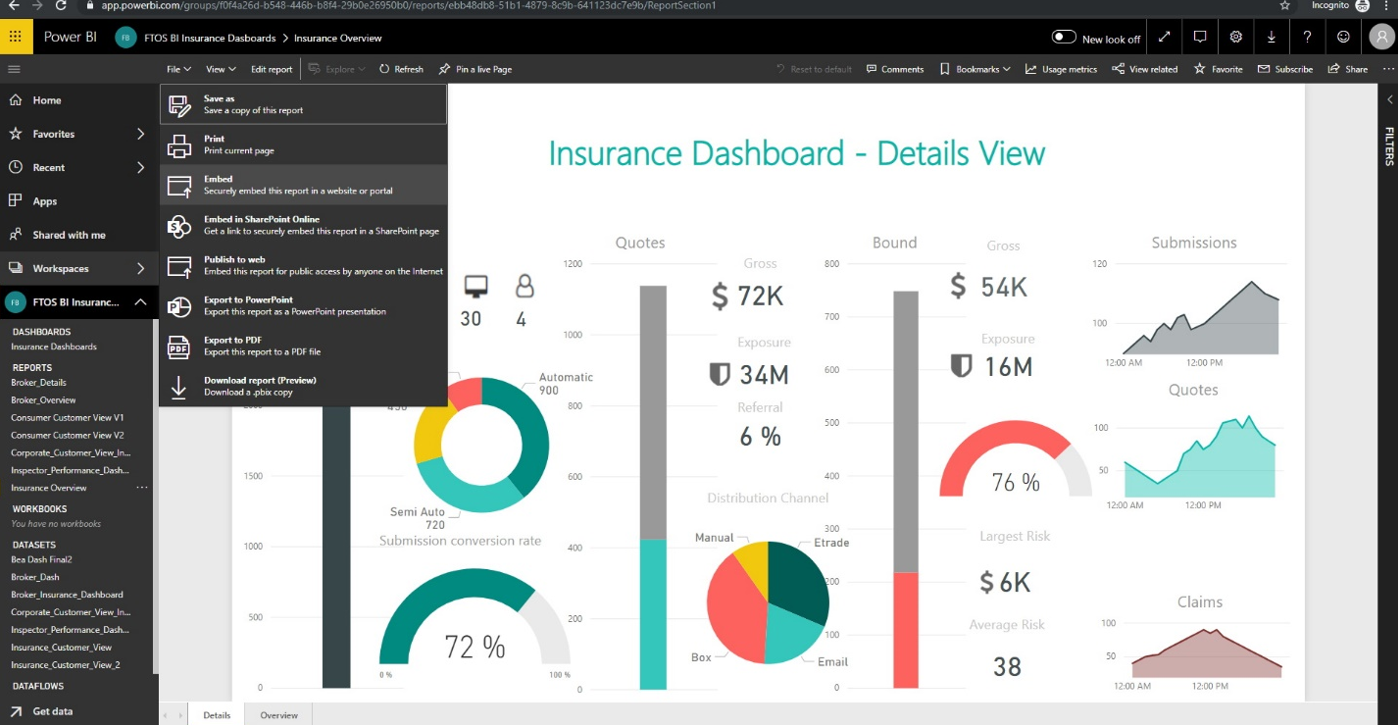
Sample Embedded Dashboard in Power BI Embedded
Notable Features:
- Seamless Microsoft Integration: Power BI Embedded Analytics is part of the Power BI suite and integrates smoothly with other Microsoft products, making it an excellent choice for organizations already using Microsoft tools.
- Advanced Calculations with Dax: Power BI's DAX (Data Analysis Expressions) enables advanced calculations, time intelligence, and custom measures for dynamic, interactive reports. It’s optimized for large datasets, ensuring high performance while maintaining flexibility and consistency in analytics.
- Power BI’s Copilot: Power BI Copilot uses AI to assist users in building reports, generating visuals, and uncovering insights through natural language prompts, making it easier for users to explore and understand their data.
Potential Limitations:
- Dependency on Microsoft Ecosystem: While it integrates well with Microsoft products, its value may be diminished for organizations using non-Microsoft technologies or requiring more advanced customization options.
- No Git Version Control: PowerBI’s workflow is not designed to have code checked into Git repository, making it difficult to manage changes, perform code branching, and maintain the accuracy of analytics logic.
4. Looker
Similar to Holistics, Looker has a code-based modeling layer with self-service data exploration.
Looker's embedded platform offers all of its core features, including:
- LookML’s Modeling Layer: LookML (Looker Modeling Language) is the language that is used in Looker to create semantic data models. You can use LookML to describe dimensions, aggregates, calculations, and data relationships in your SQL database. LookML allows BI teams to centralize metric definitions, and ensures consistent, reusable datasets.
- Data Models as Code: Looker allows data models to be defined as code and versioned via Git, facilitating reliable management, collaboration, and deployment of data models.
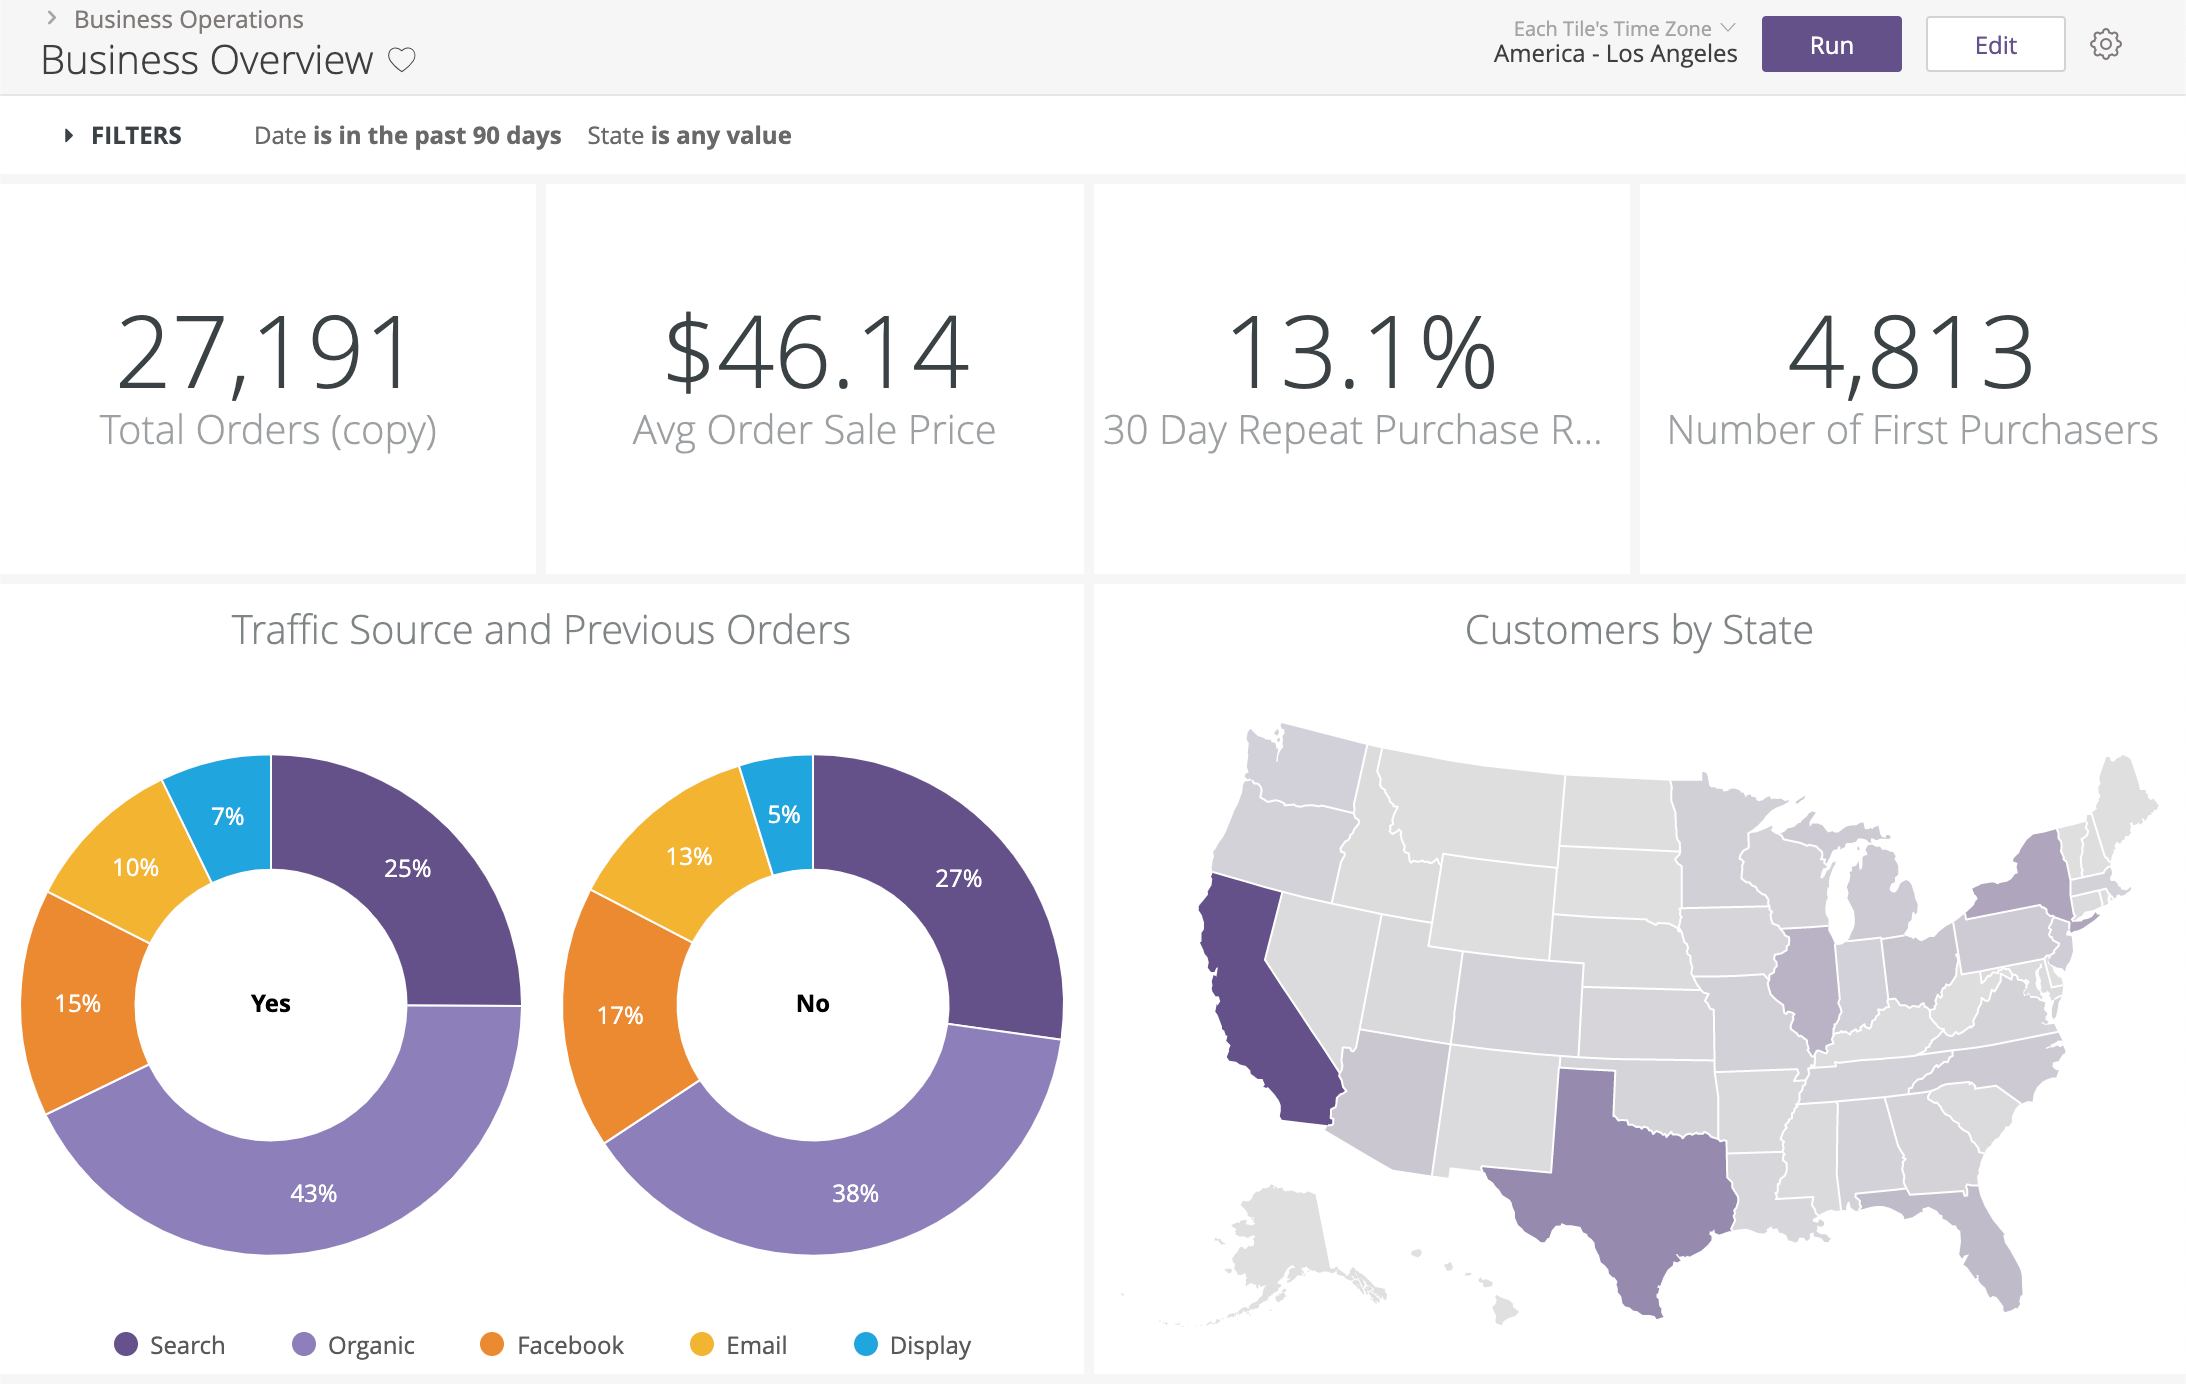
Sample Dashboard in Looker Embedded
Looker Limitations:
- Steeper Learning Curve: Looker’s extensive features and customization options come with a steeper learning curve, which may be challenging for organizations without advanced data expertise.
- High upfront cost: Looker's high upfront cost might make it prohibitive for smaller organizations to scale their embedded analytics access.
- Limited Visual Customization Options: While Looker provides extensive options for customization, its out-of-the-box visuals are somewhat limited. You’ll need to invest time into designing your embedded visualizations to ensure they meet your specific aesthetic and user experience requirements.
5. Embeddable
Unlike other BI tools in this list which offer both embedded and internal analytics, Embeddable is purpose-built for product engineering teams that want to deliver native, customer-facing dashboards inside their SaaS applications. Embeddable provides intuitive, compatible and flexible developer tools to create fully-integrated analytics experiences that match the product’s look, feel, and performance expectations.
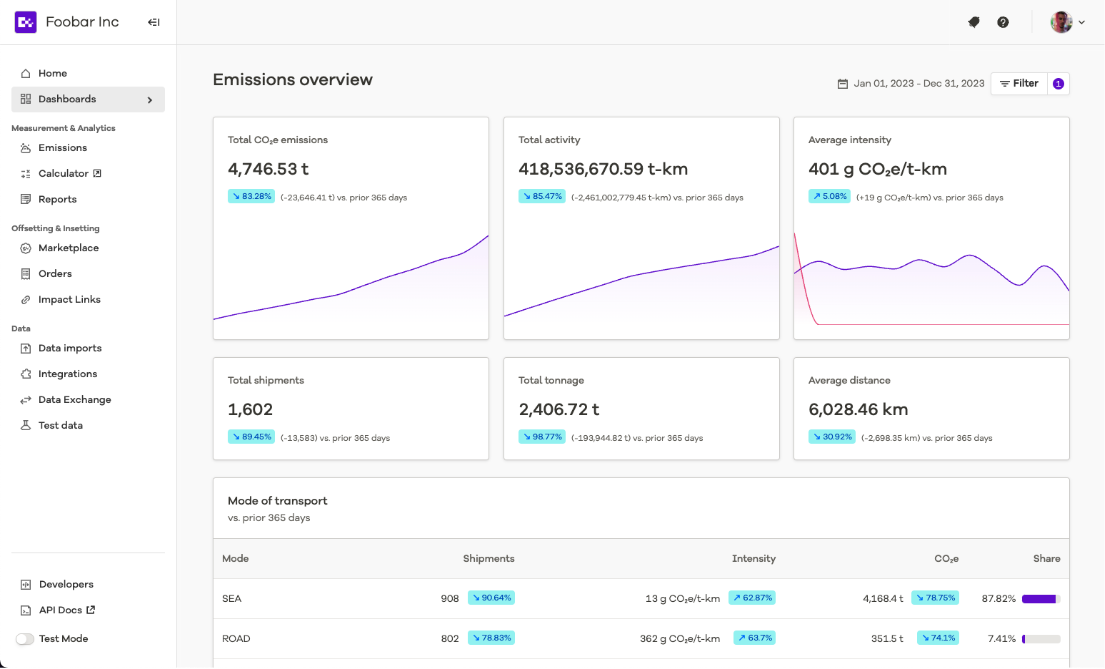
Sample Dashboard in Embeddable
Notable Features:
- Feels native in your app: charts are fully customisable and extensible in code; and embedded through secure, lightweight embeds that render as part of your application, iframe-free. Combined, this ensures a seamless, fully native UI/UX that blends naturally with the product’s frontend.
- Excellent Developer experience: Embeddable provides SDKs, APIs, Git-based version control, and CI/CD compatibility, enabling teams to manage dashboards just like any other part of the application. This means faster iterations, reproducible environments, and cleaner deployment management.
- Highly Performant at Scale: With multi-layer caching and a high-performance data service, dashboards load in milliseconds and scale effortlessly, while maintaining consistent speed and reliability.
- Built-In End-User Features: Embeddable includes end-user capabilities like localization, export options, drilldowns, and self-serve dashboards, empowering customers to explore and personalize analytics without adding engineering overhead.
Potential Limitations:
- Requires Frontend Development for Advanced Customization: While Embeddable provides a no-code dashboard builder, highly bespoke visualizations benefit from developer input; a trade-off for maintaining total design freedom.
- Standalone embedded analytics solution (no internal BI): If you’re looking specifically for one tool to serve both internal BI and customer-facing analytics needs, Embeddable takes the position that these two distinct use cases require a distinct solution and approach - it focuses only on customer-facing use case.
6. Luzmo
Luzmo is an embedded analytics platform that puts a strong emphasis on elegant visualization and an API-first embedding approach.
Notable Features:
- Luzmo IQ: Luzmo leverages AI-driven tools to provide insightful recommendations and let embedded viewers get answers to their data questions using natural language.
- Embedded Dashboard Editor: Luzmo enables embedded viewers to customize dashboards directly from a template, allowing them to tailor charts, layouts, filters, and visualizations to meet specific needs.
- Luzmo Flex: Luzmo Flex is a data visualization software development kit (SDK) designed for developers to create custom data products directly within their applications.

Sample Embedded Dashboard in Luzmo
Luzmo's Limitations:
- Feature Depth: As Luzmo is built specifically for embedded analytics, it lacks the robust data modeling, complex analytical operations, and integration options offered by dual BI tools like Tableau or Looker. Organizations needing a dual-purpose tool for both internal and customer-facing analytics might find themselves relying on additional platforms to fill the gaps.
- Non-Git-Based Version Control: The platform uses a non-Git version control system called Version History. While it tracks changes and allows reverts, it lacks Git’s advanced features, which might be a hassle for product engineers used to Git workflows.
7. Sigma Computing
Sigma Computing is a data analytics platform with a spreadsheet-like interface, offering embedded analytics solutions beside its core BI functionalities.

Sample Embedded Dashboard in Sigma Comuting
Notable Features:
- Spreadsheet-Like Interface: Sigma Computing features an intuitive, spreadsheet-like interface, making it accessible for users familiar with Excel and easing the transition to advanced analytics.
- Embedded Data Exploration: The platform allows users to explore data dynamically, perform ad-hoc analyses, and drill down into metrics directly within the embedded environment.
- Granular Role-Based Access Controls: Sigma provides detailed user permissions with role-based access controls, supporting both single and multi-tenant environments. This ensures precise management of user access and dynamic role switching.
Limitations:
- Customization Complexity: While Sigma allows for customization of the user interface and theme, advanced customization may require additional effort compared to other platforms with built-in features.
- No Git-based Version Control: Sigma Computing doesn’t offer native "analytics as code" or direct Git version control integration. Even though Version Tagging is available to manage workbook versions proprietarily, the lack of Git’s branching, merging, and change tracking can make it harder to maintain analytics workflows.
8. Sisense
If you've been on the lookout for embedded analytics platforms, Sisense is a name you’ve probably come across. This is well-deserved as they've put a lot of thought into multi-tenancy and slicing data on different levels for access control.
Notable Features:
- AI-Powered Analytics: The platform includes AI and machine learning features that provide predictive analytics and uncover hidden trends.
- Efficient Data Processing: Sisense’s Elastic Data Engine is designed to handle large, complex datasets from multiple sources, making it ideal for organizations with significant data processing needs.
- Customizable Embedding: Sisense offers robust embedding options with a fully customizable API and Compose SDK, allowing developers to tailor the look and feel of dashboards to match their in-app branding and user experience.
Potential Limitations:
- Higher Cost: Sisense’s pricing model can be expensive, particularly for larger deployments or highly customized solutions. Sisense pricing starts from $21K per year.
- Focus Shift to Embedded Analytics: Sisense’s transition from a code-first visualization tool to an embedded analytics platform has reduced its focus on SQL-first capabilities and internal BI tools. This shift has made it less suitable for users who prioritize reusable, standardized models for internal analytics and reporting.
- Limited maintainability: Sisense lacks built-in features for managing analytics as code in a programmatic and version-controlled manner. Unlike tools that let you define metrics, models, or analytics entirely as code for reuse and a single source of truth, Sisense primarily operates through its GUI and embedded workflows.
9. Metabase
Metabase is an open-source BI tools, suitable for SMEs who want to quickly build embedded analytics or customer-facing data products into their applications.
Notable Features:
- User-Friendly Interface: Metabase is known for its intuitive, easy-to-use interface, making it accessible for embedded viewers to create and explore dashboards.
- Quick Setup: Metabase is straightforward to embed, and supports both iframe and API embedding.
- Powerful Query Builder: The platform includes a robust query builder that simplifies data exploration.
Sample Embedded Dashboard in Metabase
Potential Limitations:
- Limited Visualization Features: The platform struggles with displaying charts that have a lot of series, making it less suitable for visualizing complex or high-dimensional data.
- No Code-based Version Control: Metabase lacks 2-way Git-based version control, making it difficult to track changes or roll back updates. This can lead to inconsistencies and errors that undermine trust in the analytics environment.
Read more: Metabase Pros, Cons and Best Alternatives
10. Domo
When it comes to embedded analytics, one platform that's often mentioned is Domo. Domo is a feature-rich BI tool built for teams that need seamless embedded analytics and advanced data visualizations
Notable Features:
- Comprehensive Data Integration: Domo stands out for its ability to easily connect with over 1,000 data sources, ranging from cloud-based applications to on-premise systems.
- Collaboration Features: With built-in collaboration tools, Domo makes it easy for teams to share insights, comment on dashboards, and work together in real-time.
- Mobile-First Analytics: Strong support for mobile analytics, enabling users to access dashboards, reports, and insights on the go through its mobile app.
Potential Limitations:
- High Cost: While Domo offers extensive features and ease of use, it comes at a higher price point compared to other tools. The pricing structure can also become complex as your needs grow, especially with additional users or data sources.
- Limited Customization for Developers: Developers might find its customization options more restrictive compared to more developer-friendly platforms like Looker or Holistics, which offer analytics as code capabilities. This can limit the flexibility needed for advanced custom analytics solutions.
11. Reveal BI
Reveal BI is an embedded analytics SDK designed primarily for .NET and Java developers who want to integrate analytics directly into their applications.
Notable Features:
- SDK-First Approach: Reveal provides native SDKs for .NET, Java, and JavaScript (including React and Angular wrappers), allowing deep integration with existing application codebases.
- Self-Service Dashboard Creation: Embedded users can create and edit dashboards with configurable permissions for adding filters, calculations, and visualizations.
- Custom Visualizations: Developers can define custom visualization components through the Reveal SDK for tailored reporting experiences.
Potential Limitations:
- No iFrame or Public Embedding: Reveal does not support traditional iFrame embedding or public link sharing, limiting deployment options for teams that prefer simpler embedding methods.
- Limited Ecosystem: Compared to larger platforms like Tableau or Power BI, Reveal has a smaller community and fewer third-party integrations.
- No Semantic Modeling Layer: Reveal lacks a built-in data modeling layer, which may require more manual work to maintain consistent business logic across dashboards.
Frequently Asked Questions
Which embedded BI tools support unlimited dashboard viewers without per-user licensing?
Metabase and Holistics offer pricing plans with unlimited viewers.
Holistics starts at $800/month with full functionality included, while Metabase starts at $500/month with 10 users.
Holistics starts at $800/month with full functionality included, while Metabase starts at $500/month with 10 users.
What tools support code-based workflows and strong governance?
Looker (with LookML) and Holistics (via AMQL) both offer semantic modeling, Git-based version control, and CI/CD integration, ideal for teams that treat analytics as code.
What are some lightweight embedded analytics tools for SaaS apps without internal BI teams?
Explo and Luzmo specialize in white-labeled dashboards with no-code interfaces. They’re designed for product teams who need customer-facing dashboards without internal analytics complexity.
Are there tools that support self-service embedded dashboard editing?
Yes. Holistics (via Embed Portal), Tableau (via Embedded Web Authoring), Metabase (Pro plan), Domo (via Domo Everywhere), and Luzmo (via Embedded Dashboard Editor) all allow users to create or modify embedded dashboards. Holistics also offers Ask AI, enabling embedded users to explore data using natural language queries.
Which embedded analytics tools support dynamic data source switching at runtime?
Holistics, Sigma, and Sisense allow for tenant-specific database routing and dynamic warehouse switching, useful for multi-tenant SaaS platforms.
What are white-labeled analytics, and how are they different from embedded BI tools?
White-labeled analytics tools let you fully rebrand and embed dashboards in your product as if you built the analytics yourself like custom logos, fonts, domain masking, and UI control included. They're optimized for external users, typically customers.
By contrast, embedded analytics broadly refers to inserting dashboards or reports into another application via iFrames or SDKs—but not all tools allow for full white-labeling.
Among the tools we've reviewed:
By contrast, embedded analytics broadly refers to inserting dashboards or reports into another application via iFrames or SDKs—but not all tools allow for full white-labeling.
Among the tools we've reviewed:
- Explo and Luzmo are purpose-built for white-labeled, customer-facing analytics. They prioritize tenant isolation, design flexibility, and simplified deployment without internal BI features.
- Looker, Power BI, or Metabase offer strong embedded features but require more engineering work to approximate a white-labeled experience and may retain vendor UI elements.
- Tools like Holistics and Sigma sit in the middle, offering both out-of-the-box white-labeling and embedded analytics.
Do any embedded BI tools offer AI-powered analytics for embedded users?
Yes. Holistics offers Ask AI, which enables embedded users to explore data using natural language questions directly within the Embed Portal. Luzmo offers Luzmo IQ for AI-driven data exploration. Power BI has Copilot for natural language report building. Sigma and Tableau also offer natural language query features, though their availability in embedded contexts varies.
I would recommend Looker. The Looker Elite license allows full embedding and custom visualizations into any existing software, website, app, etc. Essentially you can whitelabel Looker into your existing front end app/site/ etc.
If you just want internal analytics, dashboards and visualizations you can use Looker Elite for internal use.
Holistics. Unique code-based approach to embedded dashboards which lets us do a ton of front end customizations while keeping the engineering workflow our team is already comfortable with.
There’s a bit of a learning curve, but it saves us a ridiculous amount of time on maintaining dashboards.