15 Best Embedded Analytics & BI Tools (2026 Edition)
In this article, I will walk you through key embedded features and the 15 best embedded analytics tools available in 2026
Contents
Introduction
If you’re evaluating embedded analytics platforms, you’re probably not just looking for dashboards. You’re building a product, and analytics is one part of the product offering.
The challenge is that most BI tools say they support embedded analytics, but what they actually offer ranges from a basic iframe to a full SDK with granular access control and white-labeling. Some tools are built for internal teams first and adapted for embedding. Others were designed from the ground up to live inside external products.
This guide breaks down what to look for and how to evaluate your options.
It covers everything from permissioning and customization to embedding architecture and maintainability, followed by a comprehensive list of embedded analytics tools, from full-featured BI platforms to purpose-built and open-source options.
Whether you're embedding analytics into a SaaS app, a customer portal, or an internal tool, this post will help you pick the right tool for your product’s needs, and avoid the ones that’ll slow you down later.
How To Choose The Best Embedded Analytics Tools
When it comes to embedded analytics, most platforms check the same boxes on the surface: embedded dashboards, filters, and row-level security. But if you’re building user-facing analytics into your product, and not just adding a tab for charts, you need to evaluate how deep each of these capabilities actually goes.
Here are 6 factors to consider and evaluate when choosing embedded analytics tools.
1. Permission and User Access Control
This is where things fall apart if you're not careful. Your analytics tool must isolate data securely across tenants while remaining flexible enough to scale.
- Row-Level Security (RLS): Make sure the platform supports secure filtering of data by tenant or user, ideally through token-based or attribute-based access controls.
- Dynamic Data Sources: Swap the underlying data source based on who’s viewing.
- Workspace Management:
- Personal Workspaces: Prevent users from overwriting each other’s work.
- Shared Workspaces: Enable collaboration across roles and teams within the same tenant.

2. Self-service Embedded Analytics
If your customers want to build their own report inside your product, look for embedded analytics tools that support embedded report builders.
- Intuitive Report Builders: Some platforms include an embedded, drag-and-drop authoring portal for non-technical users to build their own reports, while others provide embedded AI so users can ask questions in natural language and instantly generate reports and answers.
- Governed Datasets: Ensure users can only build from curated datasets, so they don’t break metric definitions or expose sensitive joins.
- In-App Sharing: Ideally, customers should be able to share custom reports with others in their org, with permissions tied to their tenant’s identity model.
3. Pricing
The typical pricing models for embedded analytics are:
- Seat-Based Pricing: Charges you per viewer or editor, which can be prohibitively expensive for customer-facing use cases with high or fluctuating volumes.
- Usage-Based Pricing: More flexible models that meter based on things like query runs, report loads, or API calls. Be sure to understand the thresholds and overage costs.
- Platform Licensing: Some tools offer flat-rate pricing for unlimited usage but require larger upfront commitments, good for mature products, risky for startups.
You’ll want to look beyond sticker price and into how the pricing model aligns with your usage pattern.
4. Look and Feel
Your embedded dashboards should feel like a natural extension of your product, not a bolted-on iframe with clashing fonts. Look for:
- White-Labeling: The ability to remove vendor branding entirely is crucial for maintaining trust and consistency.
- Custom Themes & Styling: Tools that support CSS overrides or JSON theme files allow tighter integration with your product's design system.
- Canvas-Based Layouts: Some embedded platforms support completely custom dashboard layouts. Useful if you want pixel-perfect design or need a different visual experience per customer.
- Custom Visualizations: If the built-in charts don’t cover your needs, check whether the tool allows importing custom visualizations via JavaScript libraries or SDK extensions.
5. Maintainability
The flashiest dashboards won’t matter if your team drowns in technical debt trying to support them. A maintainable embedded analytics setup reduces developer workload and keeps metrics consistent.
- Semantic Modeling: Centralize business logic using a semantic layer so metrics can be defined once and reused across dashboards and tenants.
- Analytics as Code: Platforms that let you define models, dashboards, or even themes using code (e.g., YAML, JSON, or proprietary DSLs) make automation and testing easier.
- Version Control: Native Git integration or at least exportable configuration files help you track changes, roll back errors, and manage changes across environments.
6. Embedding Architecture
Embedding analytics sounds simple, until you have to decide how to embed it, who sees what, and what gets cached or customized.
- Embed Types:
- Public Embed: Anyone with the link can access the dashboard. Good for marketing sites or internal tools.
- Signed Embed: Secure but unauthenticated access. Often used with JWT tokens to provide scoped views to anonymous or semi-trusted users.
- Private Embed: Authenticated users mapped to internal user accounts (e.g., via SSO or OAuth). Enables full personalization, row-level access, and usage tracking, but requires login handling.
- Embed Methods:
- Iframe: Easiest to implement, but limited in interactivity and styling.
- SDK: Lets you build tighter integrations using JavaScript or React components. Ideal for dynamic UIs and advanced customization.
- API Integration: Offers full control, allowing you to fetch raw data and render visualizations using your own front-end code and charting library.
Full-Featured BI Platforms with Strong Embedded Capabilities
If you ask: "Who offers the best embedded analytics among general-purpose BI software?", then you're at the right place.
Many teams start their embedded analytics journey by extending the BI tools they already use internally. It makes sense: if you’re already building dashboards in Tableau or Looker, why not embed them too?
But not all general-purpose BI platforms were built with embedding in mind. Some offer robust APIs, white-labeling, and flexible permissioning. Others bolt on embedding as a secondary feature, good enough for demos, but brittle at scale. Below, we break down seven full-featured BI platforms that offer meaningful embedded capabilities.
1. Holistics BI
Holistics is a self-service BI and embedded analytics platform built for fast-growing SaaS companies. It stands out as a powerful solution for teams that want governed metrics, dev-friendly deployment workflows, and customizable embedded dashboards that actually feel native to your apps.
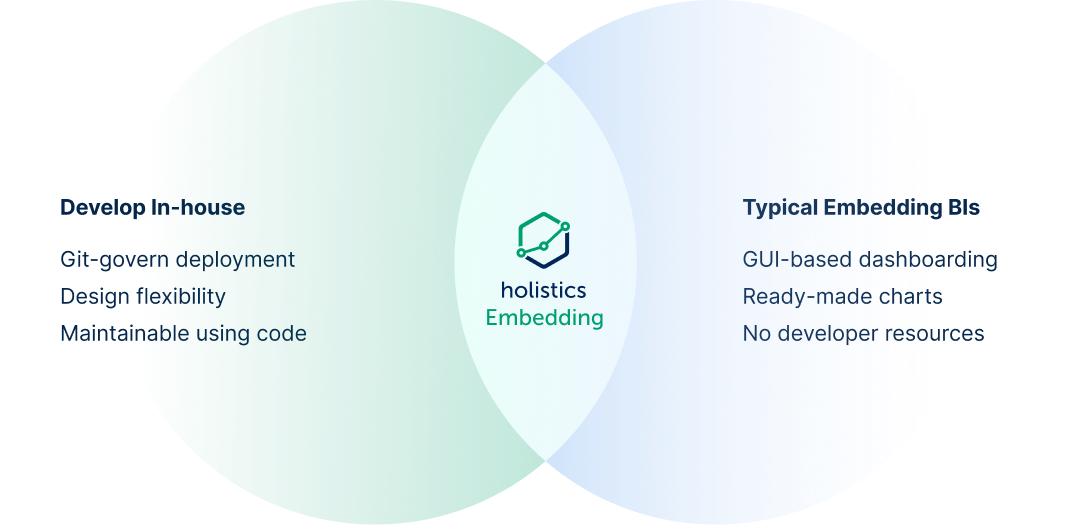
What sets Holistics Embedded apart is its analytics-as-code core as the foundation of its embedded analytics layer. This lets product engineers use a familiar Git-based workflow to design deeply customized reporting experiences and align them with modern software engineering best practices.
Key Embedded Features:
- Custom visualizations, themes, styling, and CSS let product teams create embedded dashboards that blend naturally into your app.
- Robust security controls to protect your customers’ data with row-level and role-based access, audit logs, usage monitoring, and compliance with SOC 2, HIPAA, and GDPR standards.
- An interactive interface that lets embedded users drill down, view underlying data, filter, and explore dashboards intuitively.
- Embedded AI so users can ask questions in plain English and instantly generate reports and answers.
- A governed semantic layer that allows metrics to be defined, extended, and reused across the organization to help you build customer trust with consistent, accurate metrics everywhere.
- Git-native workflows, CI/CD, and testing environments give teams full version control and safe, reviewable deployments.
- Developers can parameterize widgets, filters, and dashboards to reuse them across customer tenants and product modules, reducing repetitive work.
- Strong multi-tenant support so that you can isolate data and content per tenant (e.g. per customer / workspace), so each tenant only sees their own reports and data.
Pricing: Holistics’s embedded analytics solution starts at $800/month and comes with unlimited viewers, unlimited reports created, and all functionalities included.
Case study: See how ARD, the 2nd largest broadcaster in the world, used Holistics to deliver insights to over 2000 users.
2. Tableau
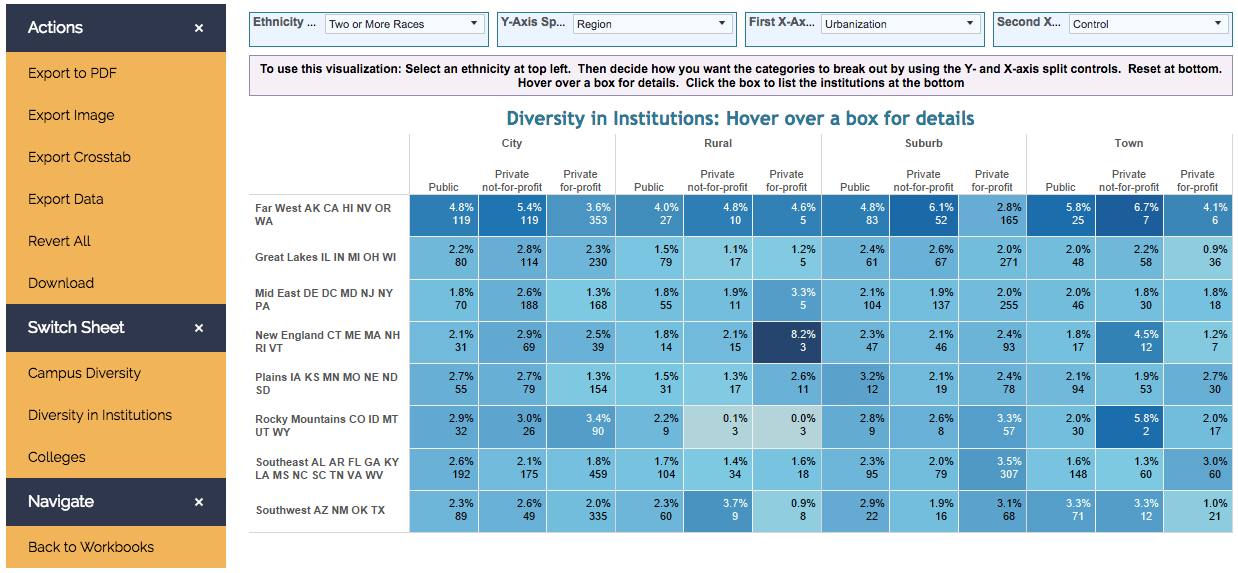
Tableau is well-known for its powerful visualization capabilities, and its embedded analytics platform offers the same high-quality visuals people expect. If you want your embedded dashboards to look impressive and polished, Tableau is a great choice
Key Embedded Features
- Embedding API for integrating Tableau data visualizations into applications, a REST API for user and content management
- External Authorization Servers for single sign-on, and support for SAML, OpenID, Active Directory, and Kerberos for additional authentication options.
- You can rapidly and easily incorporate Tableau-embedded analytics into your products, applications, and online portals using Tableau APIs and Developer Tools.
- Rich visualization options: your business stakeholders are big on visualization and data storytelling, then Tableau is the go-to choice.
Limitations
- Not Built Embedded-First: Tableau was primarily designed as a BI tool for on-premise and cloud analytics, not specifically as an embedded analytics platform. This can limit its customization and white-labeling capabilities compared to modern tools.
- Non-Git-Based Version Control: Tableau relies on non-Git-based version control systems, which may lack the advanced features and flexibility provided by Git-based systems.
Pricing: Tableau has tiers of pricing available for embedded analytics, but this isn’t made public. You can schedule a time for an inquiry here with the team for a personalized quote.
3. Upsolve AI
Upsolve AI is an AI-powered embedded analytics and business intelligence platform that accelerates time-to-insight through conversational data exploration. Integrate advanced analytics into your SaaS product with a one-line SDK, enabling end users to query data, generate custom reports, and build interactive dashboards using natural language with no/low SQL intervention. Upsolve's AI data agent provides instant business intelligence insights while maintaining your product's native look and feel.
Key features for embedded self-serve:
- Intuitive, drag-and-drop dashboard building experience: Personal workspace dashboards where users create custom charts with point-and-click interface or drag-and-drop pre-verified charts.
- Generative Business Intelligence (GenBI): generate charts and dashboards by describing your role and key KPIs.
- Hyper-flexible embedding and agent deployment: embed dashboards via iframe/react component and deploy conversational analytics as in-app widget, Slackbot, or via API to show up in every decision workflow.
- Comprehensive data agent builder hub: create custom AI agents grounded in real data with semantic later mapper, context management hub, and evaluation suite.
- Integrated scheduled email reporting: extremely handy for daily or weekly overview reports as well as custom alerts for near real-time data.
- Security-first and Developer-friendly: one-line SDK with robust multi-tenancy support.
Limitations: Upsolve assumes robust data preparation completed upstream for rapid and successful deployments.
Pricing: Transparent tenant-based pricing starting from $1000/month. Highly economical usage-based pricing for end-user token consumption for AI features.
4. Looker
Similar to Holistics, Looker has a code-based modeling layer with self-service data exploration.

Key Embedded Features
Looker's embedded platform offers all of its core features.
- LookML modeling layer centralizes metric definitions
- Full-featured SDKs and SSO embedding
- Git-based model versioning
- White-label options and component-level embedding (individual charts, not just dashboards)
- Robust API Framework, enabling seamless integration and embedding of analytics with minimal friction.
Limitations
- Steeper Learning Curve: Looker’s extensive features and customization options come with a steeper learning curve, which may be challenging for organizations without advanced data expertise.
- High upfront cost: Looker's high upfront cost might make it prohibitive for smaller organizations to scale their embedded analytics access.
Pricing: Looker’s seat-based model for embedded analytics might be off-putting for SMBs. Looker has tiers of subscriptions depending on the number of users involved in the plan. There are the Standard, Advanced, and Elite packages, ranging from $66000, $132000, and $198000 per annum, respectively.
5. Sigma Computing
Sigma Computing is a data analytics platform with a spreadsheet-like interface, offering embedded analytics solutions besides its core BI functionalities.
Key Embedded Features
- Embed Sigma dashboards into your product using an iFrame or via a backend API.
- Spreadsheet-like interface for non-technical users.
- Full support for SSO and row-level security.
- Easier embedding setup than Looker or Tableau.
- Embedded data exploration.
Limitations:
- While Sigma allows for customization of the user interface and theme, advanced customization may require additional effort compared to other platforms with built-in features.
Pricing: It's reported that Sigma Computing's pricing starts with a base fee of $30k for the platform, which comes with "unlimited" Viewer licenses, and an additional $1k for each Developer/Explorer type role.
For accurate pricing information, including any potential additional costs, it is advisable to contact Sigma directly.
6. Power BI Embedded
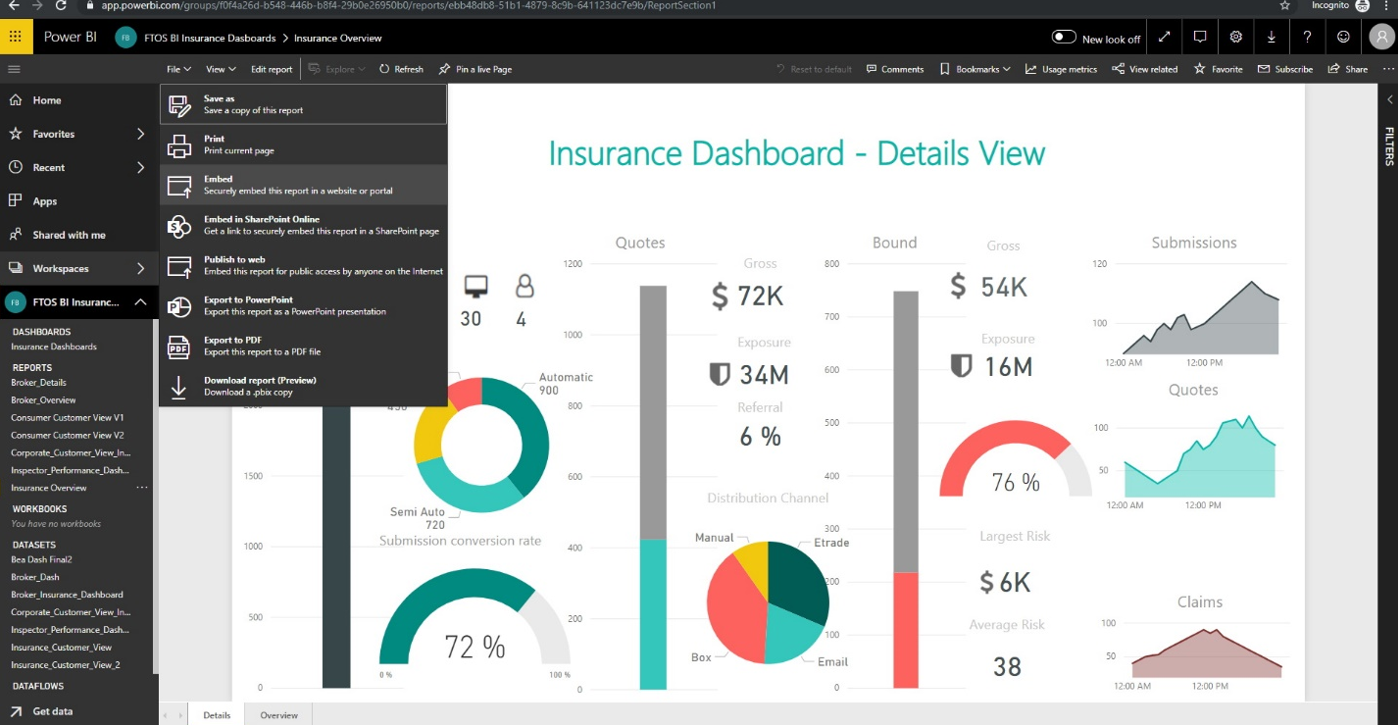
Power BI’s embedded analytics is rich in functionalities, often allowing customers to lodge dashboards and reports into their existing applications. For enterprise companies that are already hooked to the Microsoft ecosystem, PowerBI's embedded analytics solution is a natural choice.
Key Embedded Features
- Deep Microsoft ecosystem integration (Azure AD, DAX, Fabric)
- Secure token-based embeds and JS SDK
- Power BI Copilot for AI-assisted report building
- A wide range of APIs for customization and integration, allowing for tailored analytics solutions.
Limitations
- Limited Git-based version control (TMDL is a partial workaround).
- While it integrates well with Microsoft products, its value may be diminished for organizations using non-Microsoft technologies or requiring more advanced customization options.
Pricing: $109.89 per month, which means $9.99 for publishers, and each viewer gets to pay $9.99 with a maximum of 10. The more viewers you have, the more you pay.
7. Metabase
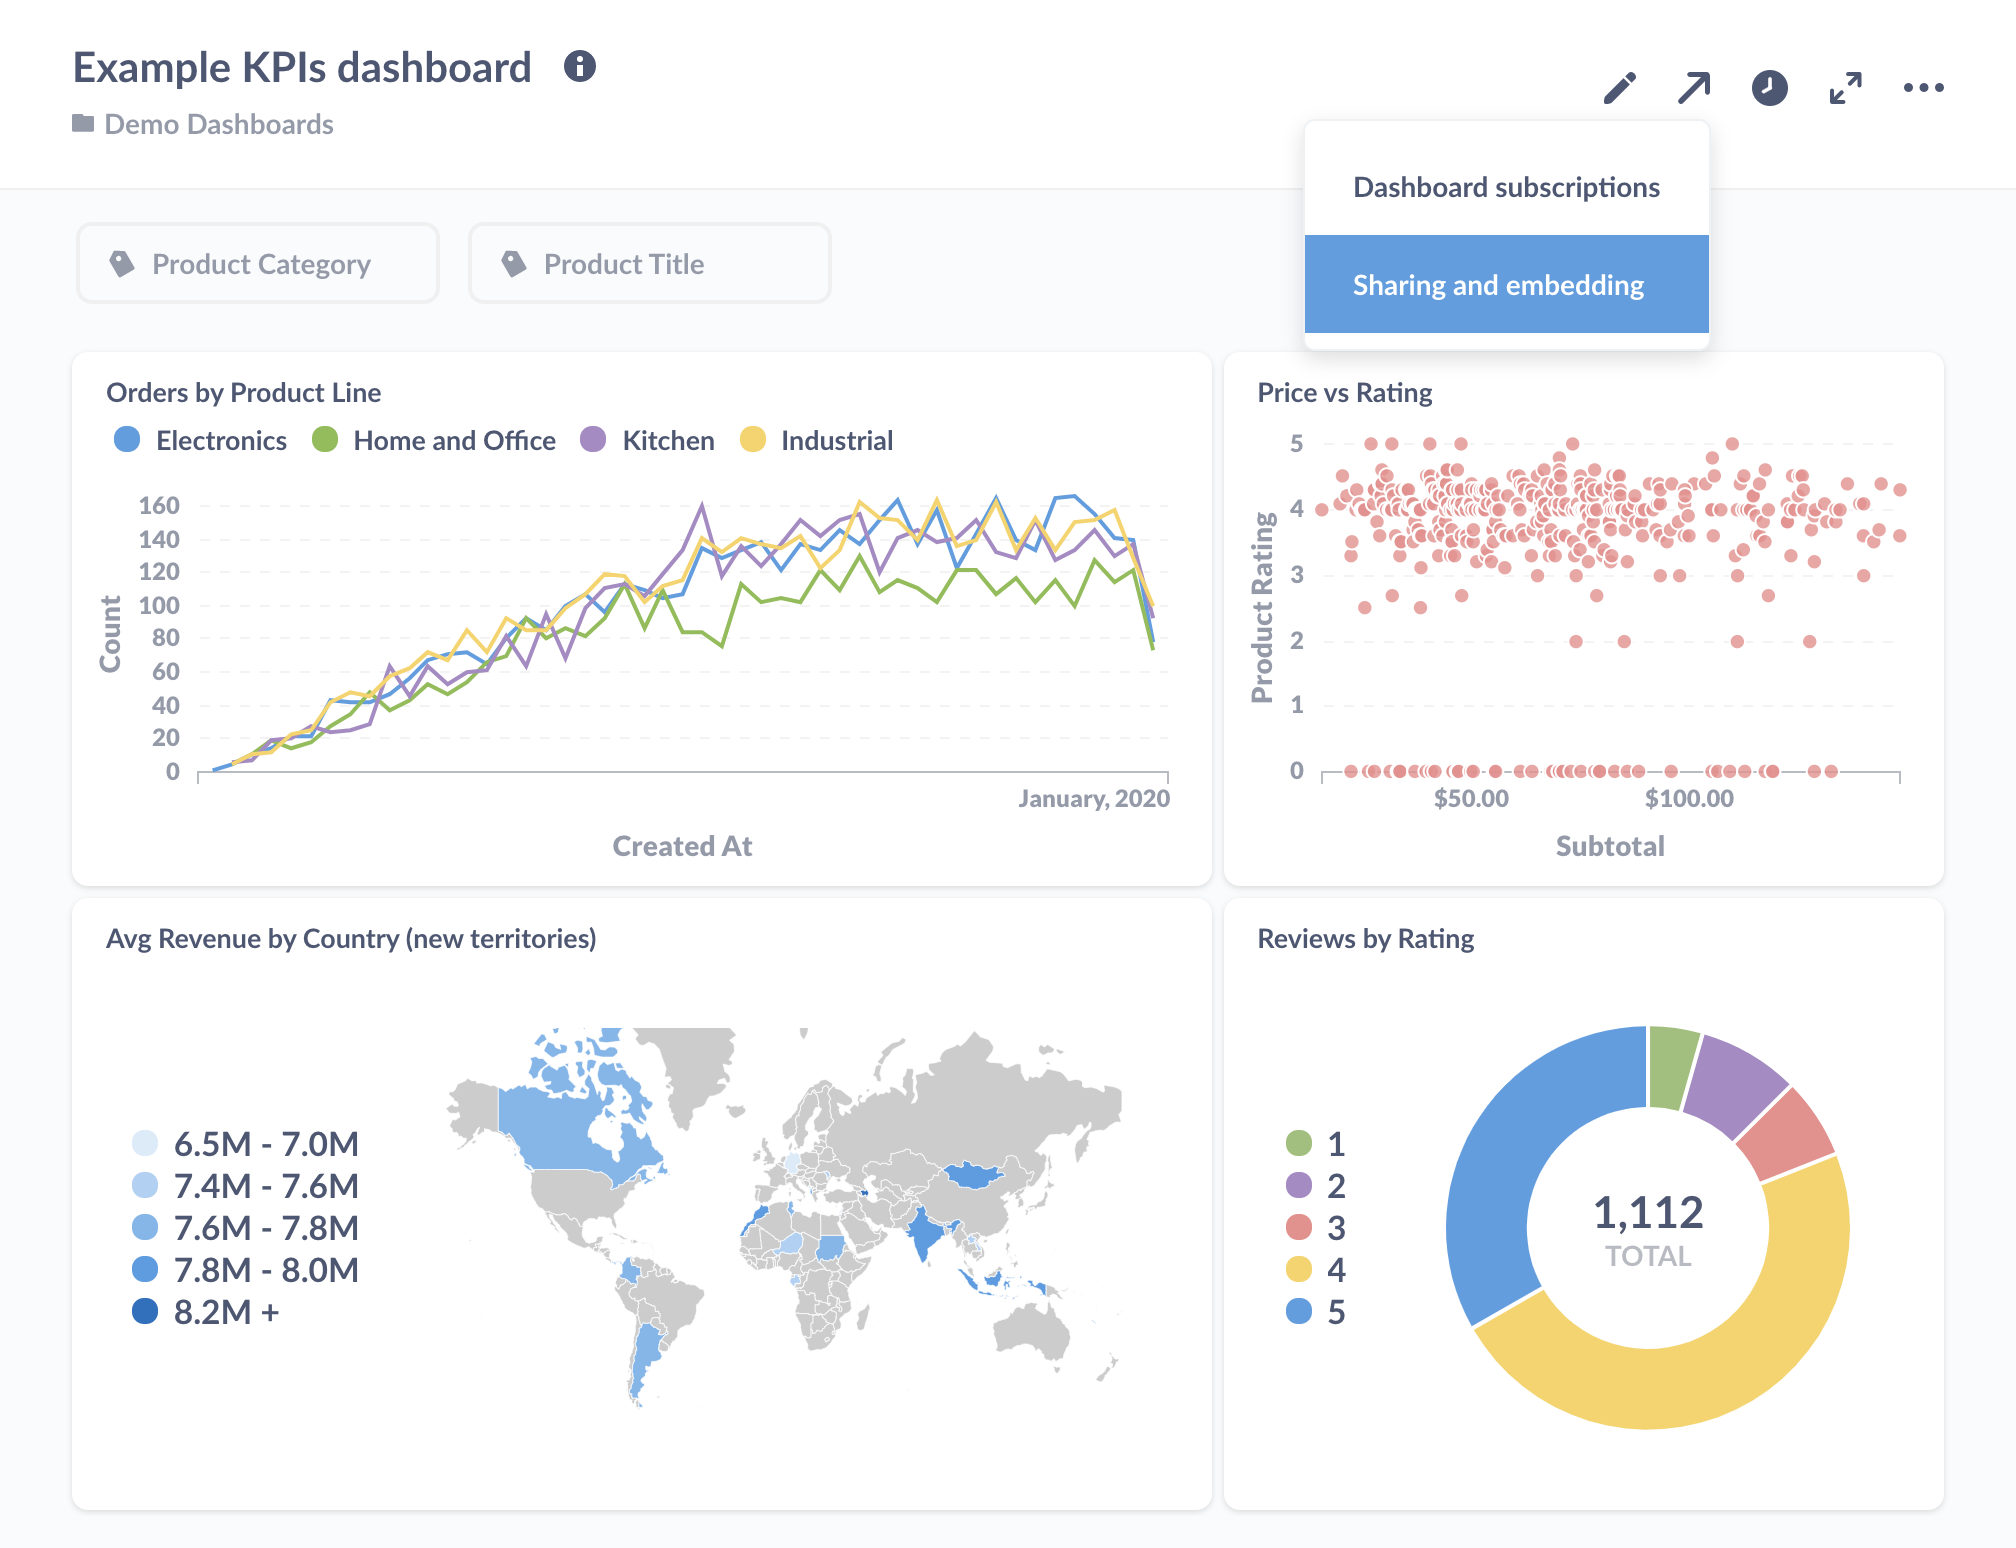
Metabase is an open-source BI tools, suitable for SMEs who want to quickly build embedded analytics or customer-facing data products into their applications.
Key Embedded Features
- User-friendly interface, making it accessible for embedded viewers to create and explore dashboards.
- Easy to self-host and integrate with apps via iFrame or signed embed.
- Supports row-level permissions and SSO.
Limitations
- Limited white-labeling and visual customization
- No semantic layer or code-based modeling.
- No code version control.
Pricing: Metabase’s cloud licenses start from $85/month.
8. Domo Everywhere
Domo is a cloud-native BI platform with strong data integration capabilities. Its "Domo Everywhere" product is its embedded analytics offering, focused on quick deployment and broad access to external stakeholders.
Key Embedded Features
- End-to-end platform with built-in ETL, data prep, and governance
- Easy-to-deploy iframe or SSO embeds
- Supports scheduled exports, alerts, and interactive dashboards
- Broad set of data connectors for syncing external sources
Limitations
- No code-based semantic layer or Git integration
- Customization and theming options are limited compared to developer-first tools like Holistics or Looker
- Pricing can be opaque and expensive at scale
Best Purpose-Built Embedded Analytics Platforms
When to Choose Purpose-Built Embedded Analytics Tools
Go with a purpose-built tool if:
- You’re building a customer-facing analytics feature that lives inside your product.
- You need tight control over layout, behavior, and access, but don’t want the overhead of running a full BI platform.
- You care more about fast integration than about traditional BI features like semantic layers or ad-hoc exploration..
Purpose-built tools usually come with better embedding docs, more flexible pricing, and stronger white-labeling support, but they often lack complex modeling, version control, or analyst-centric tooling.
1. Holistics Embed Portal
Holistics’ Embed Portal is the newest version of Holistics Embedded, designed to deliver an immersive self-service experience for your embedded users.
Portal allows your engineers to embed a self-contained BI application directly inside their product, combining governed metrics, multi-tenant controls, and developer-friendly workflows with an intuitive end-user self-service experience.
Key Embedded Features
- Purpose-built Embed Portal enables customers to explore, filter, and build dashboards, without exposing your internal BI environment.
- Fine-grained access control with row-level security (RLS), multi-tenant data isolation, and dynamic parameter injection for secure per-customer data access.
- Developers manage dashboards, datasets, and rules in code and govern with Git. They can test in sandbox environments and safely deploy updates.
- Subscription-based feature control to show different analytics features depending on the customer’s subscription tier. Premium users can build dashboards; standard users may only explore prebuilt ones (with filers, drill-through, view underlying data, etc).
Limitations
- Requires setup and data modeling from the development team
- Less suited for teams looking for a drag-and-drop builder with zero-code deployment
Pricing: Starting from $800/month with unlimited viewers.
2. Luzmo
Luzmo is a embedded analytics platform that puts a strong emphasis on elegant visualization and API-first embedding approach.
Pros:
- AI-Powered Analytics: Luzmo leverages AI-driven tools to provide insightful recommendations, improving efficiency and enhancing the user experience by making it easier to extract valuable insights from data.
- Elegant Visualization: The platform is designed with a focus on elegant and sophisticated visualizations, ensuring a high-quality and visually appealing analytics experience.
- Flexible Embedding Options: Luzmo supports seamless integration via web components and a robust API, allowing for versatile embedding into your application. It also offers embedded analytics filters and drill down capabilities for in-depth data exploration.
- Robust multi-tenancy support.
Cons:
- No Row-Level Access Control: Luzmo does not include row-level access control, which might be a limitation for businesses requiring detailed data security and multi-tenant environments.
- Non-Git-Based Version Control: The platform uses a non-Git-based version control system, known as Version History. While it allows tracking of changes and reverting to previous versions, it may lack the advanced features of Git-based systems.
Pricing:
- Starting at $3,100+: Luzmo’s pricing begins at $3,100+ for unlimited white-label embedded dashboards. This model provides extensive embedding capabilities but may require consideration of the cost relative to your needs.
3. Sisense
Sisense provides a flexible, code-based approach to embedded analytics.
Sisense's APIs and level of extensibility are some of the best in the embedded game. This also means Sisense's pricing for embedded analytics is also prohibitively expensive, as many have pointed out.
Key Embedded Features
- Robust embedding options with a fully customizable API and Compose SDK, allowing developers to tailor the look and feel of dashboards to match their in-app branding and user experience.
- Embedding via JS SDK, REST API, or iframe
- Fusion platform offers end-to-end control over data pipeline, modeling, and visualization.
- Sisense’s Elastic Data Engine for handling large, complex datasets from multiple sources.
Limitations
- Pricey for smaller teams or startups. Sisense’s pricing model can be expensive, particularly for larger deployments or highly customized solutions. Sisense pricing starts from $21K per year.
- UI customization and dashboard UX can feel clunky without heavy lifting
Pricing
- Custom Pricing: Costs vary depending on deployment size, number of users, and specific features required; may be on the higher side for large-scale implementations.
4. Explo
Explo is a customer-facing analytics platform designed with a strong emphasis on customization and ease of use.

Key Embedded Features
- Fast to set up - handles row-level permissions and multi-tenant routing out of the box
- Clean embedding interface with drag-and-drop builder for non-technical teams
- Good for customer-facing analytics with minimal configuration
Limitations:
- Lack of Row-Level Access Control. This might be a drawback for businesses requiring granular data security and multi-tenant environments.
- Limited modeling and transformation features - assumes you’ve prepped your data upstream
Pricing: Starting at $1,995+: Explo’s pricing begins at $1,995+ for unlimited white-label embedded dashboards. This pricing model offers a clear and scalable solution for businesses needing extensive embedding capabilities.
5. GoodData
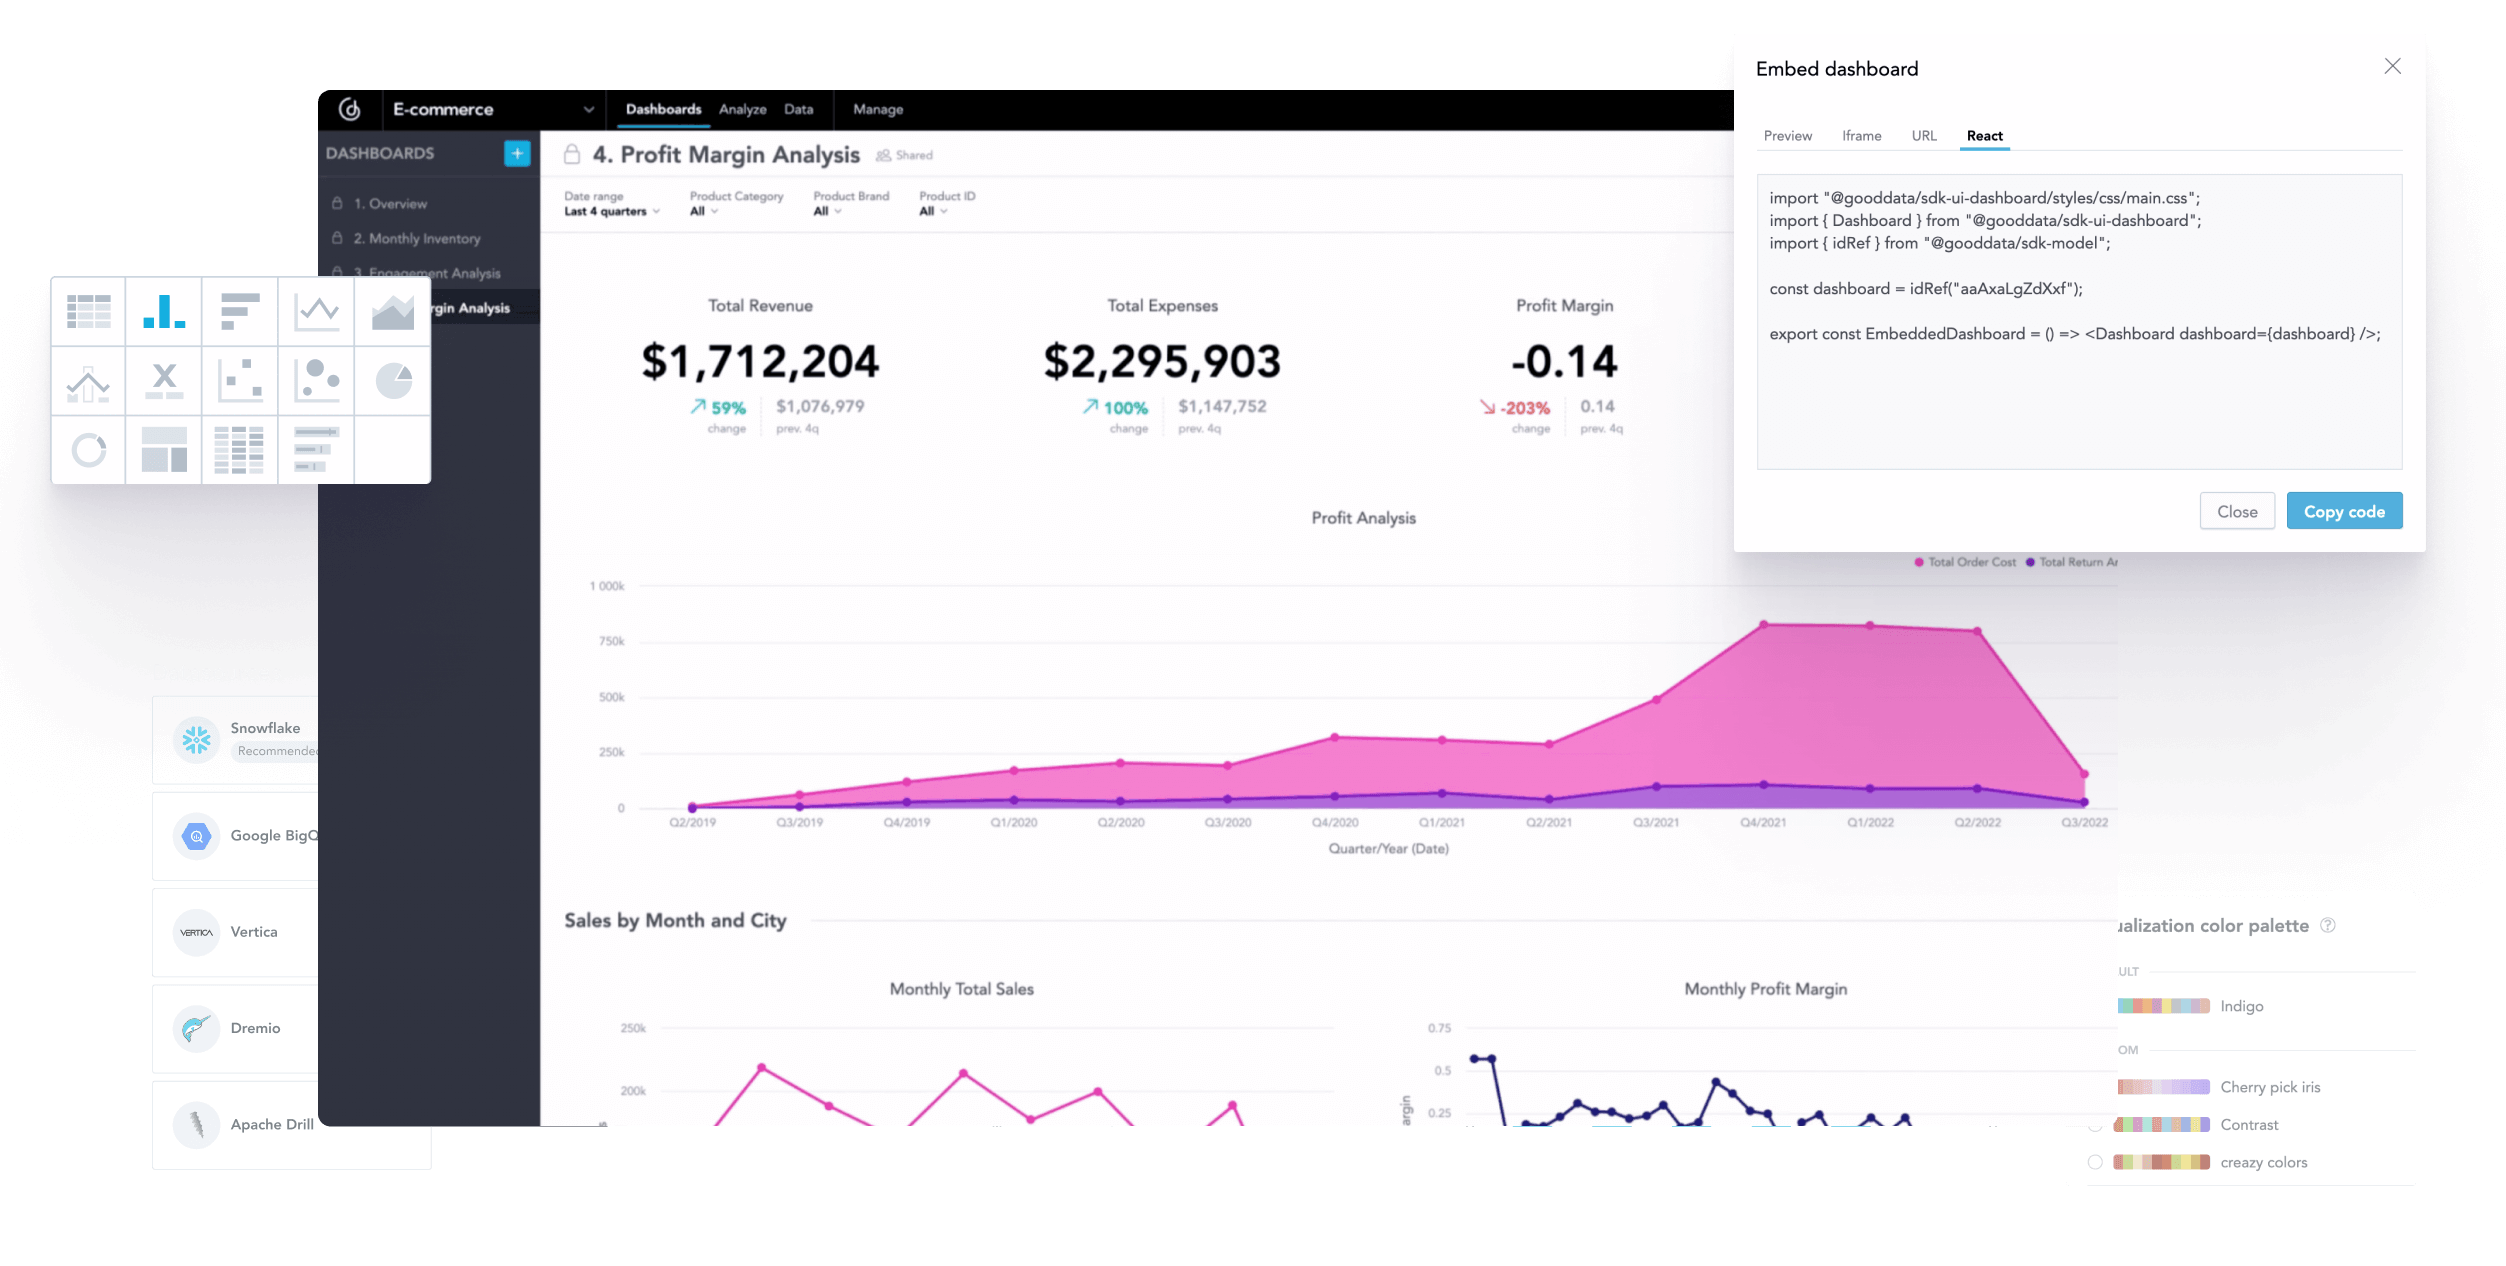
GoodData is an AI-powered data analytics platform, best for creating customized data products with interactive analytics capabilities. It also offers a robust embedded analytics solution with extensive embedding options.
Key Embedded Features
- Robust embedding options. You can either add GoodData dashboards to your website using iframes or use GoodData.UI library - which is a Typescript framework best for building analytical web applications on top of GoodData Cloud and GoodData Platform, offering Web components, React components, and Rest API clients.
- Row-level security, multi-tenant support, and SOC 2 compliance, ensuring robust data governance for enterprises.
- Strong API capabilities, allowing developers to customize and automate analytics workflows.
Limitations:
- Limited visualization options. While functional, GoodData's visualizations may feel basic compared to more visually rich platforms like Tableau or Domo.
Pricing: Embedded pricing starts from $1500/month, with unlimited users and data. You’ll be charged by platform fee and the number of workspaces.
6. Toucan Toco
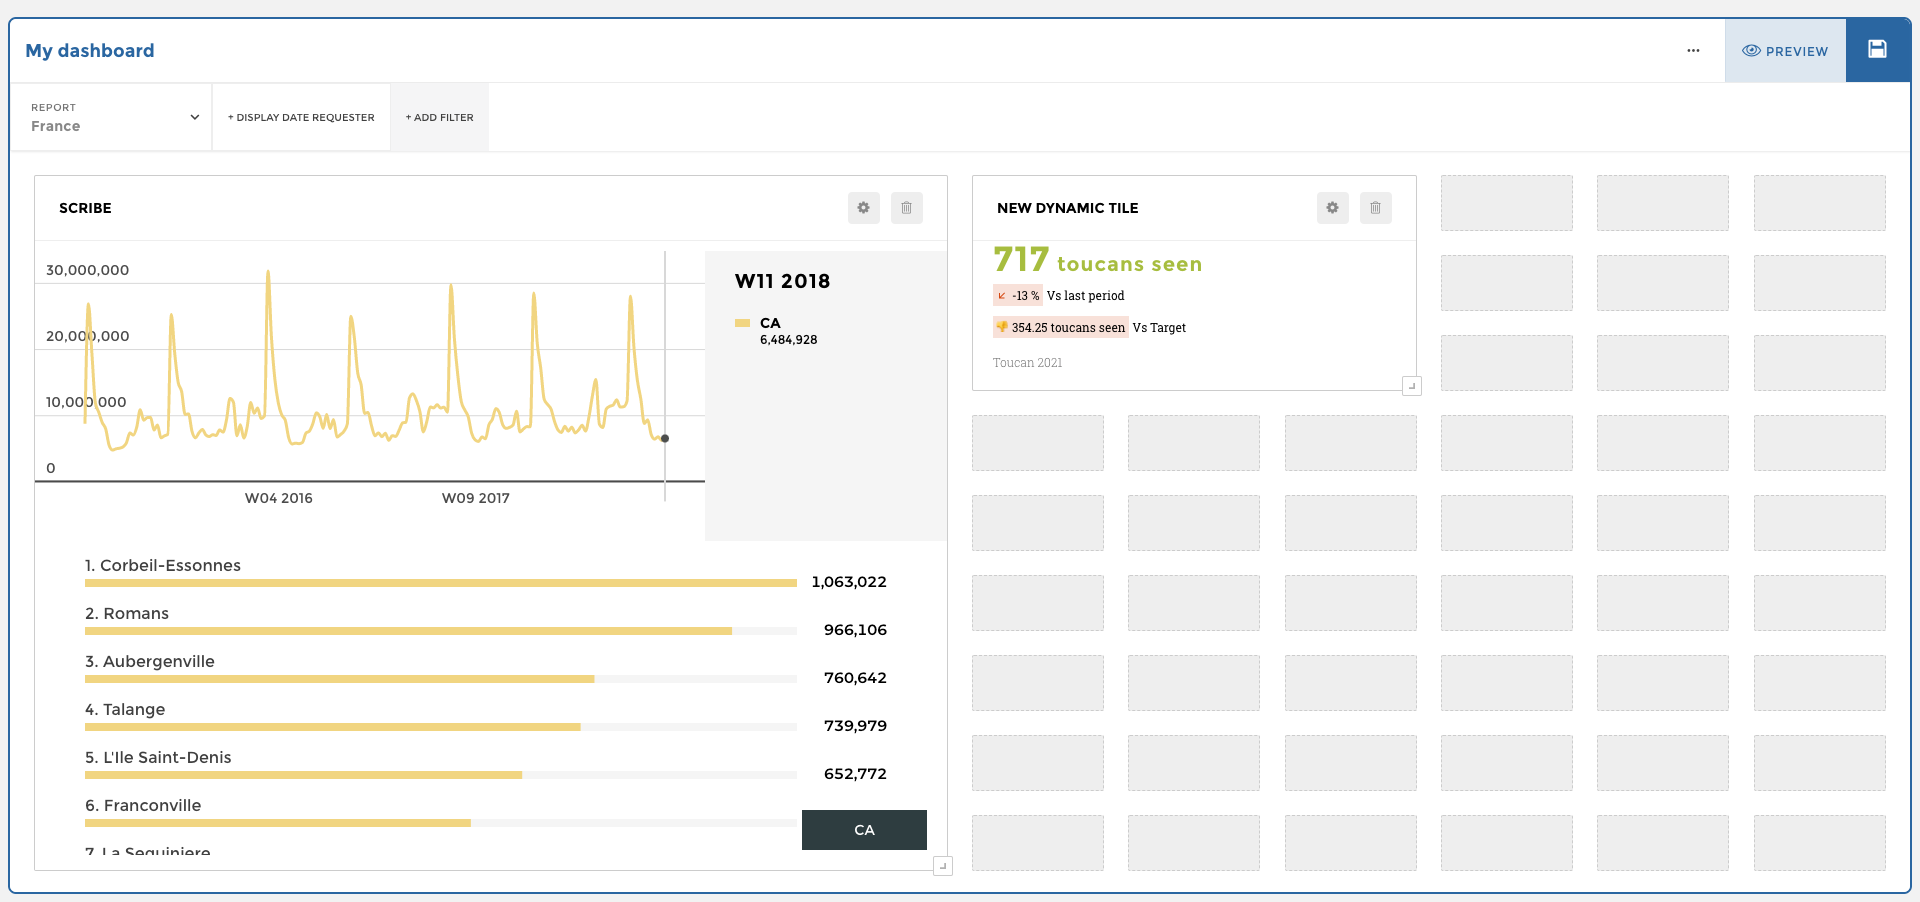
Toucan is designed to deliver storytelling-focused, mobile-friendly embedded dashboards with minimal lift from engineering teams.
Key Embedded Features
- No-code builder designed for non-technical users
- Storytelling layout engine to guide users through insights step-by-step
- Strong branding and white-labeling out of the box
Limitations
- Less flexible than SDK-based options
- Not ideal for complex or deeply interactive analytics use cases
7. Qrvey
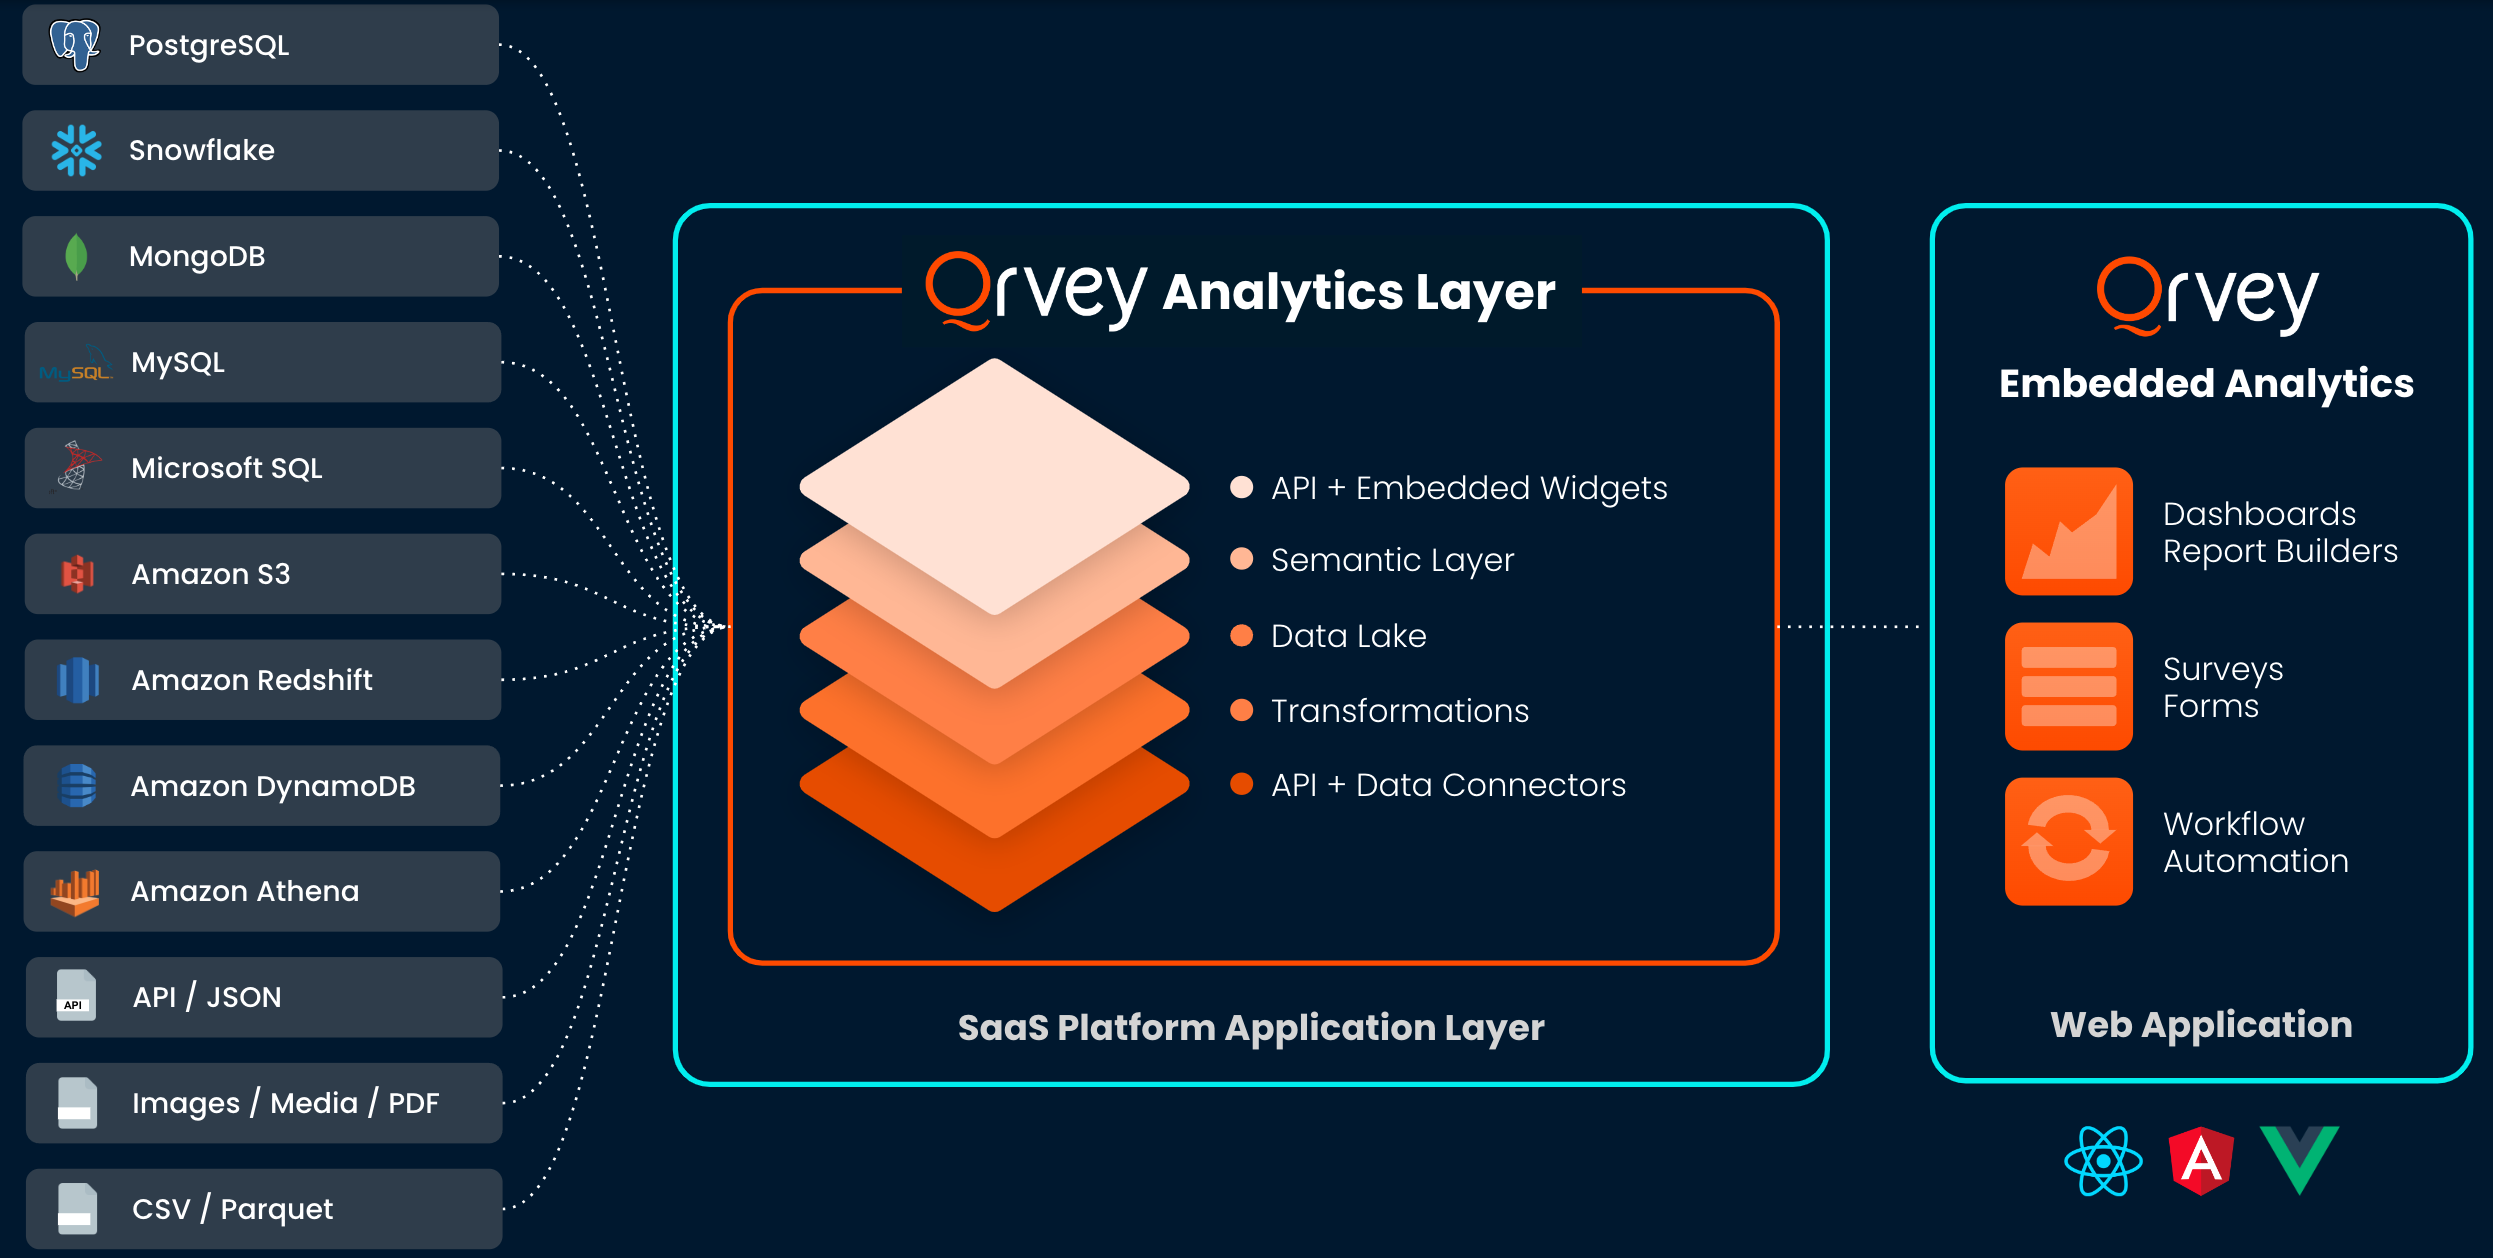
Qrvey positions itself as a full-stack embedded analytics platform built specifically for AWS-native applications. It includes ETL, warehousing, and embedded dashboards in one stack.
Key Embedded Features
- Serverless architecture optimized for AWS (runs inside your VPC)
- Built-in event-based triggers and data automations
- Good support for compliance-sensitive industries
Limitations
- Not ideal for non-AWS environments
- UI is less polished compared to newer embedding players
Open-Source Embedded Analytics Tools
Open-source tools can be a great fit if you need maximum control over your embedded analytics stack and have the engineering resources to manage hosting, security, and customization. While they don’t always match the polish or out-of-the-box features of commercial tools, they often excel in extensibility and transparency.
1. Preset
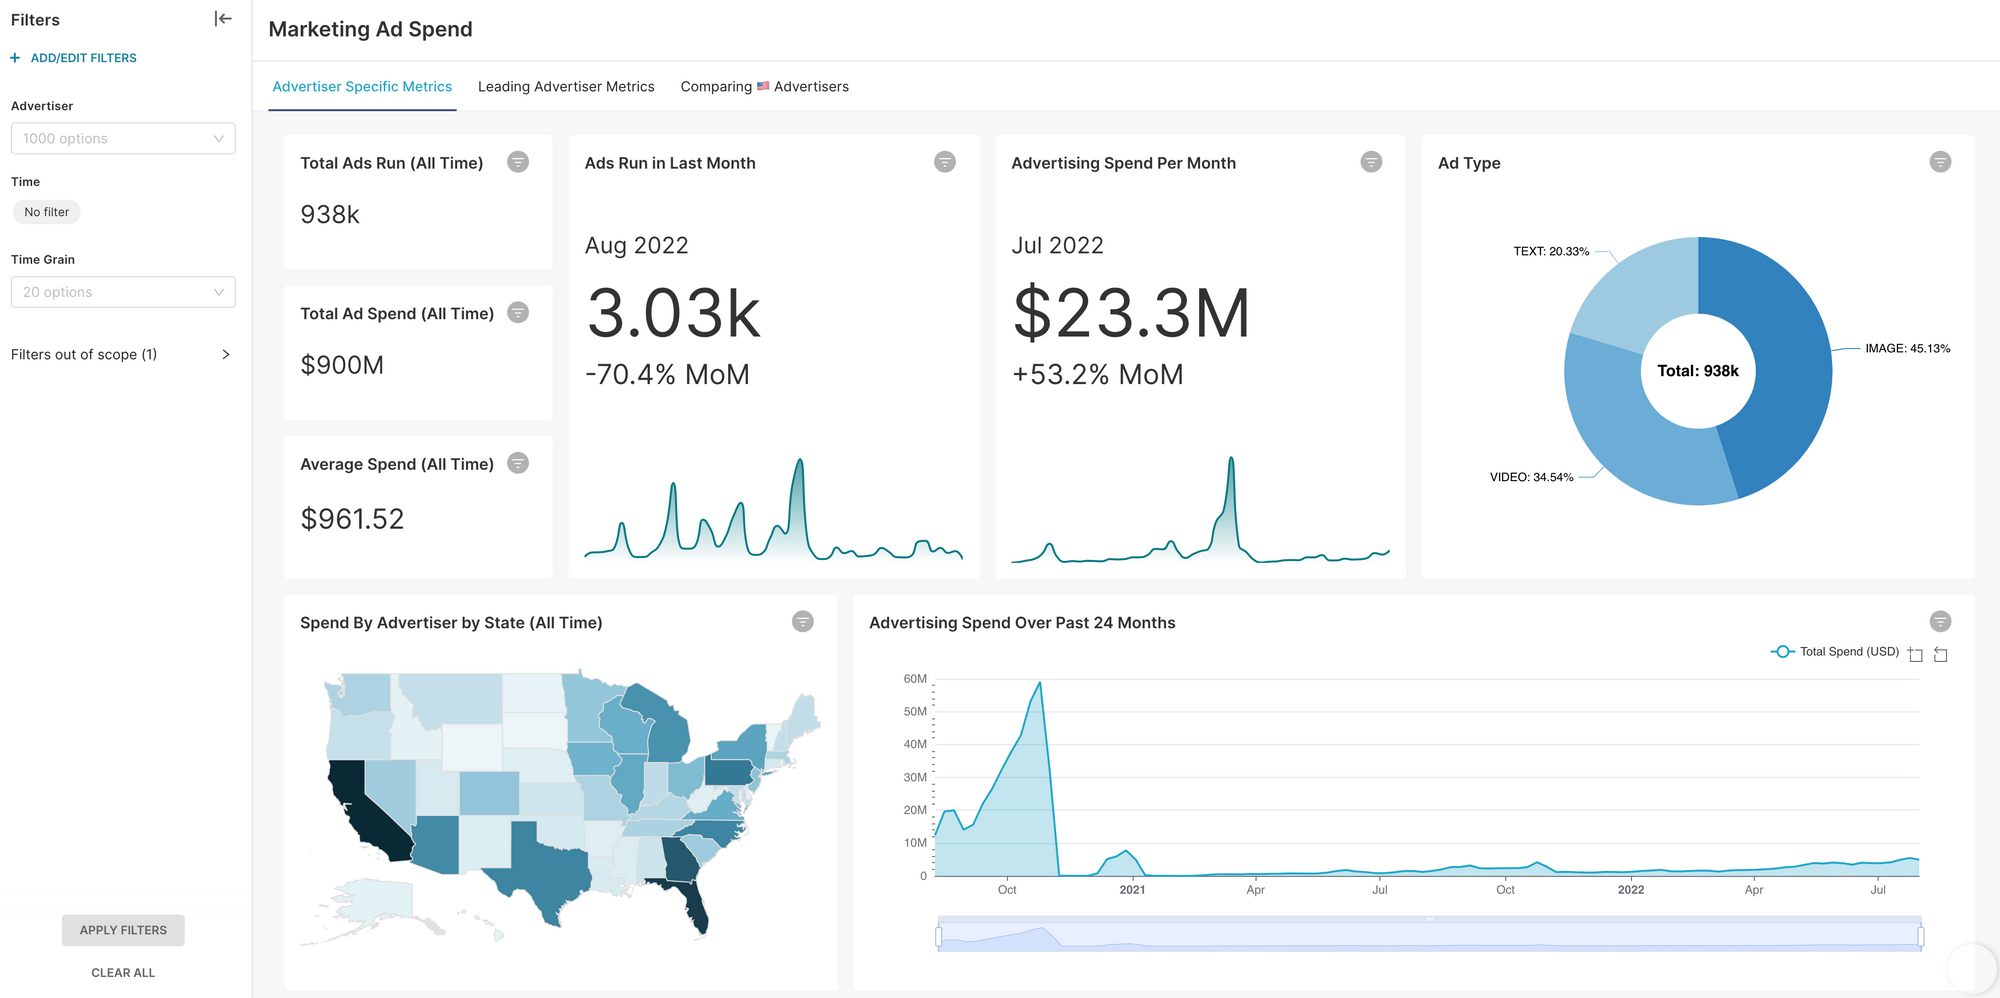
Preset is a cloud-hosted data exploration and visualization platform built on top of the popular open-source project Apache Superset. You can embed Preset dashboard via iFrame.
Key Embedded Features
- Built on Apache Superset, Preset allows customization and benefits from community-driven updates and plugins.
- Preset’s pricing is attractive to small teams and startups, offering a low-cost entry point to embedded analytics.
- Supports advanced filtering, drilldowns, and SQL queries for in-depth data exploration.
Limitations
- Limited advanced customization. While Preset is highly customizable, its flexibility may not match more sophisticated platforms in this list.
- Learning curve for SQL-based queries. Non-technical users may face challenges with SQL-based querying, requiring additional training or relying on technical teams to build advanced reports and dashboards.
- Limited advanced features. It lacks some enterprise-grade features like "analytics as code" and built-in AI found in larger platforms.
Pricing: Preset’s dashboard embedding is only available to Pro and Enterprise plans, which start from $25/month/user.
2. Grafana
Originally built for monitoring and observability, Grafana has expanded into broader data visualization use cases. It’s a popular choice for embedding time-series dashboards into engineering and DevOps products.

Key Embedded Features
- Real-time, high-performance visualizations for time-series and metric data
- Extensive plugin ecosystem for charts, data sources, and alerting
- Embed-friendly via shareable links and iframe with configurable auth
Limitations: Requires technical setup and ongoing server maintenance
Benefits of Embedded Analytics Platforms
👉🏾 Need to win over your CFO on why you absolutely need an embedded analytics platform? No worries, here’s a quick slide-worthy list of benefits. 🙂
Embedded analytics brings a ton of perks to your SaaS product. Here’s the breakdown:
- Contextualized Analytics: Users get real-time insights right within their workflow. No need to bounce between different tools to find the data they need. Everything’s built into the app, making it easier to understand and act on information instantly.
- Boosted Productivity: With analytics embedded directly in the application, users stay focused on their work. No more switching tabs or waiting for reports to come in. Workflows are streamlined, which means more gets done faster.
- Smarter Decisions: When users have access to timely, relevant insights, they make better decisions, faster. Embedded analytics encourages a data-driven culture where decisions are backed by real-time data—not guesswork.
- Competitive Edge: Embedded analytics can be a key differentiator in a crowded market. It gives your SaaS product that extra something that sets it apart from the competition and attracts more customers.
- New Revenue Streams: Advanced analytics can be offered as a premium feature, opening up fresh revenue opportunities. Customers love paying for deeper insights and better decision-making tools (your CFO will love this part!).
For an express guide for SaaS embedded analytics, check out this post.
FAQ: What Is Embedded Analytics?
What Is Embedded Analytics?
Simply put, embedded analytics platforms (or customer-facing analytics, as some call it) let you integrate data visualization and reporting directly into your application. Imagine having all your important data insights right where you and your users need them, without switching between platforms.
Build vs Buy: Do I need an embedded analytics platform?
Well, it depends.
If you’re just starting out, you probably don’t need it yet. But as your business grows and your customer base expands, there will come a point where your users will get frustrated that they can’t access the data they need directly in your product. That’s where embedded analytics comes in—it delivers real-time insights right in the workflow, saving you the headache of building and maintaining a separate analytics platform from scratch.
Is it complicated to set up?
Not necessarily. The complexity depends on the tool you choose. Some solutions are plug-and-play, getting you up and running in no time, while others might require a bit more elbow grease.
Do I need a data team to manage embedded analytics platform?
Not necessarily. While having a data team is always a plus - especially if you want to serve embedded dashboards to a lot of clients, many embedded analytics tools are designed with user-friendliness in mind. They offer intuitive interfaces and guided setups, so even if you’re not a data expert, you can still get things up and running.
Related reading: Community Crowd-Sourced BI Tools Comparison Matrix: Feature-to-Feature Comparison
Final Words
Embedded analytics tools present an opportunity for a fresh data-driven culture, one that can help companies yield a higher ROI by saving time and allowing business stakeholders to interpret data according to their needs contextually.
Thinking of where to start?
Reach out to sales to discuss the future of a tailored Holistics embedded analytics solution or explore a free trial here.
What's happening in the BI world?
Join 30k+ people to get insights from BI practitioners around the globe. In your inbox. Every week. Learn more
No spam, ever. We respect your email privacy. Unsubscribe anytime.

